


Objective identification research on cold vortex and mid-summer rainy periods in Northeast China*
[Gong Zhi-Qianga)†  , Feng Tai-Chen
b) , Fang Yi-Hec) ]
, Feng Tai-Chen|
|


†Corresponding author. E-mail: gzq0929@126.com
*Project supported by the National Natural Science Foundation of China (Grant Nos. 41205040 and 41375078), the State Key Development Program for Basic Research, China (Grant No. 2012CB955203), and the Special Scientific Research Project for Public Interest (Grant No. GYHY201306021).
Considering the differences between the Northeast China Cold Vortex (CV) and the Mid-Summer (MS) rainy period and their corresponding atmospheric circulations are comprehensively analyzed, and the objective identification methods of defining the annual beginning and ending dates of Northeast China CV and MS rainy periods are developed respectively. The annual beginning date of the CV (MS) rainy period is as follows. In a period from April to August, if daily regional mean precipitation r yi is larger than yearly regional mean precipitation R (or 2 R) on a certain day, the station precipitation r s is larger than the station yearly mean precipitation 〈 r〉 (or 2〈 r〉) in at least 50% of stations in Northeast China, and this condition is satisfied in the following 2 (7) days, then this date is defined as the beginning date of the CV (MS) rainy period. While the definition of the ending date of the MS rainy period shows the opposite process to its beginning date. With this objective identification method, the multi-year average (1981–2010) beginning date of the CV rainy period is May 3, the beginning date of the MS rainy period is June 27, the ending day of the CV rainy period is defined as the day before the beginning date of the MS rainy period, and the ending date of the MS rainy period is August 29. Meanwhile, corresponding anomaly analysis at a 500-hPa geopotential height, 850-hPa wind, Omega and relative humidity fields all show that the definitions of the average beginning and ending dates of the CV and MS rainy periods have a certain circulation meaning. Furthermore, the daily evolution of the CV index, meridional and zonal wind index, etc. all show that these objectively defined beginning and ending dates of the CV and MS rainy periods have climate significance.
The climate system is a complicated fuzzy system, which causes the precipitation to have typical non-stationary and nonlinear characteristics.[1– 5] Monitoring the rainy season has always been an important issue of East Asian monsoon research. In the 1930s and 1940s, researches have revealed that after the outbreak of the South China Sea monsoon from May to August, the advance and retreat of the rain belt leads to the formation of a pre-flood season in South China, the Meiyu season in the Yangtze River, and the Huai River, and a rainy season in North China.[6, 7] Currently, there are a relatively large number of researches on the objective identification of pre-flood season in South China and the Meiyu season, [8– 10] while a relatively small number of researches on the division criteria for the beginning and ending dates of the rainy season in other regions. Zhao[11] tried to use 10-day precipitation as the unit for defining the rainy season in North China. Yan et al.[12] adopted 5-day precipitation as the unit to study the division criteria for the beginning and ending dates of the rainy season in Southwest China. Wang et al.[13] used the 10-day precipitation data of nine stations to study the division of the rainy season in Northeast China. In recent years, Lau and Yang[14] took the average climate precipitation of 5 mm as the division criteria for the beginning and ending dates of the rainy season in East Asia. Wang and Yang[15] used the relative climate precipitation to define the rainy season in Asia. Samel et al.[16] used the objective analysis methods to discuss the advance of the monsoon rainy season belt in eastern China.
Currently, the rainy season is divided mainly in the following different ways. (i) The time of the rainy season is roughly divided according to the general changes of the rain belt within a year. (ii) Through the decomposition of empirical orthogonal function (EOF) of national or local precipitation, the major rain types are divided.[17] (iii) An index station method is adopted.[16] (iv) The corresponding correlation coefficient method.[18] These methods show some effects in previous rainy season identification and scientific research. These methods also have some shortfalls, i.e., the identification accuracy might be relatively low, their dependences on time and space are great, the temporal resolution is insufficient, etc. Meanwhile, the real-time precipitation monitoring has been carried out in 2300 stations by the China meteorological administration (CMA), and new challenges are presented for accurately and objectively monitoring the beginning and ending time of the main rainy period in Northeast China. As Northeast China is the major grain production base in China, the precipitation in the main rainy period has a great influence on the production in this region. Therefore, the objective identification of the beginning and ending dates of the main rainy period in Northeast China is an important meteorological service, which plays an important role in agricultural production and governmental decision-making.
In addition, Sun et al.[19] conducted research on the division criteria of the multi-rainy season. They pointed out that the position of the subtropical high ridge line is taken as division criteria for obtaining the annual beginning and ending date of multi-year rainy season, including the rainy season of Liaoning province. Besides, the onset, retreat, and intensity change of the monsoonal rainy season over Northeast China are mainly signified by the moisture input condition along the southern border of this area. The establishment of East Asia summer monsoon is in from 10 July to 20 August in Northeast China and the onset in the west is earlier than that in the east.[20] Shen et al.[21] have noted that in early summer (May and June), the precipitation in Northeast China is mainly affected by the northeast cold vortex (CV). With the northward advance of the West Pacific subtropical high, the influence of the northeast CV is weakened gradually, while the East Asian summer monsoon begins to have a critical influence on the precipitation in Northeast China during mid-summer (July and August). Li et al.[22] have analyzed the relationship between Liaoning early summer precipitation and the northeast CV. They pointed out that the northeast CV is a major influencing factor of Liaoning early summer precipitation. Shi et al.[23] revealed that the East Asian summer monsoon is the main reason for China’ s summer temperature and precipitation anomalies. Lian et al.[24, 25] have further analyzed the establishment criteria, date and main characteristics of the East Asian summer monsoon in the northeast region of China, and defined the summer monsoon intensity index. They also addressed that the east Asia summer monsoon formed in Northeast China in late July, and retreated in middle August.[24] Furthermore, other scholars have conducted appropriate studies in relevant fields, [26, 27] and meaningful conclusions have been achieved. Therefore, the comprehensive consideration of the rainy period beginning under the influence of an early summer cold vortex, and ending under the dominant influence of summer monsoon in Northeast China will be very helpful to better carry out the monitoring and research on the rainy season. Meanwhile, various forecasting methods have also been proposed successively, i.e., similar dynamical method, [28] and the method based on the principle of automatic memory of atmosphere, [29, 30] and these methods have been extended to East Asia, [31] Northeast China, etc.[32] and other regions.
This paper focuses on the characteristics of early summer cold vortex precipitation and mid-summer precipitation in Northeast China. The 1961– 2011 daily precipitation data are used to study the objective identification method of Northeast CV and MS rainy periods based on the 5-point smooth daily precipitation sequence in Northeast China. Moreover, the comparative tests and circulation analysis are also conducted to verify the reliability, in order to provide technical support for national climate monitoring and scientific research.
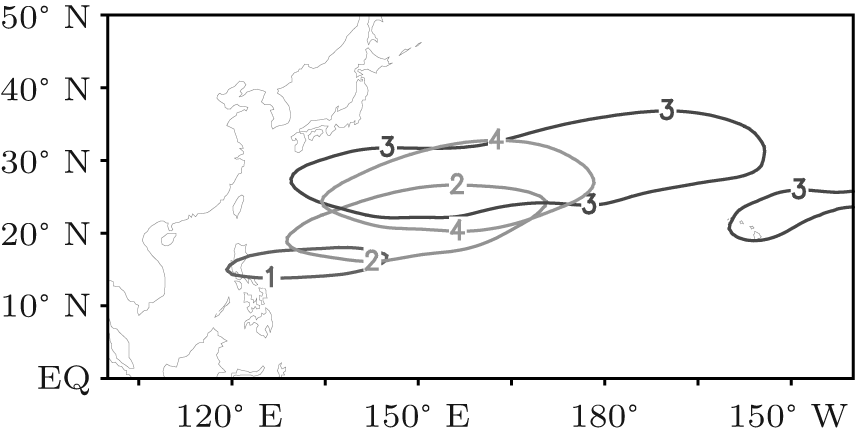
The high-resolution daily precipitation data of 2400 stations nationwide provided by the National Climate Centre are used to obtain the daily precipitation data of 147 stations in three northeastern provinces (Liaoning, Jilin, and Heilongjiang) and eastern Inner Mongolia in 1961– 2011 by quality control (Fig. 1). The NCEP/NCAR reanalysis daily geopotential height field, wind and vertical velocity (omega) field data, relative humidity (resolution: 2.5° × 2.5° ) are used. The 1981– 2010 climate average is taken as the multi-year mean.
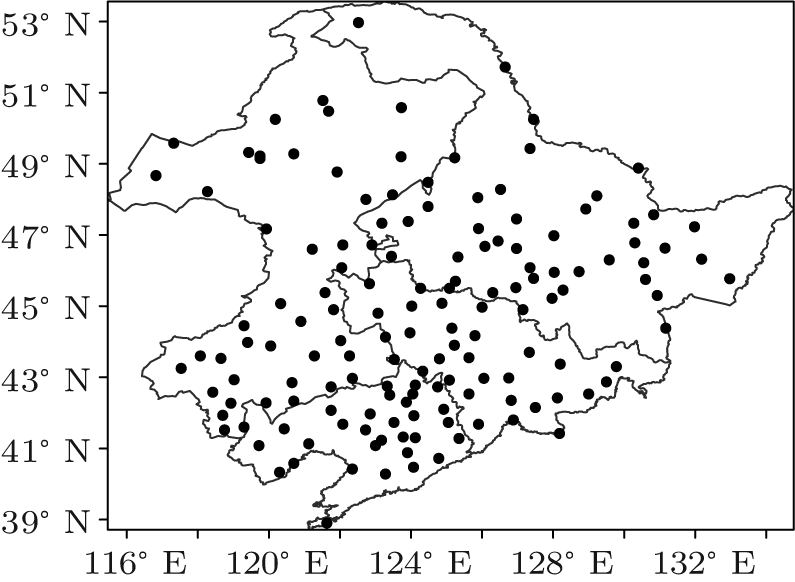 | Fig. 1. Geographic distribution of 147 stations in Northeast China. |
During the research on objective identification method of the rainy period, it is required to analyze and define the corresponding beginning or ending date. Currently, research on the beginning and ending dates of a rainy period mostly use the changes of daily precipitation and 5-day precipitation for definition.[33] Daily precipitation is more accurate than 5-day precipitation, but daily-scale precipitation shows great fluctuations. Therefore, the 5-point smooth method is adopted for smoothing the multi-year average daily precipitation sequence in Northeast China from April 1 to October 31 and the daily change sequences of different climate indices, so as to study the objective identification method of the rainy period in Northeast China. As the CV has a great influence on precipitation in Northeast China, [21] and CV frequently happened in May and June, the multi-year beginning date of the Northeast China rainy period will be no earlier than May. Meanwhile, as the establishment of an East Asia summer monsoon is in Northeast China from 10 July to 20 August and the EASM has a great influence on precipitation in Northeast China, [20] the multi-year ending date of the Northeast China rainy period will be no later than August.
In the previous research on the division of the rainy period, two thresholds are often used. One is R, the mean of yearly 5-day moving average precipitation of multi-year average in Northeast China, [19] the other is 2R.[12] It is defined that the first day with ri greater than R in a period from 1st June to 31st June is defined as the beginning date of multi-year average CV rainy period in Northeast China; the day with ri stably greater than 2R is defined as the beginning date of multi-year average MS rainy period; while the day with ri is stably smaller than 2R is defined as the ending date of multi-year average MS. Obviously, the day before the beginning date of MS is the ending date of CD. Here, ri is the daily 5-day moving average precipitation sequence of the multi-year average in Northeast China (i denotes the date).
The objective identification of the multi-year rainy period in Northeast China is based on the identification method of the multi-year average rainy period, through further comparative test to determine the consecutive number of days (n) beyond the threshold, so as to ultimately obtain the objective identification method. The consecutive number of days (n) beyond the threshold is determined by comparative tests with different criteria.
The following comparative test is used in the identification of the beginning date of the multi-year rainy period. From April 1 (June 1), when ryi > R (2R) on a certain day of a certain year and rs > 〈 r〉 (2〈 r〉 ) in more than 50% of northeast stations, the date will be taken as the undetermined date for the beginning date of the CV (MS) rainy period. If ryi > R (2R) is satisfied in the consecutive n days, then the undetermined date will be identified as the beginning date of the CV (MS) rainy period, where n = 0– 5 (10), corresponding to the 6 (11) groups of comparative tests in the CV (MS) rainy period respectively.
The following comparative test is used for identifying the ending date of the multi-year rainy period. In a period from August 1 to September 30, when ryi < 2R on a certain day of a certain year and ryi < 2〈 r〉 in more than 50% of northeast stations, the date will be taken as the undetermined date for the ending date of the MS rainy period. If ryi < 2R is satisfied in the consecutive n days, then the undetermined date will be identified as the ending date of the MS rainy period, where n = 0– 9, corresponding to the 10 groups of comparative tests in the MS rainy period. Among them, ryi is the daily 5-day moving average precipitation sequence in a certain year on average in Northeast China (y is the year, and the interval is from 1961 to 2011; i is the date); rs is the single-station daily 5-day moving average precipitation on a certain day in the corresponding year of ryi; 〈 r〉 is the yearly mean of single-station daily 5-day moving average precipitation; n is the consecutive number of days beyond the threshold, after ryi passes through the threshold on the first day, and the value of n needs to be determined by the following comparative tests. As the CV rainy period is just followed by the MS rainy period, therefore the day before the beginning date of the MS rainy period is defined as the ending date of the CV rainy period.
Statistics is applied to the total daily frequency of Northeast CV in 1961– 2010, then normalization is carried out to obtain a 5-day moving average, so as to obtain the daily Northeast CV frequency. Due to the Northeast CV mainly manifesting at a 500-hPa geopotential height, [34] Sun et al.[35] also used the value at a 500-hPa geopotential height to define the Northeast CV index. Therefore, the daily average index of Northeast CV located key region (115° E– 145° E, 35° N– 60° N) in the 500-hPa height field is calculated by referring to the work of Sun et al., [35] i.e., the multi-year average of 500-hPa geopotential height field in Northeast China is calculated, and then normalized to obtain a 5-day moving average, so as to obtain a daily height field evolution index. As many summer monsoon indices are not closely related to the northeast precipitation, the multi-year average is solved based on the northeastern (100° E– 140° E, 40° N– 60° N) average 850-hPa meridional and zonal wind field, so as to obtain daily meridional and zonal wind index.
As viewed from the monthly precipitation changes in Northeast China from May to August, the rainy period in Northeast China first starts from the southeast coast, and then gradually advances to the northwest inland. The CV begins to exert an influence on the precipitation in Northeast China in May and June in early summer of Northeast China, and the beginning date of the CV rainy period should be roughly in May.[21] While the east Asia summer monsoon starts to influence the Northeast of China in late July and weaken in late August, and the MS rainy period mainly contains July and August with the most precipitations, so that the beginning date should be roughly in the end of June or early July, and the ending date should appear roughly in the end of August or early September.[13, 20]
During the objective identification of the multi-year average rainy period in Northeast China, the annual evolutionary characteristics of the variation curve of the multi-year average on daily 5-day moving average precipitation (ri) are mainly analyzed. Figure 2(a) shows the variation curve of ri. It can be seen that from April 1 to May 18, ri slowly rises in fluctuation, of which the first sharp increase is intersected with R on May 3. This sharp increase should be related to the influence of early summer CV on precipitation in Northeast China.[14, 18] Therefore, May 3 can be considered as the beginning date of the CV rainy period. There is a sharp increase intersected at 2R on June 27, which seems to be a new beginning date of the rainy period in late June or early July. As July and August are the summer in Northeast China, [14] this date can be regarded as the beginning date of the Northeast MS rainy period. After the second sharp increase, ri is still on the rise, and reaches the peak in a period from late July to early August. From August 1 to October 31, ri shows two steep declines. After the first steep decline, the precipitation is still larger than 2R, which is not suitable for serving as a criterion for the ending date of the rainy period. In the second steep decline, the precipitation decreases significantly, and ri has two intersections with 2R (Fig. 2(a)). This intersection less than 2R occurs on August 29, corresponding to the summer wind withdrawing from the northeast, which may be referred to as the ending date of the MS rainy period.
To define the beginning and ending dates of the rainy period in a region, not only should the change of precipitation be a concern, but also the spatial scale of precipitation should receive attention. Figure 2(b) shows the percentage of the stations with single-station precipitation beyond R and 2R among the 147 northeast stations of total northeast stations. It can be seen from Fig. 2(b) that the date with the percentage first more than 50% occurs on May 3, which is consistent with the date when ri is first over the threshold R in Fig. 2(a). As viewed from Fig. 2(b), the date with the percentage stably more than (less than) 50% occurs on June 27 (August 29), which is also consistent with the date when ri is stably over (below) the threshold 2R in Fig. 2(a). The previous definitions of the beginning and ending dates of Northeast CV (MS) rainy period with rationality are further proven.
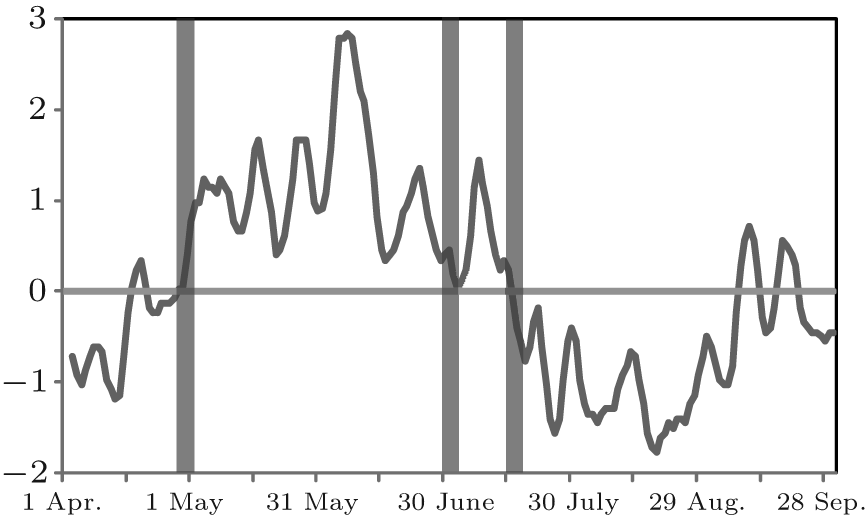
In addition, the multi-year average on the changes in daily EOF first mode time coefficient can reflect seasonal change characteristics to a large extent. Figure 3 shows the EOF first mode (EOF1) standardized time coefficient curve of the average on daily (365-day) moving average precipitation in the northeast region from 1981 to 2010. The change curve of the daily standardized time coefficient is almost consistent with the change in multi-year average daily precipitation in Northeast China given by Fig. 1(a). The case with the standardized time coefficient greater than 1 is commonly considered to be anomalous, which can be a multi-rainy period, while the interval with the standardized coefficient greater than 0 can be understood as the rainy period. It can be seen in Fig. 3 that the standardized time coefficient on May 3 is first greater than 0, which is exactly the same as the previously defined beginning date of the Northeast China CV rainy period. The standardized time coefficient on June 16 is stably greater than 1, while that on August 29 is stably less than 1, which is basically consistent with the previously defined beginning and ending dates of the MS rainy period in the Northeast of China. Therefore, the standardized time coefficient of EOF1 of multi-year average on daily moving mean precipitation further indicates the rationality of using R and 2R as thresholds to determine the beginning and ending dates of the multi-year average rainy period in Northeast China.
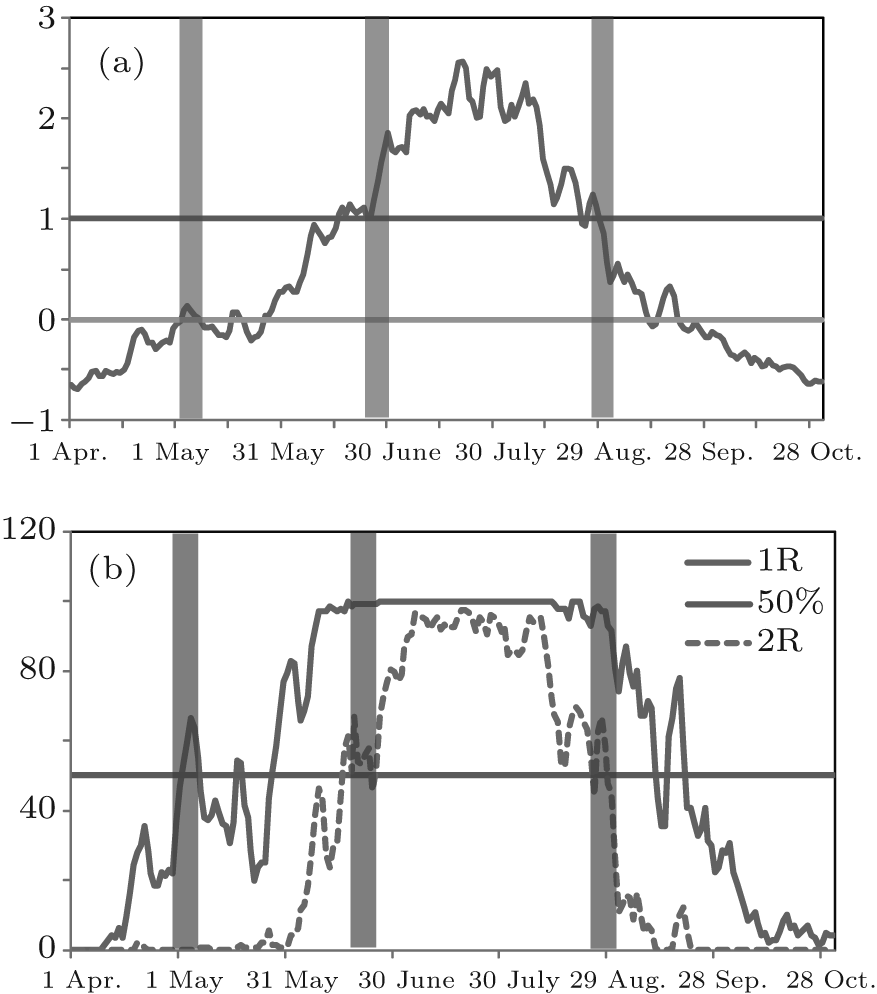 | Fig. 2. (a) Multi-year average curve on daily 5-day moving average precipitation (in unit: mm) of Northeast China from April 1 to October 31; (b) the percentage (in unit: %) of the stations with single-station daily 5-day moving average precipitation beyond R and 2R of total stations. The green line and red line in panel (a) denote the R and 2R, respectively. The red line in panel (b) denotes 50%. |
 | Fig. 3. Standardized time coefficient of EOF1 of multi-year average on daily moving mean precipitation. |
In summary, the objective identification method given in Subsection 2.2.2 can be used to effectively realize the objective identification of the rainy period in Northeast China. Combining the comparative analysis between ri and the threshold, the beginning dates of the CV and MS rainy period are preliminarily defined respectively on May 3 and June 27, and the ending date is August 29. CV and MS are two continual rainy periods, so the day before the beginning date of the MS rainy period is defined as the ending date of the CV rainy period.
The multi-year daily 5-day moving average precipitation in Northeast China always shows more significant fluctuations around R (2R). Therefore, to determine the division criteria of the annual beginning and ending dates of the rainy period in historical years, the durations with daily moving average precipitations more and less than R (2R) must be considered. In this section, different standard tests of the days with daily moving average precipitation consecutively over R (2R) are performed to further study the definition criteria of the beginning and ending dates of the rainy period in Northeast China.
According to the comparative test schemes given in Subsection 2.2.3, the multi-year beginning and ending dates of rainy period in the northeast area are objectively identified. First, based on 3 groups of comparative tests designed for the research on objective identification of the beginning date of the CV rainy period, the division results of a 51-year period beginning and ending dates of the rainy period in the northeast area from 1961 to 2011 are calculated.
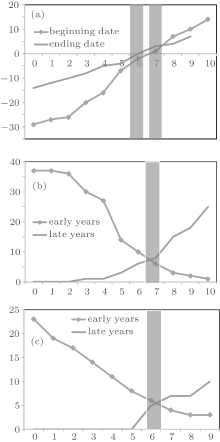
Figure 4(a) shows the curve of difference between the annual average beginning date number of the CV rainy period obtained by different comparative tests and the multi-year average beginning date number of the CV rainy period. In the figure, the beginning and ending date numbers of the rainy period are both the beginning date from April 1 plus 1, and the abscissa represents the n value of different comparative tests. It can be seen in Fig. 4(a) that when the number of the days consecutively over threshold (n) is changed from 0 to 3, the difference curve between the annual average beginning date of the CV rainy period and the multi-year average beginning date of the CV rainy period is on the rise, and the difference curve value is changed from negative to positive, i.e., the annual average beginning date is changed from early to late compared with multi-year average beginning date. n ≈ 2 is the “ zero point” , and therefore, the annual average beginning date is the one that most approaches the multi-year average beginning date with n = 2. In order to further verify the rationality of using the comparative tests with n = 2 as objective identification criterion of the beginning date of the CV rainy period, the number of years with a significant early or late beginning and ending date of the annual rainy period obtained by various comparative tests is also calculated. Figure 4(b) shows the number curve of the years with obviously early or late beginning and ending dates of the annual cold vortex rainy period calculated by different comparative tests, where the abscissa represents the n value of different comparative tests. The number of years with an early (late) beginning date of the cold vortex rainy period shows a trend of decline (up) with the increase in n value (Fig. 4(b)). When n ≈ 2, an intersection point occurs on the number curves of the years with early or late beginning dates, i.e., the years with early or late beginning dates are equal in number, showing that the criterion of n = 2 is moderate, which is consistent with the “ zero point” at on the difference curve of the beginning date of the CV rainy period in Fig. 4(a).
 | Fig. 4. (a) Difference curve between annual average beginning day of the CV rainy period and multi-year average beginning day, and (b) the curves of years with obviously early and late beginning dates of the annual CV rainy period. |
According to the comparative test schemes given in Subsection 2.2.3, the annual beginning and ending dates of the MS rainy period in Northeast China are objectively identified. Based on 11 (10) groups of comparative tests designed to study the objective identification of the beginning (ending) date of the MS rainy period, the division results of the beginning and ending dates of the MS rainy period in Northeast China from 1961 to 2011 are calculated.
Figure 5(a) shows the difference curve between the annual average beginning (ending) date of the MS rainy period obtained by different comparative tests and the multi-year average beginning (ending) date of the MS rainy period. In Fig. 5(a), the difference curve shows a rising trend with the increase in n value, and the difference curve value is changed from negative to positive. In the figure, n = 7 (6) is the “ zero point” , which is suitable for serving as an objective identification criterion of the beginning (ending) date of the MS rainy period.
 | Fig. 5. (a) Difference curves between the annual average beginning (ending) date number of the MS rainy period and the multi-year average beginning (ending) date number of the MS rainy period, and the curves of the years with obviously early and late beginning (b) and ending (c) dates of the annual MS rainy period. |
Figures 5(b) and 5(c) give the numbers of the years with obviously early and late beginning and ending dates of the annual MS rainy period, calculated by different comparative tests. The number of years with an early (late) beginning date of the MS rainy period shows a trend of decline (up) with the increase in n value. When n = 7, intersection points occur on the number curves of the years with early and late beginning dates (Fig. 5(b)), i.e., the value of n = 7 is moderate as a criterion, which is consistent with the “ zero point” on the deference curve of the beginning date of the MS rainy period in Fig. 5(a). The number of years with an early (late) ending date of the MS rainy period also shows a trend of decline (up) with the increase in n value. When n = 6, an intersection point occurs on the number curves of the years with early and late ending dates (Fig. 5(c)), which is consistent with the “ zero point” on the deference curve of the ending date of the MS rainy period in Fig. 5(a). Thus, the selection of n = 7 (6) as a criterion of the beginning (ending) date of the northeast mid-summer rainy period is reasonable.
In order to analyze the circulation differences before or after the rainy periods in Northeast China, four periods according to the multi-year beginning and ending date of CV and MS rainy periods are defined. Period 1 (P1) is two months before the CV rainy period, (i.e., March 2– May 2); Period 2 (P2) is from the day after the beginning day of the CV rainy period to the day before the MS rainy period (i.e., May 3– June 26); Period 3 (P3) is from the day after the beginning day of the MS rainy period to the ending date of the MS rainy period (i.e., June 27– July 29); Period 4 (P4) is two months after the ending day of the MS rainy period (i.e., August 30– October 30).
Based on the beginning dates of CV and MS rainy periods, obtained by the identification of the Northeast China rainy period, referring to the division methods of the above 4 periods, the circulation differences between in 200-hPa, 500-hPa geopotential height fields and in 850-hPa vector wind field are mainly analyzed in this section.
Figure 6 presents the distributions of multi-year average 500-hpa geopotential height field in P1 to P4. During P1, the West Pacific subtropical high (WPSH) pressure is in the initial development stage with a small area, of which the ridge line is located near 15° N, and the rainy period does not start. During P2, the subtropical high pressure area is significantly increased, but the ridge line is northward moved near 20° N, and the west extending ridge point is near 135° E, when the subtropical high pressure has little influence on Northeast China, and Northeast China should be mainly affected by Northeast China CV. During P3, the subtropical high ridge line jumps northward near 30° N, when the subtropical high begins to influence the northeast region, corresponding to the start of the mid-summer rainy period. During P4, the subtropical high ridge line is close to that in Period 3, but the west extending ridge point retreats eastward to around 132° E, and the subtropical high pressure weakens the influence on the northeast region, when this region is mainly affected by the low-level system, corresponding to the end of the MS rainy period.
 | Fig. 6. Distribution diagram of multi-year average 500-hPa subtropical high pressure in different periods. In the figure, numbers 1– 4 represent the 588 contours corresponding to P1 to P4 respectively. |
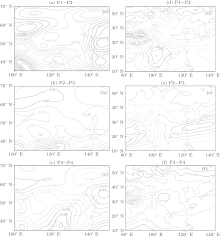
Figure 7 shows the differences in 850-hPa wind field between P2 and P1, between P3 and P2, between P4 and P3. It can be seen from Fig. 7(a) that the difference between P2 and P1 is the high-value zone over the Indian Ocean, Indo-China and South China Sea. Moreover, the difference of northward anomalies is controlled from the Indian Ocean to the northeast region, the same situation is also found in the region from the Northwest Pacific to the Northeast China. The difference obtained through the significance test indicates that during the CV rainy period, the warm moist air flowing from the sea has a stronger influence on the northeast region than during the period before the CV rainy period, which is good for precipitation in Northeast China. It can be seen in Fig. 7(b) that the difference in a 850-hPa wind field between in P3 and in P2 is similar to that indicated in Fig. 7(a). The existence of a northward abnormal wind in Northeast China, proving that the East Asia summer monsoon is strengthened, may enhance the northward movement of water vapor. This wind anomalies may bring more precipitation in Northeast China, which is good for the MS rainy period. Meanwhile, the different situation in Fig. 7(c) is that both South China and Northeast China are controlled by abnormal southward wind anomalies. That is to say, the East Asia summer monsoon decreases after the MS rainy period, which may weaken the northward movement of water vapor. Then the precipitation in Northeast China decreases quickly.
Figure 8(a) shows that the difference in omega field between P1 and P2 is positive in Northeast China, which means the upward movement in P2 is stronger than in P1. A similar situation is also shown in Fig. 8(b), which means that the upward movement in P3 is stronger than in P2. The stronger upward movements in P2 and P3 indicate that the precipitation in Northeast China in P2 might be more than in P1, and the precipitation in P3 is also more than in P2. Otherwise, figure 8(c) shows that the difference in omega field between P3 and P4 is negative in Northeast China, which means that the upward movement in P4 is weaker than in P3. This abnormal situation indicates that there is less precipitation in Northeast China in P4 than in P3. Figure 8(d) shows that the difference in relative humidity field between P1 and P2 is negative in the Indian Ocean, Indo-China Peninsula, and South China sea, which is not good for the northward transformation of water vapor from the low latitude area. It is also shown in Fig. 8(d) that the difference in relative humidity field between P1 and P2 is negative in most parts of Northeast China, which means that the humidity condition for precipitation in P2 is much better than in P1. The relative humidity difference distribution between P2 and P3 (Fig. 8(e)) is similar to that in Fig. 8(d). That is to say, the humidity condition for precipitation in P3 is much better than in P2. Otherwise, the relative humidity difference distribution between P3 and P4 in Fig. 8(f) is quite different. The differences in the Indian Ocean, Indo-China Peninsula, South China sea, and Northeast China are all positive, which means that the northward transform of water vapor from low latitude may decrease and the precipitation condition in Northeast China in P4 is worse than that in P3.
 | Fig. 7. Differences in 850-hPa vector wind field between P2 and P 1 (a), between P3 and P2 (b), and between P4 and P3 (c), (shaded areas represent the regions with the difference obtained through the significance test, in units of m/s) |
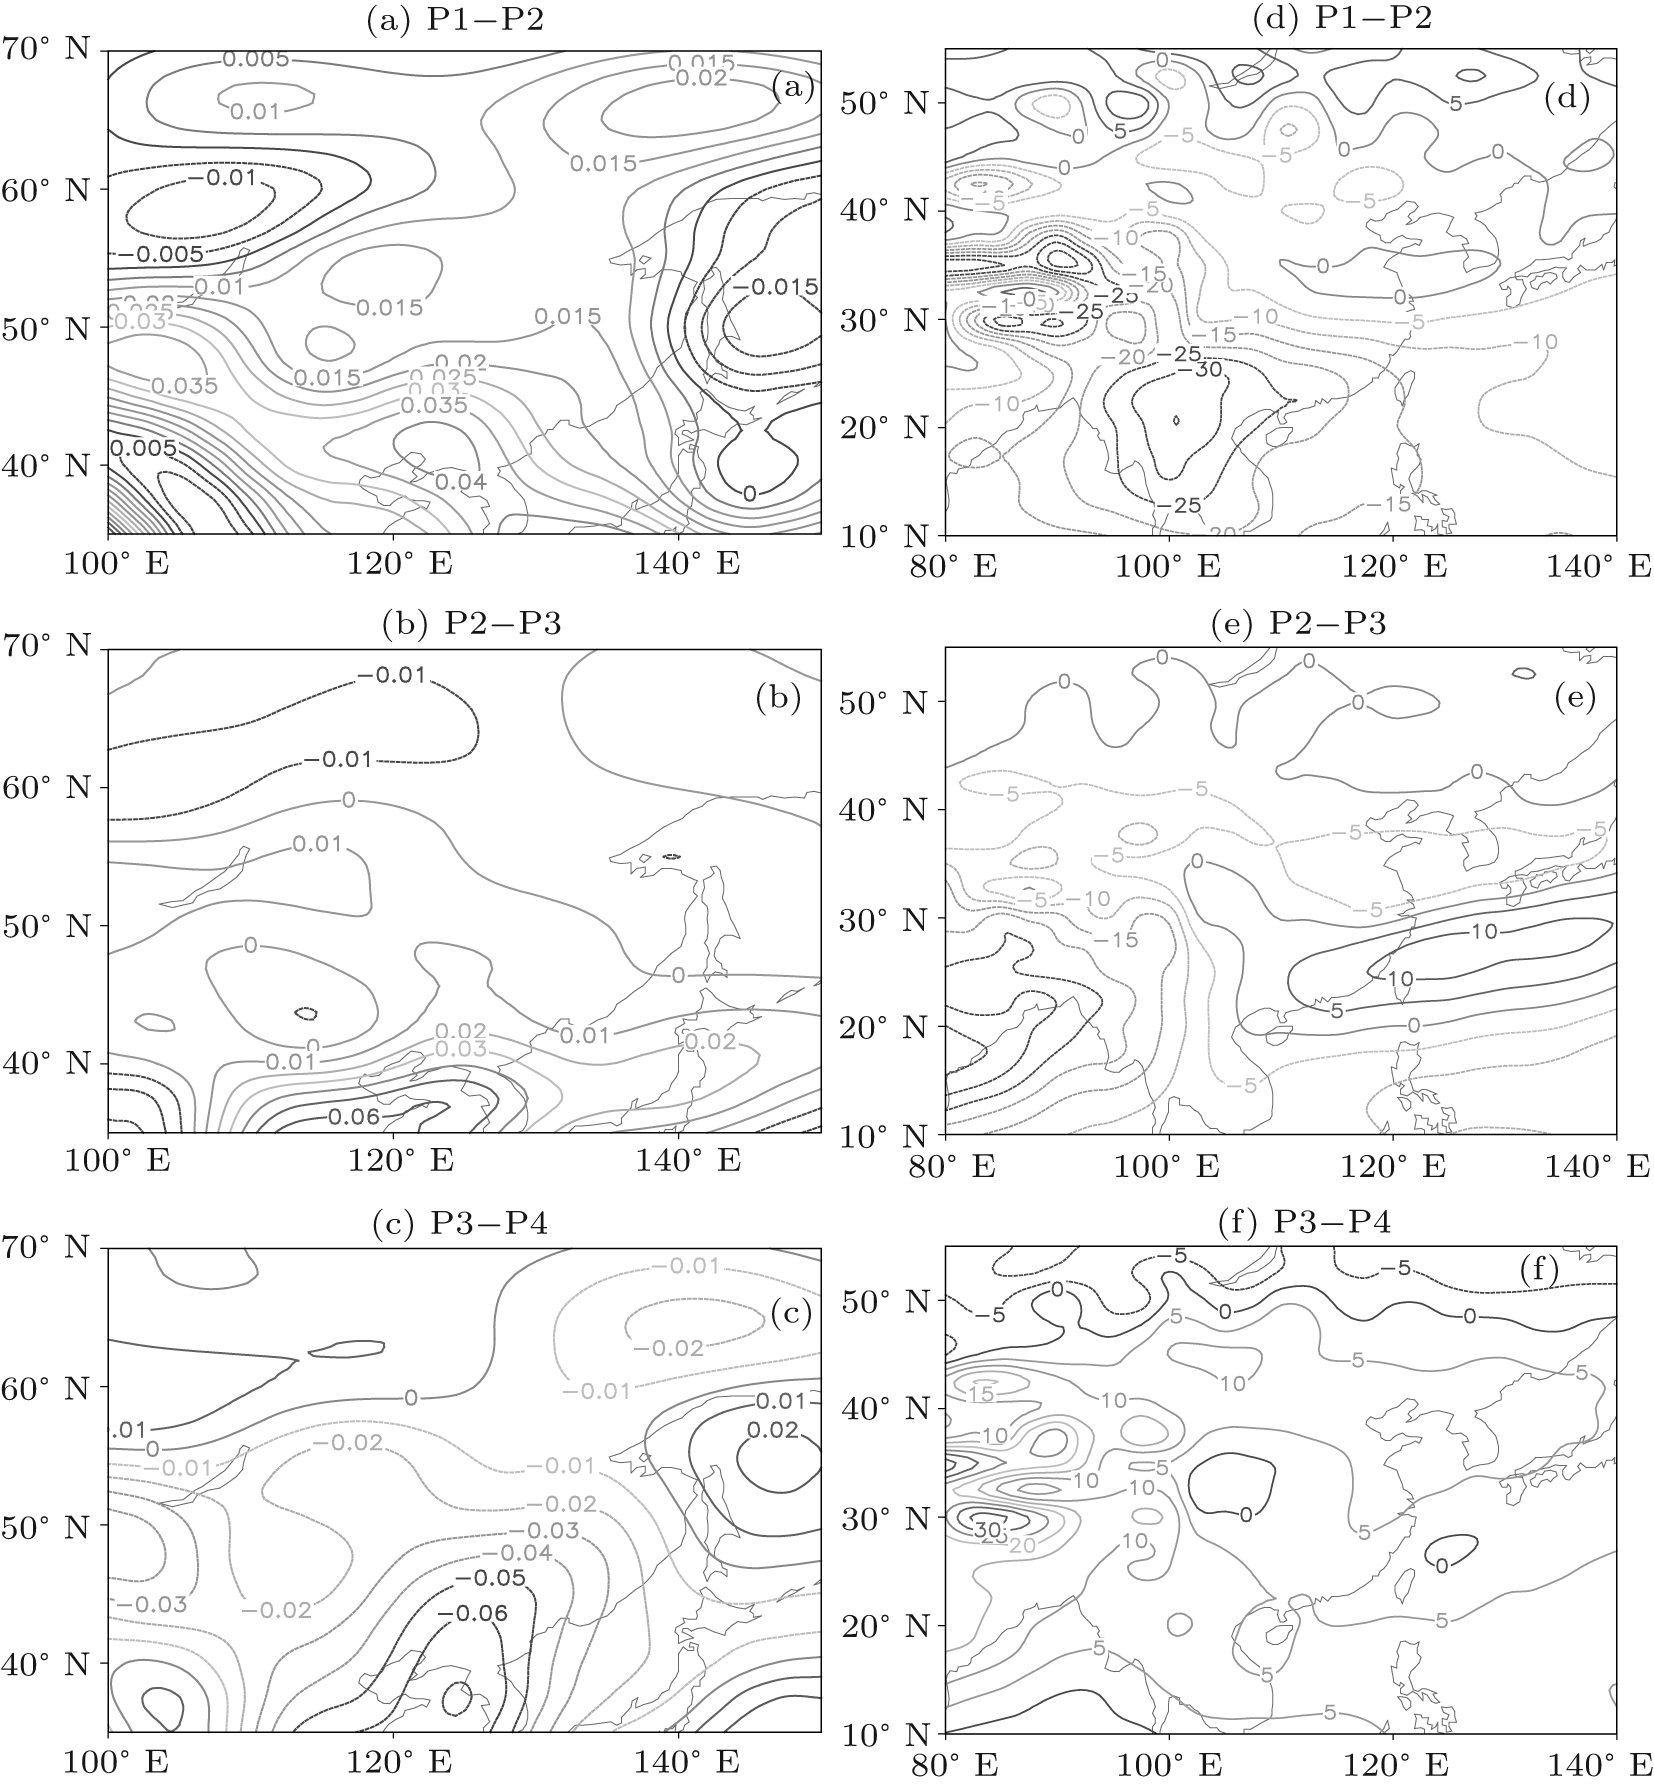 | Fig. 8. Differences in 500-hPa omega ((a)-(c)) (in units of Pascal/s) and relative humidity ((d)– (f)) field (in %) between P2 and P1, between P3 and P2, between P4 and P3. |
The Northeast China CV rainy period clearly shows that the precipitation will be affected by the northeast cold vortex activities. In this section, the daily Northeast China CV frequency is calculated for analyzing the corresponding relationship between CV activity and precipitation. Figure 9 shows the standardized time series of daily Northeast China CV frequency from April 1 to September 30. In early May, the CV frequency is first greater than 0, then it fluctuates around 1, and reaches a peak in early June. In the end of June, the CV frequency begins to decrease and reaches 0 in early July. In the mid-July– August-end, the CV frequency falls sharply, exactly corresponding to the mid-summer precipitation in Northeast China mainly affected by the East Asia summer monsoon.[14] This curve reflects not only the changing characteristics of the CV frequency, but also the fact that the CV and summer wind affect the precipitation in Northeast China alternatively, and proves the rationality of the previous definitions of the beginning and ending dates of the CV rainy period.
 | Fig. 9. Standardized time series of daily Northeast China CV frequency. |
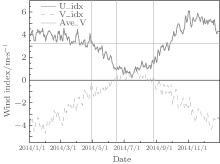
As the zonal wind has a close relationship with the CV in Northeast China, and the meridional mainly reflects the activity of the East Asia monsoon, [36, 37] the daily indices of 850-hPa zonal and meridional wind of Northern Asia are shown in Fig. 10. It is obvious that the meridional index rapidly decreases from late April and becomes less than the yearly mean of the meridional index in early May, which is good for the activity of the CV in Northeast China. The frequent action in Northeast China may be attributed to more precipitations in this region. That is to say, that the beginning date of the CV rainy period is defined on May 3 is consistent with the changed characteristics of the meridional wind in Northern Asia. Then the zonal wind rapidly crosses the zero point in late June, which means that the frontier of the EASM begins to influence the North China and Southern Northeast China. The strengthening of the northward wind may bring more water vapors and increase the precipitation in Northeast China, then the rainy period in Northeast China starts a new period, that is, the MS rainy period defined in this paper. Therefore, the beginning date of the MS rainy period defined on June 26 is totally creditable. Meanwhile, the zonal wind crosses the zero point once again in late August. The dominated northward meridional wind changing into a southward one means that the influence of EASM on Northeast China begins to weaken. Then less water vapor can be brought to Northeast China, causing the precipitation in this region to decrease rapidly, which is corresponding to the end of the MS rainy period. Therefore, the definition of the ending date of the MS rainy period on August 29 is also creditable.
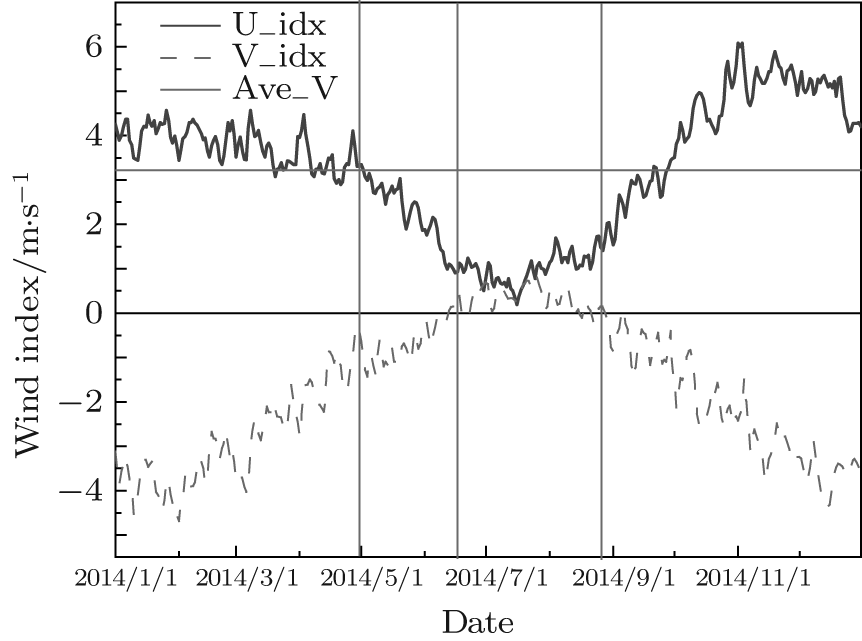 | Fig. 10. Daily 850-hPa wind field indices in the Northeast China area. |
In this paper, the differences between the Northeast China CV and MS rainy periods and their corresponding atmospheric circulation changing characteristics are comprehensively analyzed. Particularly, the objective identification methods of defining the beginning and ending dates of CV and MS rainy periods are developed. The main conclusions are drawn as follows.
(i) The objective identification methods of defining the annual beginning and ending dates of CV and MS rainy periods are developed. The annual beginning dates of the Northeast China CV rainy period are from April 1 (June 1), when ryi > R (2R) on a certain day of a certain year and rs > 〈 r〉 (2〈 r〉 ) in more than 50% of northeast stations, then the date will be taken as the undetermined date for the beginning date of the CV (MS) rainy period. If ryi > R (2R) is satisfied in the consecutive 2 (7) days, then the undetermined date will be identified as the beginning date of the CV (MS) rainy period. The day before the beginning date of the MS rainy period is defined as the ending date of the CV rainy period. Meanwhile, in a period from August 1 to September 30, when ryi < 2R on a certain day of a certain year and ryi < 2〈 r〉 in more than 50% of northeast stations, then the date will be taken as the undetermined date for the ending date of the MS rainy period. If ryi < 2R is satisfied in the consecutive 6 days, then the undetermined date will be identified as the ending date of the MS rainy period. Therefore, based on the analysis of the daily precipitation climate mean condition in the northeast region from 1981 to 2010, the beginning date of multi-year Northeast China CV (MS) rainy periods is May 3 (June 27), and the ending date is June 26 (August 29).
(ii) The northward advance and westward extension of WPSH in different periods (P1 to P4) are attributed to the circulation anomalies before, in, or after CV and MS rainy periods. Corresponding to the WPSH characteristics, the southerly component of the 850-hPa wind field in Northeast China during the rainy period is significantly stronger than during the non-rainy period. The upward movement in omega field during the rainy period is also stronger than in the non-rainy period. It is also stronger in the MS rainy period than in the CV rainy period. The relative humidity is also stronger in the rainy period than in the non-rainy period, and it is stronger in the MS rainy period than in the CV rainy period. Therefore, the circulation analysis proves that the Northeast China CV and MS rainy periods defined in this paper are creditable.
(iii) The evolution of the daily frequency of the Northeast China CV better corresponds to the definitions of the beginning and ending dates of the Northeast China CV rainy period. The inner-annual changes in daily meridional and zonal wind index better correspond to the beginning dates of CV and MS rainy periods in the northeast region. Therefore, the objective identifications of the beginning and ending dates of Northeast China CV and MS rainy periods have a certain circulation basis in this paper, and their definitions are of great climate significance.
As is well known, the main precipitation season in Northeast China can be divided into two parts, one is in a period from May to June, mainly caused by the frequent activities of the CV, and the other is in a period from July to August, mainly caused by the activities of the EASM. However, the key point of the paper is that we proposed an easy and objective way of defining the beginning and ending dates of these two rainy periods only based on the quantity of daily precipitation. There might be some deficiency in this method, and it will be improved in our future research.
| 1 |
|
| 2 |
|
| 3 |
|
| 4 |
|
| 5 |
|
| 6 |
|
| 7 |
|
| 8 |
|
| 9 |
|
| 10 |
|
| 11 |
|
| 12 |
|
| 13 |
|
| 14 |
|
| 15 |
|
| 16 |
|
| 17 |
|
| 18 |
|
| 19 |
|
| 20 |
|
| 21 |
|
| 22 |
|
| 23 |
|
| 24 |
|
| 25 |
|
| 26 |
|
| 27 |
|
| 28 |
|
| 29 |
|
| 30 |
|
| 31 |
|
| 32 |
|
| 33 |
|
| 34 |
|
| 35 |
|
| 36 |
|
| 37 |
|