Warm–dry collocation of recent drought in southwestern China tied to moisture transport and climate warming*
[Dai Xin-Ganga) , Liu Yeb)†  , Wang Ping
c) ]
, Wang Ping|
|


†Corresponding author. E-mail: liuye890523@163.com
*Project supported by the National Basic Research and Development Program of China (Grant No. 2013CB430201), the National Natural Science Foundation of China (Grant Nos. 41075058 and 41475075), and the China Meteorological Administration Special Public Welfare Research Fund (Grant No. GYHY201106016).
This study aims to investigate the recent drought in southwestern China and its association with environmental changes in moisture transport (MT) and atmospheric circulation. Climatic Research Unit grid data, in situ observations in China, and ERA-interim reanalysis are used to study the characteristics of the drought and the associated mechanism. Recent precipitation trends show a pattern of “Northern wetting and Southern drying”, similar to the anti-phase of the climate pattern prevailing during 1980–2000 in mainland China; southwestern China incurred a severe drought during 2009–2013. Wavelet analysis reveals that the drought coincides with a warm–dry phase of temperature and precipitation on a period of about 20 years and beyond 100 years, where contributions account for 43% and 57% of the deficiency of the precipitation, averaged for 2003–2012, respectively. A further investigation reveals that the drought results chiefly from the decline of the southwestern monsoon MT toward southwestern China, in addition to mid-latitude circulation changes, which leads to more blockings near the Ural Mountains and the Sea of Okhotsk in the rainy season and negative anomalies around Lake Baikal and northeast China in the dry season. These anomalies are likely to be correlated with global sea surface temperature changes and need to be studied further.
Global warming was a major tune of 20th century climate change.[1– 3] However, an unusual hiatus has occurred in global mean temperature evolution since approximately 2000, implying that climate warming has slowed down during the past decade.[4] A more recent investigation confirmed that the hiatus, which features frequent cold events in Eurasia, was forced by cooling in the middle and eastern tropical Pacific relating to the phase transition of the Interdecadal Pacific Oscillation (IPO) that occurred around the same time, [5] in addition to the well-known ‘ sea ice meltdown and snow feedback mechanism’ .[6] Such a La Niñ a-like sea surface temperature (SST) anomaly widely affected global atmospheric circulation and the monsoon system, [7] leading to a series of regional climate changes in the past decade, such as frequent extreme cold events in Eurasia, [8, 9] a 2003-heat wave in western Europe, [10, 11] and an extreme heat wave in China in 2013.[12] In addition, an increasing number of extreme floods and droughts have occurred in Asia, including recent torrential monsoon rainfall events that affected an arid area of Pakistan and resulted in substantial damage caused by the floods.[13, 14] However, southwestern China has experienced a severe drought during the past decade[15– 17] in which water shortages nearly destroyed local crops.[18] The drought is likely to be connected with the La Niñ a-like pattern of SST anomalies. However, numerical simulations by Kosaka and Xie failed to reproduce the pattern of the recent precipitation changes in southwestern China, particularly the severe drought in Yunnan province, [19] although the hiatus and other regional climate changes were well reproduced. Many investigations have focused on the relationships between the El Niñ o– Southern Oscillation (ENSO) cycle and the weather fluctuation in southwestern China.[19] For example, a study revealed that local precipitation increases significantly in the developing phase of La Niñ a events and decreases in its decaying stage; [20] another study showed a weak correlation between precipitation in Yunnan and the Niñ o 3 SST anomalies.[21] These studies implied that the recent drought in Yunnan could not be attributed completely to the large-scale SST anomalies of the eastern equatorial Pacific. Other potential factors for the recent southwestern drought have been raised in a number of studies, such as anomalous water vapor transport, [22, 23] heat source anomalies in the Tibetan Plateau, anomalous El Niñ o events and the Indian Ocean Dipole (IOD), [24, 25] a weak summer monsoon, the Arctic Oscillation/North Atlantic Oscillation (AO/NAO), and anomalous general atmospheric circulation.[22, 26– 28] Nevertheless, most recent investigations on the drought were case studies that did not involve the decadal scale or beyond, which is probably due to the limited length of the meteorological observations or the reanalysis data. It appears that the recent drought is likely to be a decadal climate event under the background of global warming. Therefore, this paper will focus on the time scales beyond inter-annual variation in association with monsoon moisture transport (MT) changes and the anomalies of atmospheric general circulation. We first introduce the data and methods to be used in Section 2, and then demonstrate the spatial patterns of recent precipitation changes over mainland China in Section 3. In Section 4 the wavelet decomposition results on precipitation, temperature, and water– vapor pressure are presented to reveal the special collocations between them. The associated anomalies in MT and atmospheric circulation are described in Sections 5 and 6 respectively. In Section 7 a summary of the key findings of the present study and some recommendations for future work are provided.
Three sorts of datasets are used in this study: monthly Chinese precipitation observations recorded at 160 standard stations from the China Meteorology Administration (CMA); high-resolution gridded precipitation, temperature, and surface water– vapor pressure from the CRUTS 3.21 dataset with a resolution 0.5° latitude × 0.5° longitude[29] developed by the Climate Research Unit (CRU), at the University of East Anglia (UEA); and the 2.5° × 2.5° Dai– Palmer Drought Severity Index (PDSI), [30] which is used to identify the locations of an actual drought in addition to those of precipitation decrease. The index data are downloaded from the website of the National Oceanic and Atmospheric Administration/Oceanic and Atmospheric Research (NOAA/OAR) Earth System Research Laboratory (ESRL) Physical Sciences Division (PSD), Boulder, Colorado, USA (see
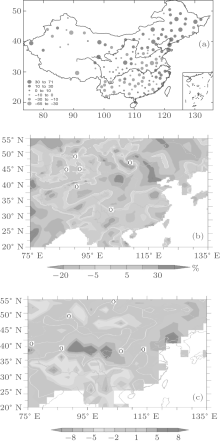
The annual precipitation pattern over mainland China appears to be gradually transforming from the pattern of “ Southern wetting and Northern drying” , which prevailed from the mid-1970s to 2000, into a “ Southern drying and Northern wetting” pattern[33, 34] with a recent slowdown of global warming. The recent drought in southwestern China occurred under this background. An important task is to identify the spatial pattern of recent precipitation changes before investigating the mechanism of the drought. The “ Northern wetting and Southern drying” can be shown quantitatively by the linear trend of the annual precipitation for 2000– 2012. The trends from CRU annual precipitation data and CMA observations both show a decadal decrease in precipitation in southern China and a decadal increase in the north (Figs. 1(a) and 1(b)). Two drying centers are located near Yunnan province and the Huaihe River basin near the eastern coast between the downstreams of the Yellow River and the Changjiang River. However, the trends in the pattern of the PDSI (Fig. 1(c)) are slightly different from those in the precipitation, in which only one drought center is left in southwestern China, which coincides approximately with the center of the precipitation decrease in Figs. 1(a) and 1(b). This is because drought involves more factors in addition to precipitation, such as surface dryness and air temperature. That is, the drought can be driven by both thermal and hydrological processes, in which insufficient precipitation was essential.
 | Fig. 1. The 2000– 2012 trends of the annual precipitation anomaly percentages with respect to their climate means for 1980– 1999: (a) in situ observations; (b) gridded precipitation from CRUTS3.12; (c) trends of annual Dai– Palmer Drought Severity Index (PDSI) for 2000– 2010. |
Recent precipitation changes in China differ for the rainy and dry seasons. As is well known, the precipitation in southwestern China is concentrated mainly in the rainy season (May– October), other than the period of November– April, which is called the dry season. Figure 2(a) shows that the recent decadal-trend pattern for the precipitation in the rainy season is very similar to that of the annual precipitation (Fig. 1(b)). This implies that the southwestern drought results from regional climate changes in the rainy season[17] because, according to climate statistics, most of the precipitation in southwestern China is concentrated in the rainy season (Figs. 2(b) and 2(d)). However, the extremely dry center in the rainy season shifts eastward into the central area of southern mainland China during the dry season, and the entire Changjiang River basin becomes a dry environment (Fig. 2(c)). Moreover, the drying near Yunnan becomes lighter than in the rainy season. Nevertheless, the excess precipitation remains over the southeastern coast facing the Taiwan Strait. This result indicates that recent precipitation decreases in southern China appeared in both the rainy and the dry seasons despite their regional differences.[35] The recent drying along the Changjiang River basin, particularly in its upstream area, has resulted in a decline in runoff, especially in the dry season, [36] which may lead to further water scarcity in the middle and downstream basins of the river during winter and spring seasons in the near future if the drying pattern continues.
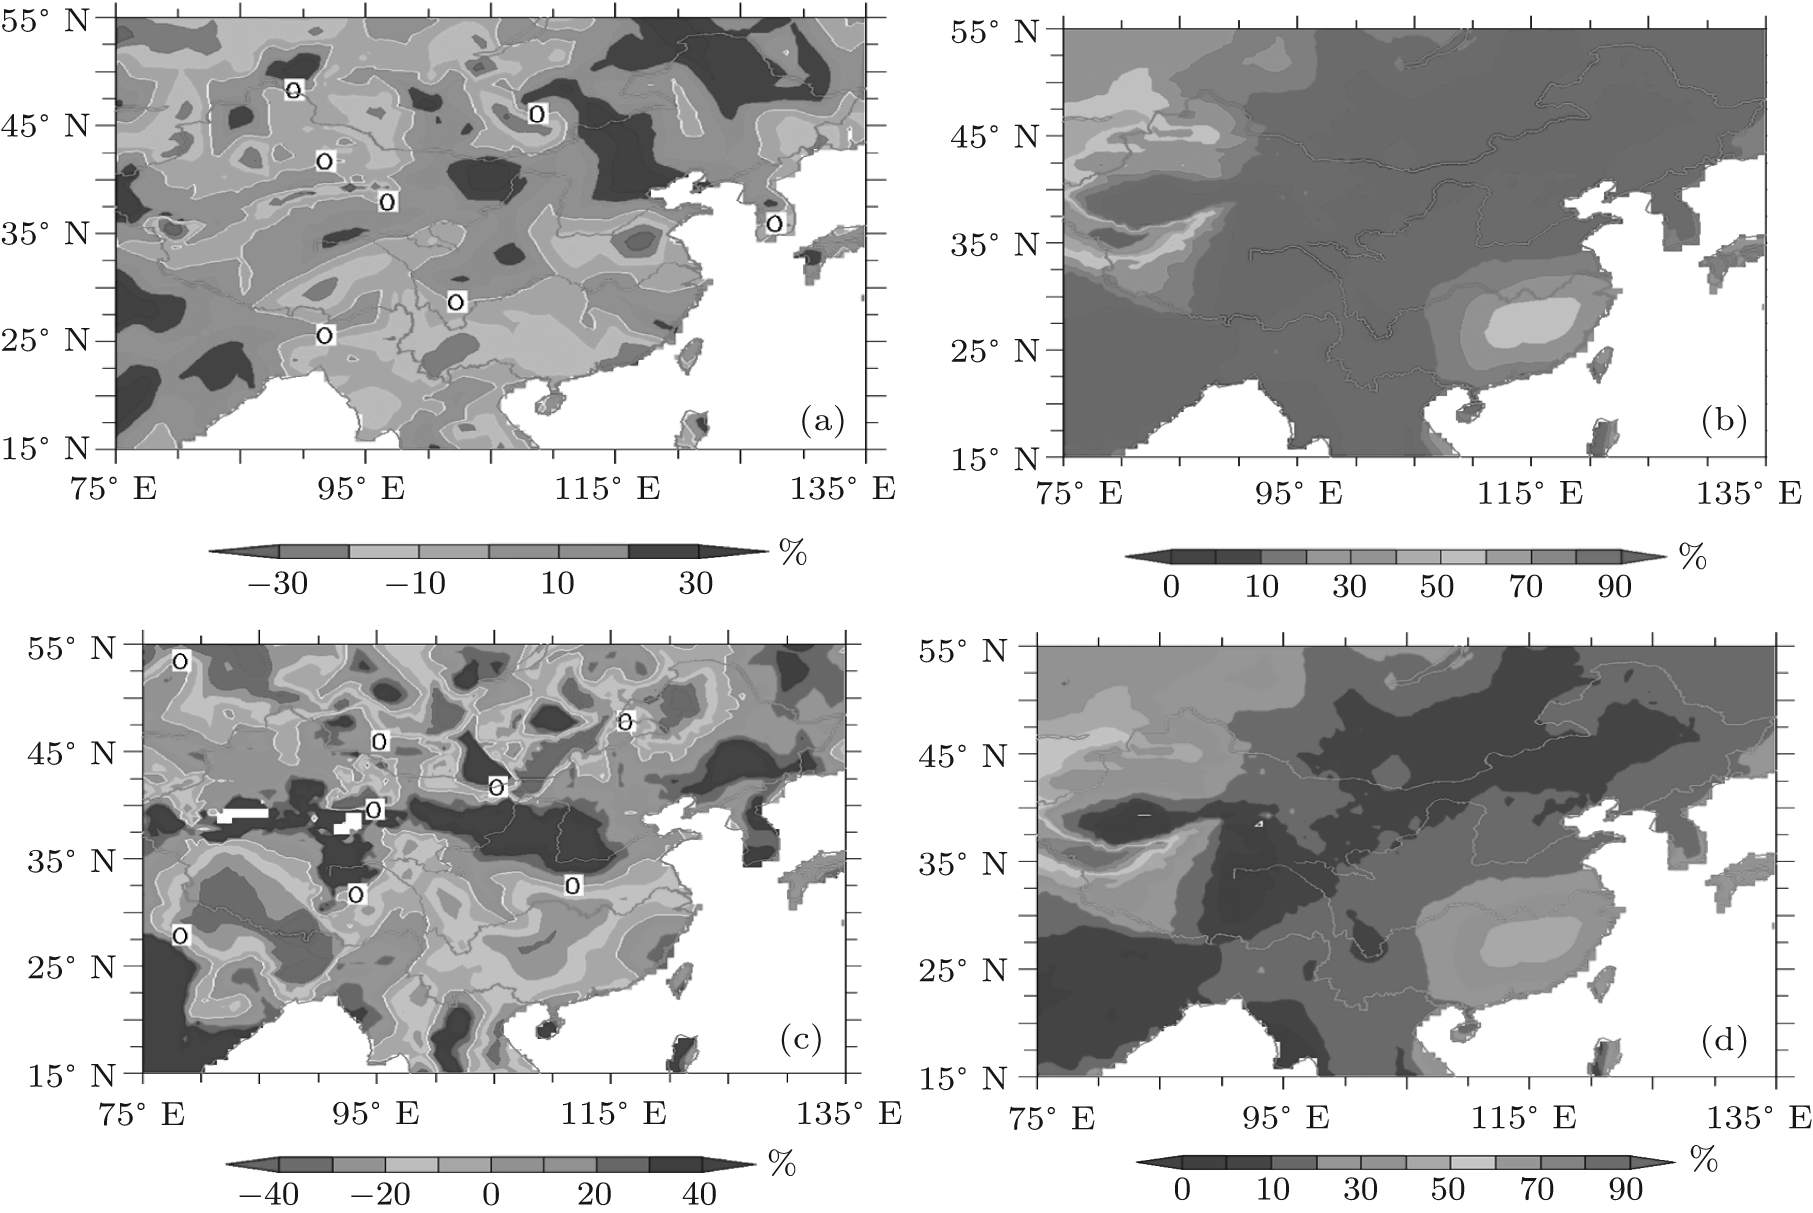 | Fig. 2. The 2000– 2012 trends of the precipitation anomaly percentages (left panel) and seasonal precipitation percentages (right panel) with respect to the 1980– 1999 climate mean: (a) and (b) rainy season (May– October); (c) and (d) dry season (November– April). |
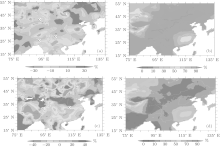
The multi-scale characteristics of a climate sequence can be effectively illustrated by wavelet decomposition, by which the key scale components of the precipitation in southwestern China can be identified. Generally, there are one or two scales of the components that play key roles for a dry or wet event. The annual sequences of region-averaged precipitation, air temperature, and surface water– vapor pressure (CRUTS3.21) over the domain (22° N– 24° N, 100° E– 105° E), a drying center, are decomposed into a series of components at wavelet scales of 2 a (the unit a is the abbreviation for year), 4 a, 8 a, 16 a, 32 a, 64 a, and beyond 64 a by use of the orthogonal basis of Daub4.[32] The components of 2 a and 4 a belong to inter-annual scales; while the 8 a, 16 a, 32 a, and 64 a are attributed to decadal-multidecadal (D-MD) scales, which correspond approximately to the periods of about 10 a, 20 a, 40 a, 70 a, respectively. The component beyond 64 a (> 100 a) is regarded as a nonlinear trend for a 160-year sequence of the climate variable. Noticing that the recent southwestern drought appears to be a climate event beyond the decadal scale, the following analysis will focus on the multi-decadal scale and the nonlinear trends. The decompositions show that there are different collocations among the components of the three variables on corresponding scales (Fig. 3). For instance, the components at scales of 32 a and 64 a show “ warm– wet/cool– dry” collocation (Figs. 3(c) and 3(d), and the components at scales of 16 a and beyond 100 a show a “ warm– dry/cool– wet” collocation (Figs. 3(b) and 3(e)). The large dashed circles in Figs. 3(b) and 3(e) show recent collocations that correspond to the southwestern drought. Therefore, the drought should be attributed to the warm– dry phases of the components at scales of 16 a and beyond 100 a. The contributions of the two precipitation-components to the drought account respectively for 43% and 57% for the period of 2003– 2012. Hence, the recent drought in southwestern China resulted mainly from the recent negative phase of the 16-a component of the precipitation and the positive phase of the air temperature on the same scale under the background of century-scale warm– dry tendency. In addition, the temperature components on the scales of 32 a and 64 a were also in their positive phases in the past decade, which strengthened the climate warming over the drought region of southwestern China.
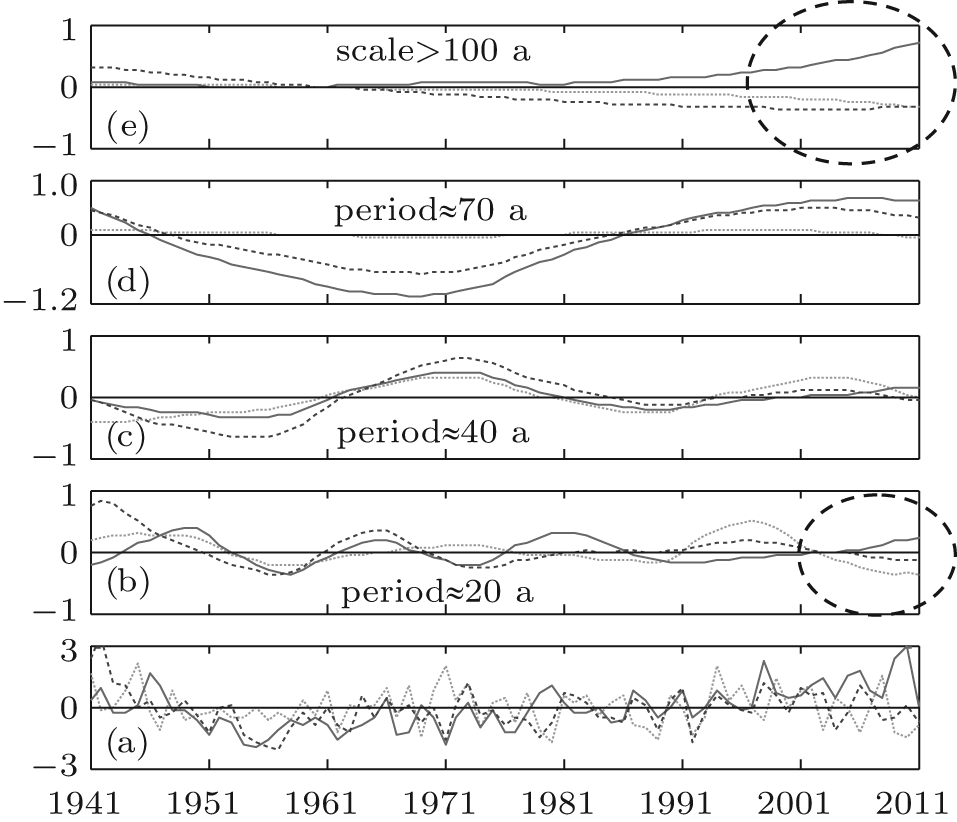 | Fig. 3. Wavelet decomposition of 1941– 2012 precipitation (green line), air temperature (red line), and water– vapor pressure (blue line) averaged over the area (22° N– 24° N, 100° E– 105° E) in southwestern China: (a) standard sequences; ((b), (c), (d), and (e)) wavelet components at scales of 16 a, 32 a, and 64 a and beyond corresponding to quasi-periods of 20 a, 40 a, and 70 a and beyond, respectively; dashed black circles denote the recent warm– dry collocations. |
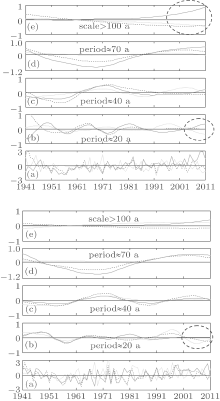
There are different collocations among the components of the climate variables in different seasons. The upper panel of Fig. 4 shows that the rainy season case is similar to the annual one (Fig. 3), i.e., the drought in the rainy season also corresponds to the warm– dry collocations of the components at 16 a and beyond 100 a, which are depicted by thick-black dashed circles in Fig. 4. On the other hand, the dry season precipitation has also been insufficient during the past decade, although the warm– dry mode still existed in the 16-a component of the dry season variables (bottom panel in Fig. 4). However, the collocation of the components at scales beyond 100 a became a warm– wet mode, which is favorable for precipitation and partly counteracted the warm– dry effect of the 16-a component in the past decade. These results explain why the southwestern drought in the dry season was lighter than that in the rainy season. Hence, the recent drought in southwestern China was essentially due to the appearance of the warm– dry collocation on a scale of 16 a and beyond 100 a in the rainy season.
 | Fig. 4. Wavelet decomposition of 1941-2012 precipitation (green line), air temperature (red line), and surface water– vapor pressure (blue line) averaged over the domain (22° N– 24° N, 100° E– 105° E) in southwestern China for the rainy season (upper panel) and the dry season (bottom panel): (a) standard sequences; the others are the same as those in Fig. 3. |
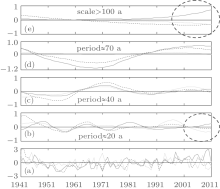
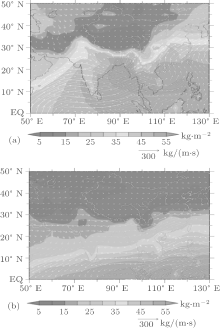
The climate-mean precipitations in southern and southwestern China are actually tied to a specific MT pattern over South and Southeast Asia. Figure 5(a) shows that the column water– vapor of southwestern China usually comes from the great southwest monsoon MT belt over the northern Indian Ocean during the rainy season, implying that the major water– vapor source is the Bay of Bengal with a maximum column water– vapor content and the Indian Ocean; while the water– vapor sources of southern and southeastern China come directly from the South China Sea with a northward moisture flow, which is the joint of two moisture flows from the northern Indian Ocean and the western Pacific. Thus, the southwest monsoon fluctuations could be directly exerted on the rainfall in southwestern China during the rainy season, while the rainfalls in southern and southeastern China could be influenced by either the southwest monsoon or the southeast moisture flow. The latter could often be influenced by frequent tropical disturbances or typhoons coming from the western Pacific in the rainy season. As for the dry season, figure 5(b) shows that the climate-mean MT toward the southwestern and southern China mainland comes from the southwest moisture flow along the southern skirt of the Tibetan Plateau, which is one of the branches of the mid-latitude westerly around the Plateau
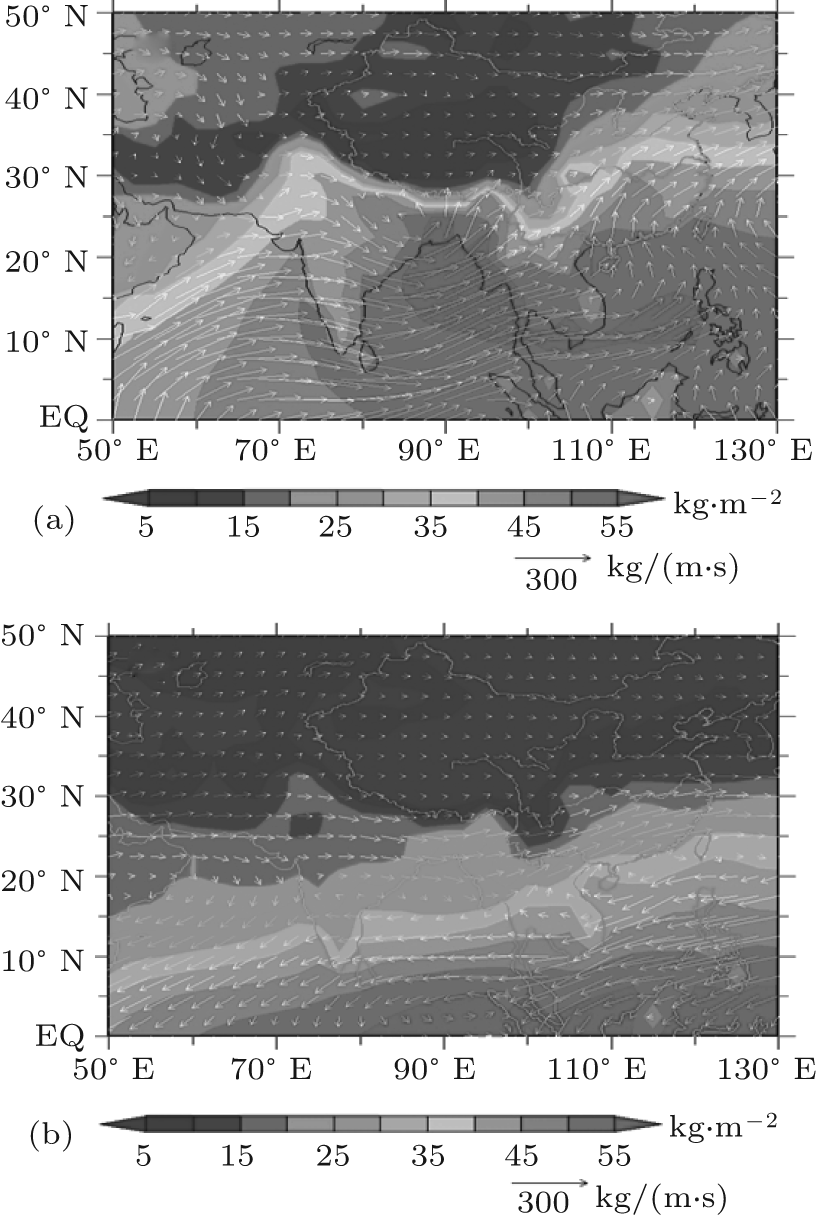 | Fig. 5. The 1979– 2008 climate-mean column water– vapor content (kg· m− 2) and the vertically integrated moisture transport (kg· m− 1· s− 1); (a) rainy season (May– October); (b) dry season (November– April). |
in the dry season. Hence, the dry season precipitation in southern and southwestern China could be significantly influenced by the anomaly of the mid-latitude westerly over the Eurasian continent. Thus, the MT changes could be greatly exerted on the precipitation of southwestern China, leading to either drought or flood in the regions.
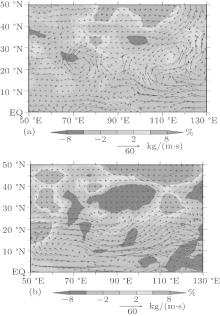
The anomaly of precipitation in southwestern China is usually coupled with an abnormal MT pattern. The general pattern can be identified by a composite analysis. The composite pattern is the difference between two fields which are the averages of two groups of extreme precipitation events and can be regarded as a reference pattern that corresponds to excess or rare precipitation of a region in the climate study. The following analysis concentrates on Yunnan’ s change in precipitation and the associated MT anomaly. There are seven standard observatories in Yunnan province among the 160 CMA stations, which are Kunming, Mengzi, Lijiang, Lincang, Dali, Baoshan, and Jinghong. The sequence of Yunnan precipitation was established by the sum of the precipitations observed at six stations, except for Jinghong whose precipitation evolution was inconsistent with the others. For example, no significant decrease in precipitation was observed at the station during the past decade. The Yunnan precipitation sequence spans over the time period 1951– 2013. We select six maximum and six minimum precipitation samples from the rainy season sequence to establish two groups of precipitation samples. The samples of the first group are taken in 1986, 1995, 1999, 2001, 2002, and 2007 for the maximum, and the second group in 1988, 1992, 2003, 2009, 2011, and 2012 for the minimum. At first, we make an average of the MT field over the two groups of years, and then calculate the difference between them as the composite pattern of the MT anomaly. The positive phase of the pattern corresponds to the typical MT field that connects the excess precipitation in Yunnan province, whereas its negative phase represents the typical MT pattern that corresponds to rare precipitation or drought in the province. Figure 6(a) shows that two anomalous moisture flows meet over Yunnan, southwestern China, for the positive phase of the pattern; one originates from the southwest monsoon with sufficient humid air, and the other is a northeast dry flow coming from the mid-latitudes of mainland China. This finding implies that the convergence of the two flows could create much more rainfall in the region during the rainy season, as is well known, and vice versa. Moreover, it indicates that the local rainfall would decline if the balance between the two flows is broken. For example, local precipitation would decrease even in very strong monsoon years if there is no suitable collocation with the northeast flow, or it would also decrease if the monsoon declines with a much stronger northeast flow than normal over the region.
The composite analysis shows that the excess precipitation during the dry season only corresponds to stronger southwest MT toward Yunnan province, and vice versa (Fig. 6(b)). It reveals that the dry season precipitation of Yunnan can be influenced mainly by fluctuation of the southwest MT in connection with the northern hemispheric westerly along the southern skirt of the Tibetan Plateau. This theory implies that there are potential physical factors in the middle or even high latitudes that can also indirectly influence the precipitation of southwestern China during the dry season.
 | Fig. 6. Differences between two group-averages of precipitable water (PW) and vertically integrated moisture transport (MT), each group includes six samples corresponding to six maximum and six minimum precipitations, respectively in the period 1951– 2013. The areas surrounded by white lines represent the statistical significance of the PW differences above 0.10. (a) Rainy season; (b) dry season. Units: kg· m− 1· s− 1 for the MT and percentage (%) for the difference percentage of the PW with respect to its climate mean. |
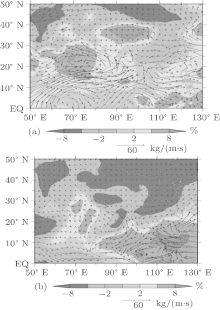
The recent drought in Yunnan should be involved in changes of summer monsoon MT in the past decade. Considering the fact that the severe droughts occurred merely after 2008, we calculate the departures of the rainy season MT fields averaged over 2009– 2013 from the climate mean for 1979– 2008. If the regional characteristics of the climate departures around Yunnan are similar to those of its counterpart in the composite field (Fig. 5(a)) in positive or negative phase, the departures can be regarded as a factor that leads to a decrease or an increase in the precipitation. Figure 7(a) shows that the rainy season MT and the precipitable water (PW) has apparently changed during the past half-decade, of which the PW departures over Asia are similar to those of the composites in negative phase (Fig. 6(a)), i.e., the PW decreases over southwest China, which is consistent with the wavelet analysis of the surface water– vapor pressure (Fig. 4(a)), which is accompanied by a weakening monsoon MT toward Yunnan province. These changes may directly lead to the recent drought in southwestern China, according to the well-known physical mechanism of precipitation formation.
Besides, the drought in southwestern China appears to be correlated with the Pakistan floods[10, 13] that have also occurred in the past half-decade because of changes with the South Asia monsoon. There is a large clockwise center in the anomalous MT field that has a high PW area over the South China Sea (Fig. 7(a)), which can be compared to a similar center over southern mainland China in the composite pattern (Fig. 6(a)). This change reduces the PW above the southern and southwestern China and leads to the anomalous westward or northwestward MT over the southern and especially the southeastern coast of China, which results in excess rainfall in the southeastern area of China. Meanwhile, a clockwise center in the MT anomalies has a high PW area and appears over the northwestern part of the South Asian subcontinent (Fig. 7(a)) against the anti-clockwise center that has a low PW shown in Fig. 6(a). These changes altered the monsoon MT field over South Asia and Southeast Asia, especially over the South China Sea, leading to an increase in the water– vapor concentration over the dry northwestern area of the Indian subcontinent; meanwhile, they reduce the monsoon MT toward southwestern China in the past half-decade. This finding reveals the linkage between the recent southwestern China drought and the recent Pakistan floods.
The departures of the dry season MT and PW have also been unfavorable for the precipitation in Yunnan during the past half-decade. Figure 7(b) shows that the pattern of the PW departures is approximately similar to the anti-phase of the composite pattern (Fig. 6(b)), in which the PW decreases in eastern and southwestern China and the northern part of the Bay of Bengal, while it increases in the northwestern Pacific and most of South Asia. Meanwhile, the MT over southwestern China becomes weak, and more water vapors concentrate over the ocean further south to the mainland due to the anomalous MT turning to the south over the Indochina Peninsula. Such changes around southwestern China are actually due to the appearing of an anti-cyclone of the anomalous MT over the northern part of the Bay of Bengal and an anomalous MT cyclone over the southern coast of China. The anti-cyclone causes the southwestern moisture flow to turn southward before entering the southwestern border of China, and the cyclone adds an additional northeast dry flow over the region, which leads to PW decreases in the southwestern and southern China mainland. These changes imply that the recent insufficient precipitation of the dry season in southwestern China could be, to a great extent, attributed to the weakening of the southwest MT toward the region with air water– vapor content dropping in the past half-decade.
 | Fig. 7. Departures of the 2009– 2013 precipitable water (PW) and vertically integrated moisture transport (MT) from their 1979– 2008 climate means. The areas surrounded by solid or dash– white lines represent the PW departures above the significance level 0.05. (a) Rainy season; (b) dry season. Units: kg· m− 1· s− 1 for MT and departure percentage (%) for PW. |
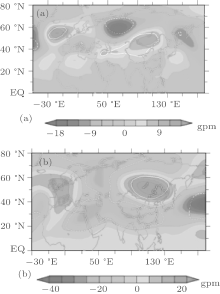
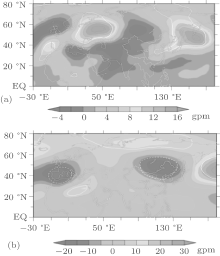
The precipitation in southwestern China is correlated with not only the monsoon MT fluctuation, but also the changes of mid-latitude circulation of the northern hemisphere. Similar manipulations for composite analysis are used to identify the characteristic pattern of the anomalous circulation that corresponds to excess or rare precipitations in Yunnan province. The 500-mb geopotential height field is taken to approximately represent the circulation of the mid-layer of the atmosphere in this study. The composite pattern of the height field shows that the excess rainfall in Yunnan is usually associated with significantly lower heights near the Ural Mountains and over the Sea of Okhotsk, and the heights are significantly higher than normal over Mongolia, northwestern China, and Central Asia (Fig. 8(a)), and vice versa. These characteristics imply that it is favorable for the excess rainfall during the rainy season in southwestern China if rare blockings appear over the area around the Ural Mountains, and vice versa. Meanwhile, the excess precipitation during the dry season corresponds to the significantly higher heights over Central Siberia around Lake Baikal and Western Europe, which are accompanied by significantly lower heights over Eastern Europe, central Asia, the Middle East, the northern part of South Asia, and southwestern China (Fig. 8(b)). These characteristics imply that it would be favorable for the precipitation during Yunnan’ s dry season if rare blockings appear in the Ural Mountains and more appear over Central Siberia around Lake Baikal, and vice versa. Noticing that the composite pattern of the circulation should also be regarded as a reference state, it is almost impossible for any actual circulation field or averaged field to be similar to the entire composite pattern; instead, one could try to find a regional similarity between them so as to make an assessment on where the change of the circulation field is favorable or unfavorable for the precipitation in the concerned area.
 | Fig. 8. Differences between the two 500 hPa height fields averaged over the years corresponding to the six maximum and minimum precipitations of Yunnan, respectively. The areas surrounded by white lines represent the differences that are statistically significant above the 90% confidence level. (a) Rainy season (May– October); (b) dry season (November– April). Units: gpm is the geopotential meter. |
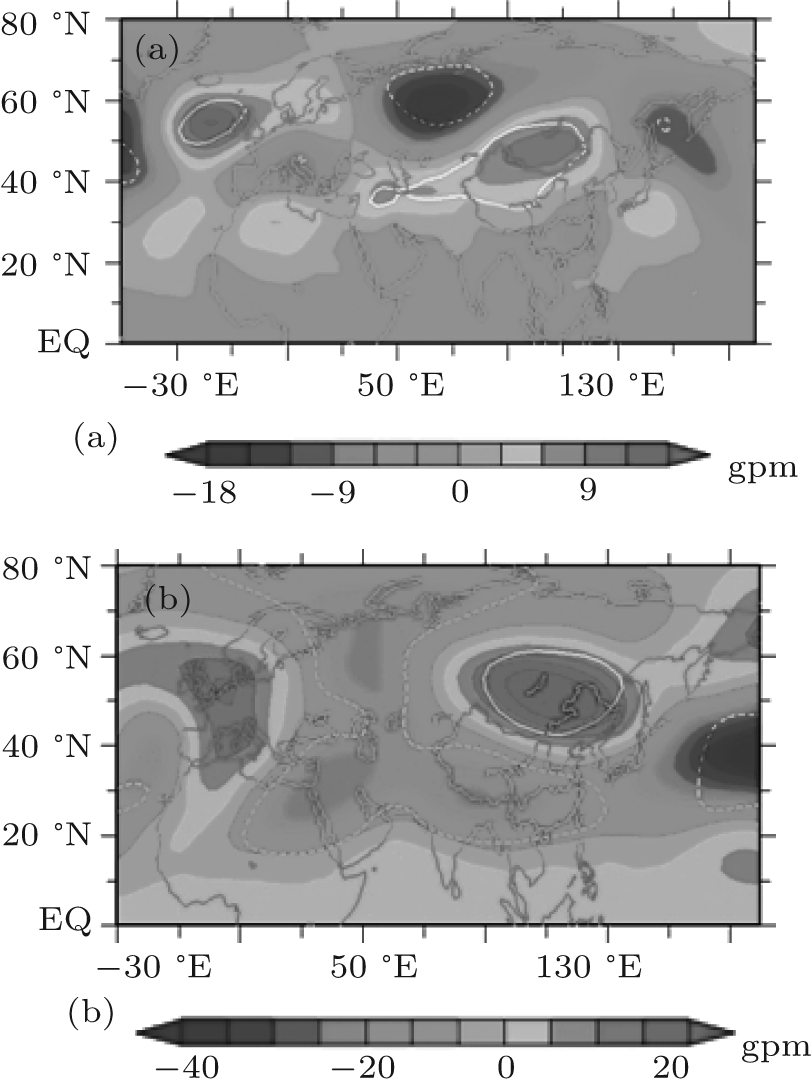
The recent severe drought in southwestern China also seemed to be correlated to the mid-latitude atmospheric circulation changes, in addition to the monsoon fluctuation. The linkage between the drought and the circulation changes can be illustrated by comparing the composite field (Fig. 8) with the departures of the 500-mb geopotential height field averaged over 2009– 2013 from its climate mean for 1979– 2008 (Fig. 9). Figure 9(a) shows that the pattern of the large-scale departures of the heights in the mid-latitudes is of a somewhat regional similarity to the composite one of negative phase (Fig. 8(a)), i.e., the regional heights over eastern Europe and the Sea of Okhotsk are significantly higher than the climate mean, and the regional heights are below the climate mean over West Siberia, Central Asia, and the North Atlantic. These anomalies imply that the drought is seemingly associated with stronger Okhotsk Sea high and eastern European High in the field of 500 mb. In other words, the appearance of more blockings in the two areas has a negative influence on rainfall in southwestern China during the rainy season, and vice versa. In fact, such a pattern of circulation anomalies can increase eddy activities along a western route toward western China, which usually creates more rainfall in northern and eastern China[32] rather than in southwestern China according to the weather forecasting history. Besides, the lower heights over the Middle East and the Arabian Sea seem favorable for introducing the monsoon moisture flow that turns to the northwestern part of South Asia and creates excess rainfall in the dry region, on the one hand; while on the other hand, it reduces the monsoon MT toward southwestern China. This may be one of the mechanisms for the occurrences of the drought in southwestern China and the floods in Pakistan in the past half-decade. Nevertheless, the departure of the dry season height
 | Fig. 9. Departures of the 500-mb height field averaged over 2009– 2013 from the 1979– 2008 means. The areas surrounded by white lines represent the departures that are statistically significant above the 90% confidence level. (a) Rainy season (May– October); (b) dry season (November– April). Units: gpm. |
field is dissimilar to the composite field over the Eastern Hemisphere (Fig. 8(b)), except for the area around Lake Baikal and northeastern China (Fig. 9(b)). The heights over that area are significantly lower than normal, implying that less blockings or frequent eddy activity in the area can have a negative influence on the precipitation in southwestern China during the dry season.
Besides, the northern hemispheric circulation of the last half decade exhibits a pattern similar to an Arctic Oscillation– like pattern in negative phase, [36] i.e., a stronger meridian circulation pattern that corresponds to a weak westerly in the mid-latitude. This is why the southern branch of the westerly along the southern edge of the Plateau becomes weak in the dry season, leading to a weak MT toward southwest China in the past half-decade.
The main findings of this study can be summarized as follows. (i) Mainland China has experienced a climate of “ Northern wetting and Southern drying” in the past decade, and Yunnan province has suffered a severe drought in the recent half decade. (ii) There are two types of thermal collocations, which we name “ warm– dry/cold– wet” and “ warm– wet/cold– dry.” The former appears on a scale of 16 a and beyond 100 a, while the latter is on a scale of 32 a and 64 a in the wavelet decomposition. (iii) The recent drought in southwestern China is associated with the “ warm– dry” phases of the climate components on a scale of 16 a and beyond 100 a, which implies that the drought can be attributed to not only the internal variation of the local climate, but also the climate warming as an external factor. The collocation beyond 100 a plays a more important role than that on a scale of 16 a in the recent drought, whose contributions are 57% and 43% respectively for the deficiency of 2003– 2012 precipitation of southwestern China. (iv) The recent decrease of precipitation in southwestern China in the dry season results mainly from the negative phase of the precipitation evolution on a scale of 16 a or a period of about 20 a, while the climate warming is favorable for local precipitation of the dry season. (v) The recent severe drought in Yunnan could be attributed mainly to a weakening of the summer monsoon MT toward southwestern China and also attributed to the decrease in air moisture content because of changes in the South Asia monsoon system. (vi) The drought is also associated with mid-latitude atmospheric circulation changes, especially the significant increases of the rainy season 500-mb height over Eastern Europe and the Sea of Okhotsk during the past half-decade. The recent decrease of dry season precipitation also results from a decline of the southwest MT toward southwestern China, which is due to the negative phase of the Arctic Oscillation-like circulation pattern that appears over the Eurasian continent.
Several issues are still open and remain to be studied in the near future. For instance, the mechanisms revealed in this investigation only reflect the recent changes in the monsoon and the atmospheric circulation and their potential relationships with the drought. These changes may be forced by SST anomalies in other areas of the global ocean in addition to the eastern equatorial Pacific. Subsequent work should focus on how recent SST anomalies affected the South Asia monsoon, which is the key factor that caused the climate drying in southwestern China and the frequent floods in Pakistan during the past decade. Furthermore, the physical process involved in the oscillation of the southwestern climate on a scale of 16 a should be investigated with CMIP5 (Coupled Model Intercomparison Project Phase 5) output datasets[38] for understanding the mechanism of the important climate oscillation in a period of about 20 years, as well as for estimating future climate changes in the region.
The authors are grateful to Prof. Bi Xun-Qiang, Dr. Zhao Tian-Bao, and Dr. Xiong Zhe for their help with data preparation for this study.
| 1 |
|
| 2 |
|
| 3 |
|
| 4 |
|
| 5 |
|
| 6 |
|
| 7 |
|
| 8 |
|
| 9 |
|
| 10 |
|
| 11 |
|
| 12 |
|
| 13 |
|
| 14 |
|
| 15 |
|
| 16 |
|
| 17 |
|
| 18 |
|
| 19 |
|
| 20 |
|
| 21 |
|
| 22 |
|
| 23 |
|
| 24 |
|
| 25 |
|
| 26 |
|
| 27 |
|
| 28 |
|
| 29 |
|
| 30 |
|
| 31 |
|
| 32 |
|
| 33 |
|
| 34 |
|
| 35 |
|
| 36 |
|
| 37 |
|
| 38 |
|