


A two-stage spectrum sensing scheme based on energy detection and a novel multitaper method*
[Qi Pei-Han, Li Zan† , Si Jiang-Bo, Xiong Tian-Yi‡]
, Si Jiang-Bo, Xiong Tian-Yi‡]
|
|


†Corresponding author. E-mail: zanli@xidian.edu.cn
‡Corresponding author. E-mail: tyxiong@stu.xidian.edu.cn
*Project supported by the National Natural Science Foundation of China (Grant No. 61301179), the China Postdoctoral Science Foundation (Grant No. 2014M550479), and the Doctorial Programs Foundation of the Ministry of Education, China (Grant No. 20110203110011).
Wideband spectrum sensing has drawn much attention in recent years since it provides more opportunities to the secondary users. However, wideband spectrum sensing requires a long time and a complex mechanism at the sensing terminal. A two-stage wideband spectrum sensing scheme is considered to proceed spectrum sensing with low time consumption and high performance to tackle this predicament. In this scheme, a novel multitaper spectrum sensing (MSS) method is proposed to mitigate the poor performance of energy detection (ED) in the low signal-to-noise ratio (SNR) region. The closed-form expression of the decision threshold is derived based on the Neyman–Pearson criterion and the probability of detection in the Rayleigh fading channel is analyzed. An optimization problem is formulated to maximize the probability of detection of the proposed two-stage scheme and the average sensing time of the two-stage scheme is analyzed. Numerical results validate the efficiency of MSS and show that the two-stage spectrum sensing scheme enjoys higher performance in the low SNR region and lower time cost in the high SNR region than the single-stage scheme.
The limited frequency spectrum resource has increasingly become scarce with the rapid growth of wireless services and devices. Investigations by the Federal Communications Commission[1, 2] point out that even under such a situation, the spectrum utilization is extraordinarily low. The static spectrum allocation policy, which is the main cause of this embarrassment, assigns a spectrum to the primary user (PU) in advance and prohibits other users from accessing the licensed band despite this band not being occupied. Cognitive radio[3– 6] (CR) provides a promising solution to alleviate the awkward situation above as it allows unauthorized users, i.e., the secondary user (SU) to make use of the licensed band as long as the SU will not cause any interference to the PU. Such a dynamical and adaptive spectrum assignment mechanism will certainly bring much higher spectral efficiency and throughput in the cognitive network. Therefore, the fundamental task for the SU in CR is to be aware of the external electromagnetic environment and sense the vacant band reliably, [7– 9] i.e., detect the existence of PU in common sense.
A mass of literature can be explored in the field of cognitive radio, which proposes a variety of some well-known spectrum sensing techniques, including energy detection (ED), [10] eigenvalue-based detection, [11] and cyclostationary detection.[12] Among them, ED is known for its simple realization and low complexity, which makes it attractive in some real-time sensing circumstances. However, the relatively poor performance of ED in the low SNR region eclipses its advantage to some extent. Liang’ s eigenvalue-based detection method is a robust detection method but it strongly relies on the statistical property of the received signals. Under the case where the primary signal appears as white, this method will fail.[13] In practice, the computational complexity is relatively high when conducting eigenvalue decomposition. For cyclostationary detection, it can detect PU at a very low SNR by digging the spectral redundancy implicit in signals. However, it requires a prior knowledge of the primary signals like the symbol rate and cyclic frequency, which cannot be achieved in most common scenarios. Moreover, the high computational and implementation complexity make cyclostationary detection not very practical.
Considering the shortages of those methods listed above and inspired by Thomson’ s multitaper power spectral density (PSD) estimation algorithm, [14] researchers have studied the spectrum sensing techniques based on multitaper PSD estimation. According to Ref. [14], the performance of the multitaper PSD estimator gets close to that of the maximum-likelihood estimator. Haykin also declared in Refs. [15] and [16] that the multitaper estimator is near-optimal in the maximum-likelihood sense and is suitable in wideband spectrum sensing for its accurate estimation and low realization complexity. In Ref. [17], spectrum sensing based on the multitaper method was applied to the TV band, but the author obtained the decision threshold by experiment rather than theory analysis. The authors of Ref. [18] came up with an optimal detector of the multitaper spectrum estimator but did not provide the closed-form expression of the decision threshold. For the first time in Ref. [19], closed-form analytic formulas were derived for the probabilities of spectrum-hole detection and false alarm under addictive white noise assumption. In this work, a novel multitaper spectrum sensing (MSS) method under the Rayleigh fading channel is proposed. We construct the test statistics, derive the closed-form decision threshold, give an objective probability of false alarm (Pfa), and this nonparametric multitaper PSD estimator endows the MSS blind feature in spectrum sensing. The theory analysis shows its low implementation complexity in practical application, while the numerical simulation is carried out to verify its sensing effectiveness.
Meanwhile, wideband spectrum sensing has drawn much attention since it aims to find more opportunities in a much wider range of spectrum and brings about a higher throughput for CR networks. The most commonly used wideband sensing technique is based on the sweep-tune machanism, [20] in which the wideband spectrum of interest is divided into subbands and the received signal is sampled constrained by the traditional Nyquist sampling theory. However, wideband spectrum sensing will result in an increase of time consumption and equipment complexity. Motivated by this, we consider a simple two-stage wideband spectrum sensing scheme that conducts coarse but fast spectrum sensing in the first stage and relatively slow but fine spectrum sensing in the second stage. Some work on two-stage spectrum sensing has already been done. The authors of Ref. [21] established a two-stage spectrum sensing model in a system view, but both stages employed the ED method. In Refs. [22] and [23], ED and cyclostationary detection are adopted for the first and second stages respectively, which is not appropriate in blind spectrum sensing. ED and eigenvalue-based detection are utilized in Ref. [24], the performance of which relies on the coherence of signals, as per the earlier discusssion. Based on the merits and demerits of the spectrum sensing methods listed above, ED is chosen for the first stage and the proposed MSS method is employed in the second stage, which dramatically reduces the average sensing time in the high SNR region while maintaining higher performance in the low SNR region compared with the single-stage scheme.
The rest of this paper is organized as follows. The system model of the two-stage spectrum sensing scheme is presented in Section 2. In Section 3, we briefly review the ED method and propose the MSS method. The performance analysis is carried out in Section 4. Section 5 displays the numerical simulation results. Finally, Section 6 concludes the whole work.
In the context of CR, wideband spectrum sensing requires the SU to capture a wide range of frequency spectrum (e.g., several hundreds of mega hertz or even giga hertz) and access licensed but idle frequency band. The SU should also be able to react quick enough to switch to another available band so as not to cause any interference when the PU comes back.
In the sweep-tune wideband spectrum sensing machanism, assume the contiguous wideband spectrum of interest has a bandwidth of Bs and is divided into M subbands with a bandwidth of Bc (i.e., Bs = MBc). In the practical case, a tunable band-pass tracking filter at the front end can be employed to screen out the specific subband of interest. Considering the Rayleigh fading channel, the subband signal received at the SU is modeled as follows:

where x (t) is the received waveform at SU. We assume s (t) is a determinate but unknown signal transmitted by the PU, w (t) is the circular symmetric complex Gaussian white noise with zero mean and variance 


where x = [x (0), x (1), … , x (N − 1)]T is the received sequence, w = [w (0), w (1), … , w (N − 1)]T is the noise sample, s = [s (0), s (1), … , s (N − 1)]T is the PU signal and h = [h (0), h (1), … , h (N − 1)]T is the channel coefficient vector. In Eq. (2), symbol ° denotes the Hadamard product operation.
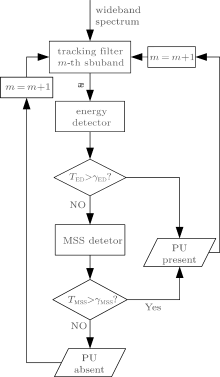
After modeling the system, we directly give the flow path of the two-stage spectrum sensing scheme proposed in this work in Fig. 1.
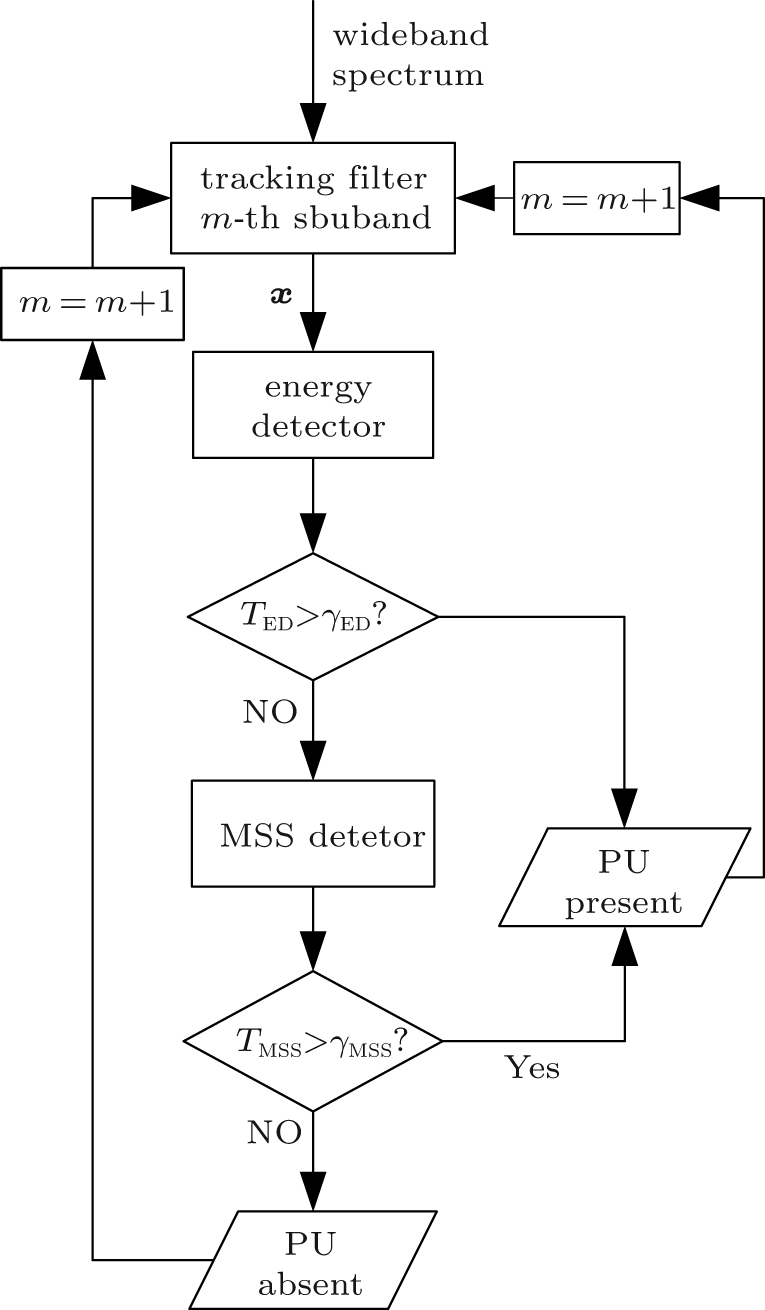 | Fig. 1. Flow diagram of two-stage spectrum sensing scheme. |
In the two-stage mechanism considered in this paper, let the received wideband spectrum first feed to a tunable band-pass filter followed by an energy detector. Whether the MSS algorithm will be carried out depends on the judgment of the energy detector, and then the same process is applied to the next subband. Intuitively, such a two-stage spectrum sensing method will achieve better performance. In the next section, we will review the energy detection and propose the MSS method respectively.
In this section, we first briefly review the energy detection including the decision threshold and probability of detection (Pd). Afterwards, the MSS algorithm will be discussed in detail and then we derive the statistical property of its test statistic in both hypotheses obtaining the closed-form expression of the decision threshold. At the end of this section, we analyze the Pd of the MSS algorithm in the Rayleigh fading channel.
Urkowitz first put forward energy detection in Ref. [10] according to which the test statistic is

On condition that the number of samples N is large enough, the central-limit theorem is applied to TED obtaining that 

where 
In H1 hypotheses, the average probability of the detection of energy in the Rayleigh fading channel is given by[25]

where 

In this subsection, we will discuss the proposed multitaper spectrum sensing (MSS) algorithm in detail. Before that, the famous resolution– variance dilemma[15] in the power spectral density (PSD) estimation problem should be briefly addressed. It is widely considered that the bias of estimation can be reduced by tapering the time series but the loss of information increases estimation variance. Confronting that, Thomson proposed a mutitaper PSD estimation method to address the issue of bias and variance simultaneously in an “ optimal” way for the first time. In Ref. [19], the authors pointed out that the mutitaper spectrum differs from the periodogram in philosophy and in Ref. [26] the mutitaper PSD estimator is demonstrated to outperform the conventional weighted overlapped segment averaging (WOSA) estimator from the perspective of leakage, variance, and resolution. The authors of Ref. [ 27] gave a brief review of multitaper spectral estimation, and show how to utilize the multitaper method in practice.
Motivated by this, a novel multitaper spectrum sensing (MSS) algorithm based on the result of the mutitaper PSD estimator is proposed. The flow chart of MSS is shown in Fig. 2.
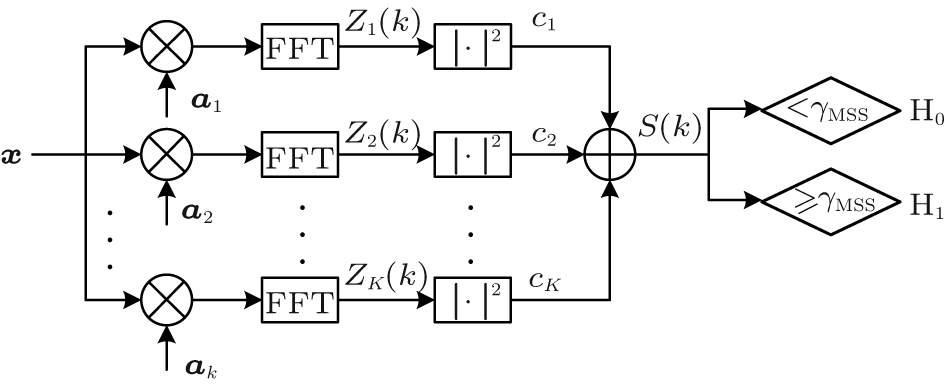 | Fig. 2. Flow chart of the MSS algorithm. |
The multitaper PSD estimator employs a set of discrete prolate spheroidal sequences (also called Slepian sequences) denoted as ai = [ai (0), ai (1), … , ai(N − 1)]T, i = 1, 2, … , K. These sequences are orthogonal with each other in the sense that

Actually, the author in Ref. [28] pointed out that the Slepian sequences are the eigenvectors of an N-by-N sinc-matrix M, with the (m, n)-th entry defined by M(m, n) = sin [2π B(n − m)]/[π (n − m)], where B is the half of the expected resolution width in multitaper PSD estimation. Hence, ai are given by

where η i is the corresponding eigenvalue of ai and the Slepian sequences in Fig. 2 are the first K eigenvectors in Eq. (7).
The time series windowed by the i-th Slepian sequences is expressed as

where symbol ○ denotes the vector Hadamard product.
For convenience, we define
 |
 |
 |
Hence, the Fourier transform matrix is

where each row vector of ZK × N is the Fourier transform of each tapered data sequence.
According to Refs. [15] and [16], the weight coefficient ci in Fig. 2 is defined as

where η i is the eigenvalue associated with the i-th Slepian sequence.
Gather ci to a diagonal matrix in a compact form as follows:

Sequentially, the k-th spectrum line of the multitaper PSD estimation can be written as

where zk is the k-th column vector of the Fourier transform matrix ZK× N in Eq. (10) and the symbol † denotes the complex-conjugate transposition operation. Up to now, we have got the test statistic for the MSS algorithm. Next, we will analyze the stochastic property of S(k) in Eq. (13) in order to use the Neyman– Pearson criteria for a given probability of false alarm.
To begin with, a lemma is first provided here for later derivation.
Lemma 1 The sum of K independent and exponential distributed random variables with the same parameter λ obeys the Gamma distribution denoted as Γ (α , β ), where α = K is the shape parameter and β = 1/λ is the scale parameter.[29]
Under the H0 case, the received signal is

As the addictive noise 

where the subscript i indicates the index of the set of Slepian sequences.
Refer to the definition of discrete Fourier transform and obtain
where w(n) = wR(n) + jwI(n). To get the statistical distribution of Zi(k), we will calculate the first and second order moments of 

The expectation and variance of 

 |
 |
 |
 |
Then the covariance of 

which means 


Regarding the DFT results of the i-th and l-th (i, l = 1, 2, … , K and i ≠ l) windowed data, the same k-th spectrum lines are respectively Zi(k) and Zl(k) the covariance of which can be proved to be zero, that is

which implies Zi(k) and Zl(k) are independent.
Accordingly, as the continuous function of Zi(k) and Zl(k), | Zi(k)| 2, and | Zl(k)| 2 are also independent of each other. Equation (13) implies that the test statistic S(k) is the sum of K weighted-independent exponential-distributed variables with weighted coefficient ci. Referring to the principle of the multitaper spectrum sensing method, the eigenvalue η i in Eq. (11) approximately equals one, which is verified in Refs. [15] and [16]. Hence, the weighted coefficient ci approximately equals 1/K. As a result, the test statistics in Eq. (13) degrades into

where Zi(k) is a circular symmetric complex Gaussian variable with zero mean and variance 


where Γ (x) is the Gamma function with the definition of 
Therefore, the cumulative distribution function (CDF) of S(k) can be deduced as

where γ (x, a) is the lower incomplete gamma function defined as

In Subsubsection 3.2.1, we have obtained the PDF and CDF of test statistic S(k) under H0 hypothesis. By applying the Neyman– Pearson criteria we have

where γ MSS is the decision threshold and 
According to Eq. (23), the decision threshold is calculated as

By replacing parameters α and β , the closed-form of the decision threshold is given by

As figure 2 shows, when making a judgement in MSS, we declare the presence of PU if only one spectrum line exceeds γ MSS. Then the Pfa of the whole subband can be expressed as

Given an objective Pfa PfMSS for each subband, the Pfa 
Under the case H1, the received time series at the SU is the sum of the fading primary signal and the addictive noise, i.e.,

If the Rayleigh fading coefficient h(n) is independent of w(n), and s(n) is a determined and unknown signal, then the received sample x(n) is also a complex Gaussian random variable. Similar to the case H0, the N points DFT operation results in N points of complex Gaussian variables given by

where letters i and k share the same sense with those in Eq. (15).
The real and imaginary parts of Zi (k) respectively are

where

The statistical expectation and variance of 

 |
 |
 |
 |
Define

The covariance of 

Consequently, Zi(k) is a circular symmetric complex Gaussian variable with zero mean and variance 

Similarly, for the i-th and l-th (i, l = 1, 2, … , K and i ≠ l) tapered time series, the covariance of the same k-th spectrum line of the DFT result is
Their correlation coefficient is derived as
where 

In the background of CR spectrum sensing, the signal to noise ratio (SNR) 

| Table 1. The correlation coefficient of the same spectrum line in different DFT output. |
On condition that ρ (Zi(k), Zl(k)) ≈ 0, Zi(k) and Zl(k) are approximately independent of each other. According to Eq. (13), the test statistics S(k) is the sum of K-independent exponential-distributed random variables each with mean 


By using the conclusion in Ref. [30], the PDF of the test statistics S(k) in hypothesis H1 is given by
where λ i, i = 1, 2, … , K is the parameter of the K independent exponential random variables.
Sequentially, the probability of detection of a single spectrum line can be expressed as

Considering that there are N samples in a frame of DFT result, the overall probability of detection within a subband is

Up to now, the probability of detection of the MSS method has been formulated, the sensing performance will be displayed via simulation in Section 5.
In the last section, we have got the decision threshold and probability of detection for both ED and MSS methods. For the two-stage scheme, the overall Pfa and Pd are given by


If we are given an overall objective Pfa μ , the Neyman– Pearson criterion requires one to find a group of appropriate (γ ED, γ MSS) to maximize the probability of detection Pd. This optimal problem can be formulated as

To simplify this math problem, we establish the connection between γ ED and γ MSS by utilizing Eqs. (40) and (41) such that

So, problem (42) is transformed into an unconstrained problem as

Then the optimal decision threshold (γ ED, γ MSS) can be obtained via techniques in optimization theory.
The time consumption in CR spectrum sensing is also an important performance indicator in that SU is required to react as fast as possible not to interfere with the PU. In this subsection, the average time of the two-stage scheme will be analyzed and the simulation result will be given in the next section.
The two-stage spectrum sensing scheme proposed in this work consists of the ED algorithm and the MSS algorithm. Under the system model in this work, a wide frequency spectrum crossing over BS is divided into M subbands. For each subband, the MSS method will be carried out if ED cannot detect a PU existence. The probability of carrying the second stage method can be expressed as

where P(H0) and P(H1) are the probability of PU absence and presence respectively. Consequently, the average sensing time of one subband is

where TED represents the time cost for a subband with ED and TMSS is the counterpart of MSS.
Then the total average sensing time for the BS wide band is given by

Subsituting Tavg into Eq. (47), we obtain
The first part in Eq. (48) is a constant and the total average sensing time of the two-stage scheme is related to the sensing performance of the first stage method (i.e., ED) and the PU absence probability.
In this section, we use the matlab R2013b software and Monte Carlo method, which runs on the Dell Optiplex 760 platform, to evaluate the performance of the proposed MSS algorithm and the two-stage scheme. First, we set our simulation parameters as follows. The wideband with bandwidth Bs = 1 GHz is divided into M = 50 subbands each with a bandwidth of 20 MHz. We choose BPSK signals as the PU signal. We should point out that the MSS can be applicable to not only BPSK signals but also other digital modulation signals. The system sampling frequency fs is set as 60 MHz, and the normalized variance of Rayleigh fading channel coefficient 
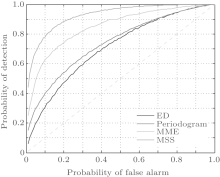
To begin with, we compare the receiver operator characteristic (ROC) curve of ED, maximum– minimum (MME), MSS, and the traditional Periodogram detection method in Fig. 3 with SNR = − 20 dB. The smooth factor of MME is chosen as 8.[11] According to the definition of the ROC curve, the Pfa is set from 0.01 to 1 and we ran 2 × 10⁴ Monte Carlo realizations for each Pfa. It can be seen from Fig. 3 that the MSS has a remarkably better sensing performance over ED, Periodogram, and MME for a given target Pfa since that MSS takes advantage of the Slepian windows, which are orthogonal with each other and the multitaper PSD estimation contains the most energy in the main lobe compared to the other traditional window functions.
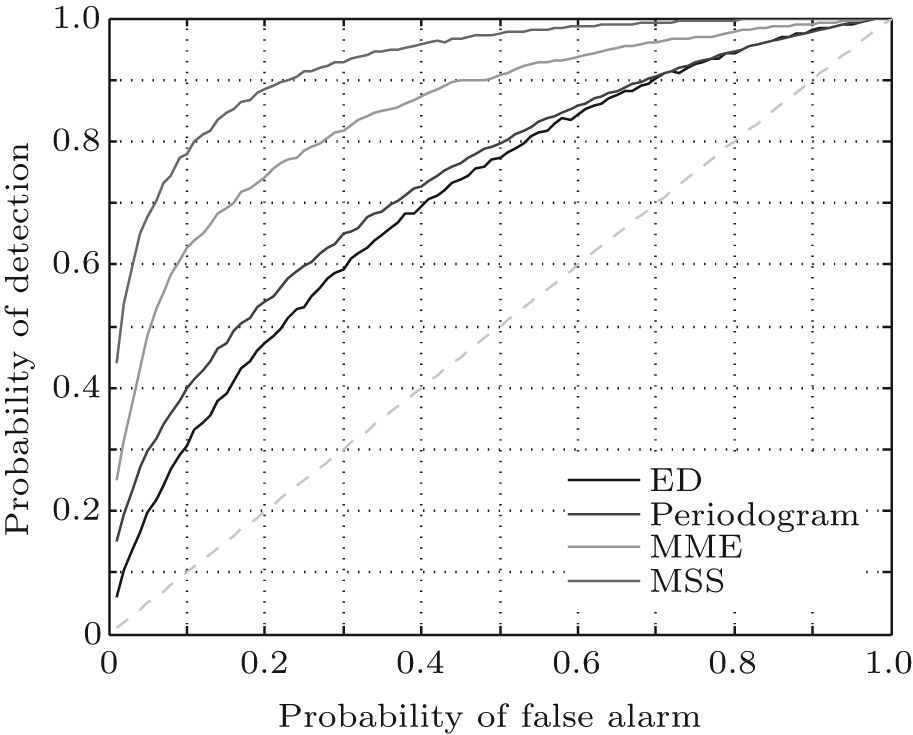 | Fig. 3. ROC curves of ED, Periodogram, MME, and MSS. |
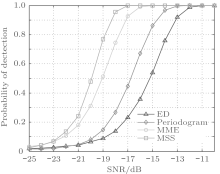
Figure 4 shows the probability of detection of ED, Periodogram, MME, and MSS in Rayleigh fading channel versus different SNR. It shares the same conclusion with Fig. 3 from another angle of view. Here the smooth factor of MME is also 8 and number of Slepian windows K in the multitaper estimator is chosen to be 5. The results of different K will be given later. We can see that MSS outperforms ED by about 6 dB, Periodogram by about 4 dB, and MME by about 2 dB respectively under the parameters set above.
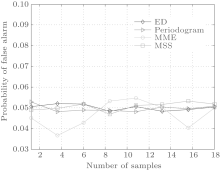
The probability of false alarm simulation results of ED, Periodogram, MME, and MSS are illustrated to verify the validity of the threshold given in Eq. (26). The thresholds of each method are computed for a target probability of false alarm Pf = 0.05 and ran 2 × 10⁴ Monte Carlo realizations, obtaining the data shown in Fig. 5. The numerical result indicates that the probability false alarm can be well controlled under the threshold from Eq. (26), which in reverse confirms the validity of our theory.
 | Fig. 4. Probability of detection of ED, Periodogram, MME, and MSS. |
 | Fig. 5. Probability of false alarm of ED, Periodogram, MME, and MSS. |
When estimating the PSD by Thomson’ s muiltitaper method, the number of the Slepian sequence has an impact on the features of the PSD estimation. Larger K will reduce the variance for a fixed length of Slepian sequence, which brings smoother PSD. Accordingly, it is beneficial to detecting the existence of the PU signal in lower SNR. The simulation result also supports this point, as shown in Fig. 6. As is displayed, the MSS with larger K gets better sensing performance; however, the larger K will inevitably increase the computation complexity so that MSS can provide a trade-off between sensing performance and realization efficiency for engineering application.
 | Fig. 6. Probability of detection of MSS with different K. |
At last, figure 7 and figure 8 depict the sensing performance and the average sensing time of the two-stage scheme respectively. Figure 7 implies that the two-stage scheme performs better than MSS and ED in the low SNR region and draw near to MSS in the higher SNR region. This is because ED mainly contributes in reducing the time cost rather than sensing performance when employed by the two-stage scheme. Hence, the sensing performance of the two-stage scheme is close to MSS. Considering that the actual sensing time is strongly determined by the hardware platform, without loss of generality, we assume it costs 1 time unit for ED to do a judgment in one subband and 4 time units for MSS. Figure 8 displays the whole wideband average time consumption of the two-stage scheme versus different SNR with different PU absence probability P(H0). As figure 8 shows, for a fixed P(H0), the average sensing time of the two-stage scheme is more than MSS in the very low SNR region as it will carry out both methods in a relatively high probability, and in the higher SNR region the first sensing stage can detect the PU easier, time cost therefore soon drops below the MSS sensing time line as the SNR rises and converges to a constant that is connected with P(H0). If the P(H0) is larger, which means the subband is vacant with higher probability, it is more likely to conduct the second stage method, resulting in an increase in time consumption. Combining Fig. 7 and Fig. 8, it is clear that the two-stage scheme can significantly reduce the average sensing time in the high SNR region compared to MSS while maintaining satisfying sensing performance in the low SNR region.
 | Fig. 7. Probability of detection of ED, MSS, and the two-stage scheme. |
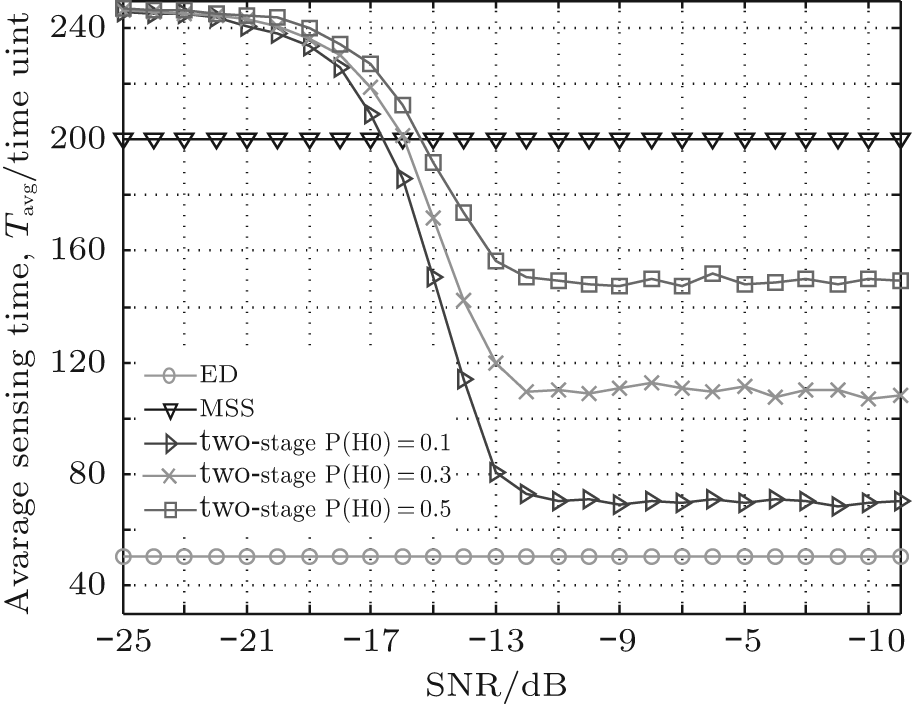 | Fig. 8. Average sensing time of ED, MSS, and the two-stage scheme. |
In this paper, we proposed a blind spectrum sensing technique named the multitaper spectrum sensing (MSS) method based on the multitaper power spectral density estimation. This method possesses the virtues of low computational complexity and highly reliable sensing performance. We derived the closed-form expression of the decision threshold for MSS. The probability of detection of MSS is also analyzed and formulated. In addition, we considered a two-stage spectrum sensing scheme employing ED and MSS and formulated a problem to find the optimal threshold of ED and MSS to maximize the overall probability of detection. We also provided the analysis of the average sensing time of the two-stage scheme. Simulation results verified the validity of the theoretical threshold of MSS and showed the improvement in sensing performance of MSS over ED for 6 dB, Periodogram for 4 dB, and MME for 2 dB. The sensing performance and the average sensing time of the two-stage scheme are presented, revealing that the two-stage scheme outperforms over MSS and ED in the low SNR region and dramatically reduces the average sensing time compared with MSS in the high SNR region.
| 1 |
|
| 2 |
|
| 3 |
|
| 4 |
|
| 5 |
|
| 6 |
|
| 7 |
|
| 8 |
|
| 9 |
|
| 10 |
|
| 11 |
|
| 12 |
|
| 13 |
|
| 14 |
|
| 15 |
|
| 16 |
|
| 17 |
|
| 18 |
|
| 19 |
|
| 20 |
|
| 21 |
|
| 22 |
|
| 23 |
|
| 24 |
|
| 25 |
|
| 26 |
|
| 27 |
|
| 28 |
|
| 29 |
|
| 30 |
|