


Electrical transport properties of YCo1 − xMn xO3 (0 ≤ x ≤ 0.2) prepared by sol–gel process*
[Liu Yia), b)†  , Li Hai-Jin
a), b) ]
, Li Hai-Jin|
|


†Corresponding author. E-mail: yliu6@ahut.edu.cn
*Project supported by the Anhui Provincial Science Key Foundation of Higher Education Institutions, China (Grant No. KJ2011A053) and the National Natural Science Foundation of China (Grant No. 51202005).
Mn substitution compounds YCo1− xMn xO3 (0 ≤ x ≤ 0.2) are synthesized by using the sol–gel process. Electrical transport properties of YCo1− xMn xO3 are investigated in the temperature range from 200 K to 780 K. The experimental results show that after Mn substitution the electrical resistivity of YCo1− xMn xO3 first increases, then decreases, which is due to the electrons introduced by Mn doping. The sign of Seebeck coefficient for YCo1− xMn xO3 ( x ≠ 0) is positive or negative, which is also proved by the Hall coefficient measurement. Moreover, at about room temperature, the Seebeck coefficient of YCo1− xMn xO3 with 1% doping Mn content becomes a negative value, whose absolute value is maximum; furthermore, the absolute value gradually decreases with increasing the Mn substitution content, which can be explained by the double carrier model.
In recent years, much attention has been paid to rare-earth cobalt oxide RCoO3 (R represents the rare-earth element) because of its interesting electrical and magnetic properties.[1– 3]RCoO3 oxide has a large thermopower, which is one of the important requirements for a thermoelectric material with good performance, [4] therefore, it is also investigated as a good candidate for thermoelectric applications. In 2004, Androulakis et al. found that the figure of merit ZT value for La0.95Sr0.05CoO3 was 0.18, [5] which stimulated the interest in investigating oxide thermoelectric materials.
YCoO3 has a distorted perovskite structure [6, 7] with orthorhombic symmetry (space group Pbnm (Z = 4)) and six oxygen atoms surround each cobalt ion. YCoO3 has a large thermopower S ∼ 1039 μ V· K− 1[4] and small thermal conductivity κ ∼ 5.39 W · m− 1 · K− 1[4] at about room temperature, the large thermopower and small thermal conductivity are two preconditions for having good thermoelectric performance, therefore, scientists have also considered YCoO3 as a thermoelectric material candidate. Our group systematically investigated thermoelectric properties and physical mechanisms of YCoO3 based thermoelectric materials by doping or substitution.[4, 8– 12] We successfully substituted Ca for Y in YCoO3 to reduce its electrical resistivity, and we estimated its thermoelectric performance. Moreover, the experimental results show that the temperature dependence of electrical resistivity for Y1− xCaxCoO3 is consistent with the small-polaron hopping conduction model. For the Sr-substituted sample Y1− xSrxCoO3, Sr substitution results in reducing its electrical resistivity, and effectively improving its thermoelectric properties. The substitution of Ni for the Co site in YCo1− xNixO3 indicates that its electrical resistivity decreases and the high-temperature thermoelectric properties are improved. However, the conduction mechanism of YCoO3 has hardly been investigated. In order to understand in the round the conduction mechanisms of YCoO3 based materials, we will substitute Mn into Co site in YCoO3, and investigate the conduction mechanisms and behaviors of YCoO3 based material.
Manganese doped oxides YCo1− xMnxO3 were prepared stoichiometrically from Y(NO3)3· 6H2O (99.5%), Co(NO3)2 · 6H2O (99.0%), and Mn(NO3)2 (50%) solution. 0.02x (x = 0, 0.01, 0.05, 0.15, 0.20) mol of Mn(NO3)2, 0.02 (1 − x) mol of Co(NO3)2· 6H2O (99.0%), and 0.02 mol of Y(NO3)3· 6H2O (99.0%) were dissolved in 20 ml of an aqueous solution of 0.02 mol citric acid (99.5%) by using de-ionized water. The solutions were continuously stirred for about 1 h, resulting in a homogenization of Mn2+ , Co2+ and Y3+ cations in the mixture solution. Subsequently, the mixtures were slowly heated to 90 ° C, and at this temperature they were dried for 12 h, forming a brown powder from the mixtures. The brown powders were calcined in air at atmospheric pressure in a muffle furnace at 300 ° C for 2 h, forming black powder samples, so as to remove organic compounds. Then, these powder samples were ground and subsequently compressed into pellets 13 mm in diameter. Finally, bulk samples were obtained by sintering the green pellets in air in a tube furnace at 900 ° C for 120 h, subsequently followed by spontaneously cooling slowly down to room temperature in the furnace.
Phase structures and the lattice constant for the obtained compounds were determined by using x-ray diffraction (XRD) (Philips-X PERT PRO diffractometer) with Cu Kα irradiation at room temperature. The accurate lattice parameters were determined from the d-value of the XRD peaks using a standard least-squares refinement method with an Si standard for calibration. To measure their electrical resistivity, bar-shaped specimens of the size (∼ ) 12 mm × (∼ )2 mm × (∼ ) 1.0 mm were cut from the bulk samples. The electrical resistivity and Seebeck coefficient were measured on a computer-assisted device. DC electrical resistivities were measured in a vacuum by a conventional standard four-probe method in the temperature range from 200 K to 720 K. The Seebeck coefficient was also measured in a vacuum in the temperature range from 300 K to 780 K. The carrier concentration was determined by measuring the Hall coefficient at room temperature in a magnetic field H = 0.73 T.
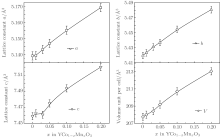
Figure 1 shows the room-temperature XRD patterns of YCo1− xMnxO3 (x = 0, 0.01, 0.03, 0.05, 0.10, 0.20). One can see that the main diffraction peaks of YCoO3 are in accordance with the indexed standard JCPDS card (No. 88-0425), and the main diffraction peaks of doped samples YCo1− xMnxO3 (x ≠ 0) are also in agreement with the standard JCPDS card. Moreover, the XRD diffraction peaks of YCoO3 are the same as those of the compounds synthetized by Liu et al.[8] and Thornton et al.[3] In addition, the calculated lattice parameters (a, b, and c) with a permissible error range ± 0.05% increase with the increase of Mn concentration, which are plotted in corresponding panels, and the volume unit cell versus Mn concentration is shown in the remaining panel in Fig. 2. Therefore, these indicate that Mn has been substituted for Co of YCoO3, and the substituted compounds YCo1− xMnxO3 have formed.
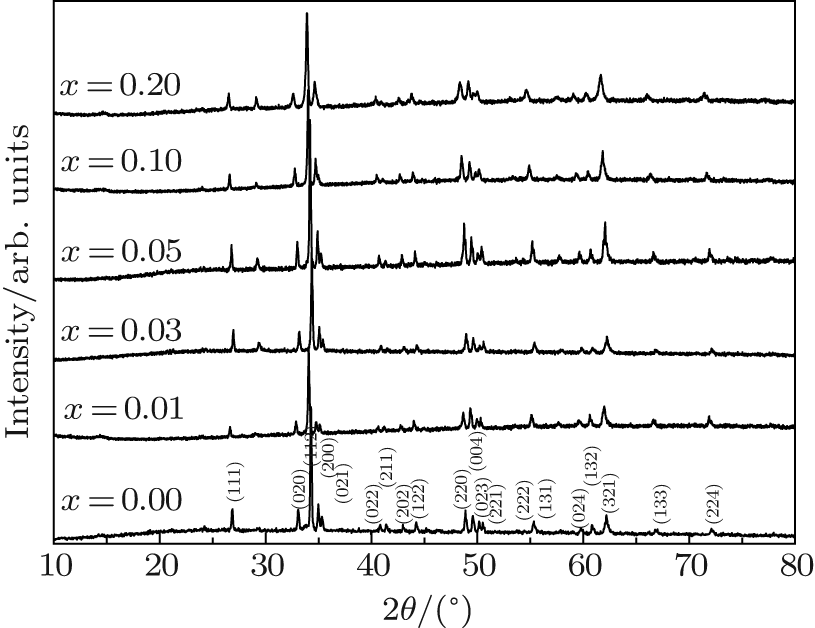 | Fig. 1. XRD patterns (Cu Kα irradiation) for YCo1− xMnxO3. |
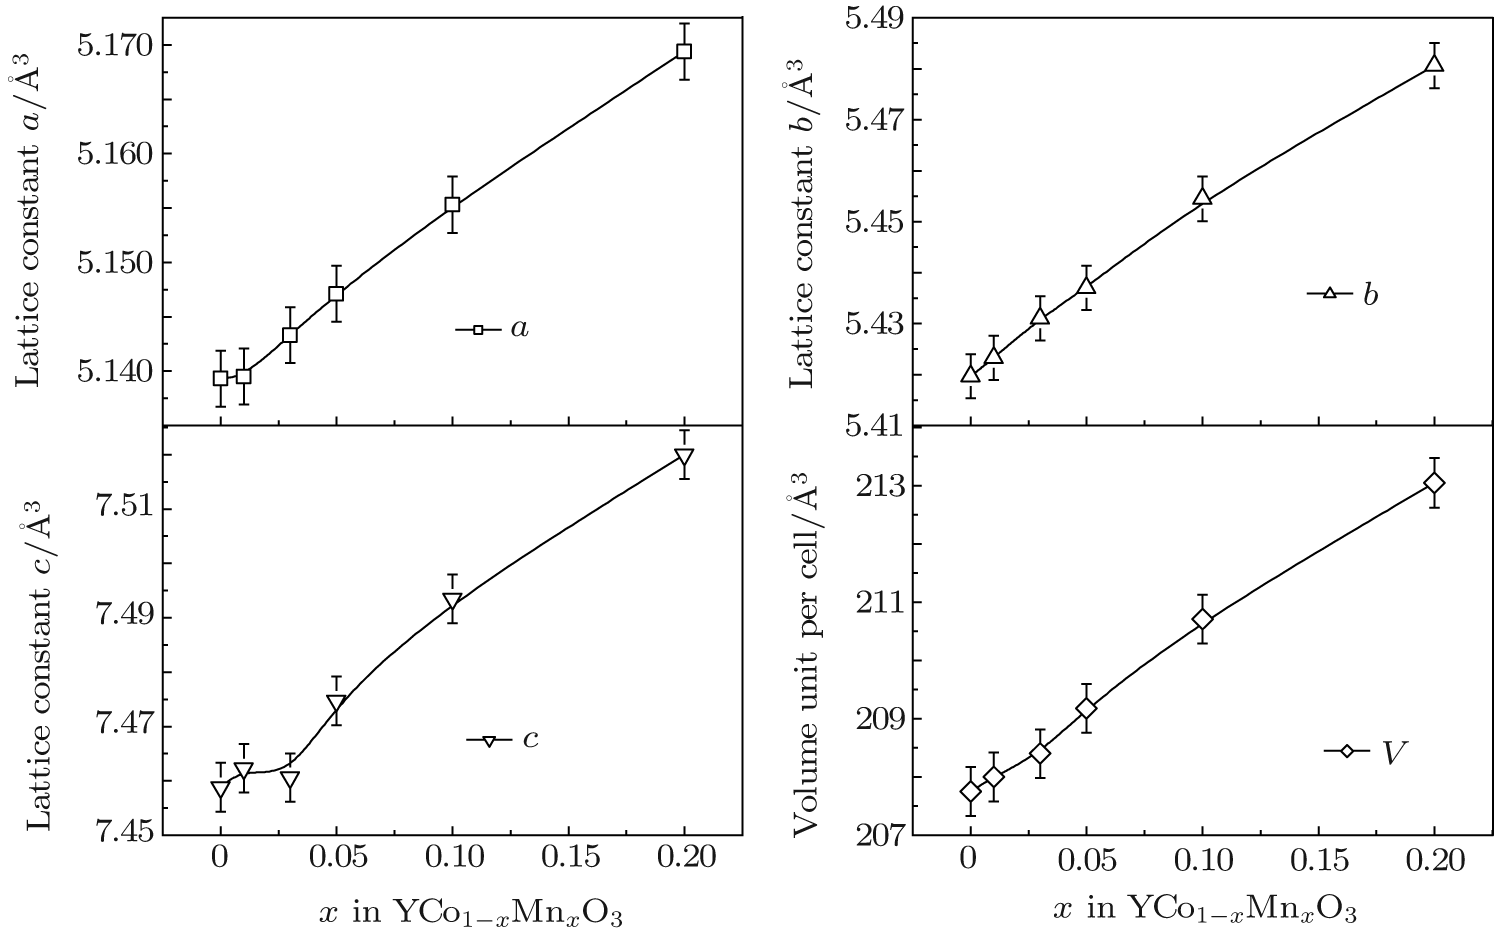 | Fig. 2. Lattice constants a, b, c, and volume per unit cell V for YCo1− xMnxO3. |
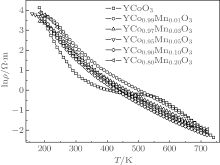
The temperature dependences of electrical resistivity for YCo1− xMnxO3 samples are shown in Fig. 3. To clearly show the electrical resistivity of YCo1− xMnxO3 in the whole temperature range, the longitudinal axis (electrical resistivity) is plotted on a logarithm scale. One can see that the electrical resistivity of the YCoO3 sample has a gradual decrease with the increase of temperature in the whole temperature range. After Mn substitution, great changes take place in the temperature dependences of electrical resistivity for samples YCo1− xMnxO3 (x ≠ 0), that is, as temperature rises, the electrical resistivity of YCo1− xMnxO3 decreases almost exponentially. For instance, the electrical resistivity of the x = 0.05 sample decreases from ∼ 6.65 × 10³ Ω · m at 160 K to ∼ 0.88 Ω · m at 450 K, then to ∼ 0.014 Ω · m at 670 K. Moreover, after Mn doping in YCoO3, the electrical resistivities of samples YCo1− xMnxO3 (x ≠ 0) increase at low temperature T < 500 K, for example, the room-temperature electrical resistivity increases from 6.9 Ω · m for sample x = 0 to 1.58 × 10² Ω · m for x = 0.01, 57.7 Ω · m for x = 0.03, 39.9 Ω · m for x = 0.05, 35.0 Ω · m for x = 0.1, and 82.3 Ω · m for x = 0.2, which is due to the change of carrier concentration as indicated in Table 1. For a small amount of substituted Mn element content (x = 0.01), the electrical resistivity has a great change. This is due to the electrons induced mainly by Mn substitution, for YCoO3 is hole conduction, [4] which results in a decrease in hole concentration. The carrier mobility also shows the same result, that is, it decreases from 0.61 cm2· V− 1· S− 1 down to 0.18 cm2· V− 1· S− 1 (Table 1).
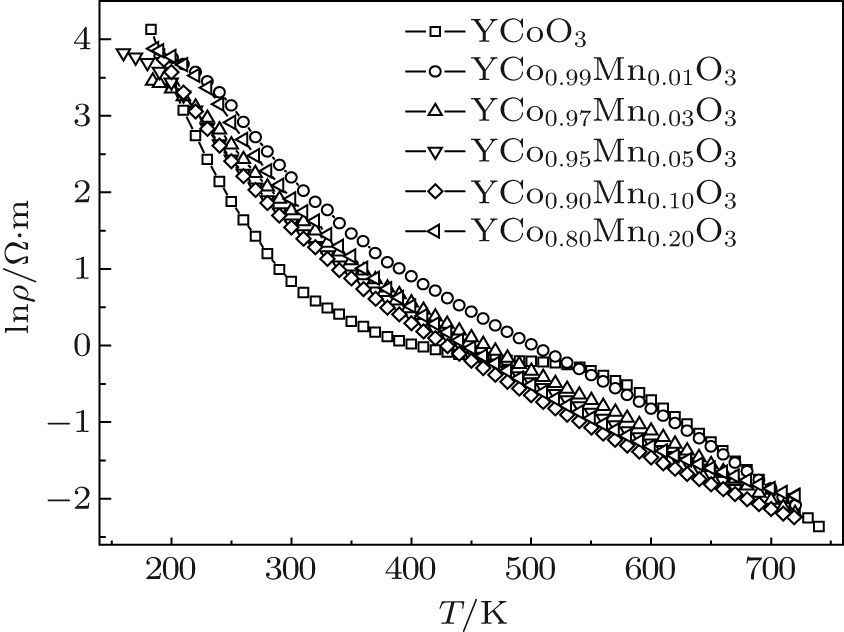 | Fig. 3. Temperature dependence of electrical resistivity ρ of YCo1− xMnxO3. |
| Table 1. Values of room-temperature resistivity ρ rt, carrier concentration np(ne), and carrier mobility μ p (or μ e) for YCo1− xMnxO3. |
However, at high temperature T > 500 K, the electrical resistivity of the doping sample is smaller than that of the YCoO3 sample, and the electrical resistivity of each of the samples almost tends to a constant value at the highest temperature. The reason is that the conductivity of YCo1− xMnxO3 is related to the electrical configuration of Co ions, [4] the doping Mn element affects the change of the spin state of Co ions, resulting in the change in electrical resistivity.
From Fig. 2, one can see that the Mn doping for the YCoO3 sample gives rise to the enlargement in the volume unit per cell, indicating that when a Mn element substitutes for Co, the Mn ion is mainly in the form of a Mn3+ ion, because the Mn3+ ion radius (0.66 Å ) is larger than the Co3+ (0.63 Å ) ion radius. However, this does not exclude the existence of Mn4+ ionic in YCo1− xMnxO3. The partial Mn4+ ions act as donors offering electrons. These electrons will compensate for those holes in the acceptor impurity (or defect) level, bringing on a great decrease of hole concentration, thus resulting in a significant increase in electrical resistivity. However, with the increase in dopping Mn content, more Mn4+ ions will be introduced, in addition to the electrons as the donor to compensate for those holes in the acceptor impurity (or defect) level, other electrons will be ionized into the conduction band, causing the obvious electron conduction. When the double carriers (electron and hole) conduct electricity, the total resistivity can be expressed as, [13]

where q is the electrical charge of the carrier, ne is the electron concentration, np is the hole concentration, μ e is the electron mobility, and μ p is the hole mobility. One can see from the equation of the double carrier conduct that as the Mn content increases, the electron concentration of YCo1− xMnxO3 (x > 0.1) increases, then it results in a decrease of electrical resistivity.
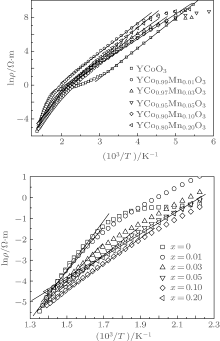
For comprehending in more detail the temperature of electrical resistivity for YCo1− xMnxO3, plots of the logarithm of electrical resistivity ρ versus the reciprocal of temperature T are shown in Fig. 4. We can note that there are two good linear relations between ln ρ and 1/T at a low temperature range (LTR) (T < 304 K for x = 0, T < 450 K for x = 0.01, T < 405 K for x = 0.03, 0.05, 0.10, 0.20) and high temperature range (HTR) (T > ∼ 455 K). This indicates that they obey the thermal activation conduction model ρ = ρ 0 exp(Ea/κ BT) (ρ 0 is a constant, Ea is the activation energy for conduction, κ B is the Boltzmann constant, and T is the absolute temperature) as shown in Fig. 4. According to the equation ρ = ρ 0 exp(Ea/κ BT), we obtain the activation energy Ea1 at LTR and Ea2 at HTR (Fig. 5). One can see that as the Mn content increases, the activation energy gradually decreases, for instance, at HTR, the activation energy values decrease from 1.024 eV for x = 0 to 0.612 eV for x = 0.05, then to 0.443 eV for x = 0.20, indicating that the carrier conduction becomes stronger with the increase of Mn content. However, the activation energy at LTR is smaller than at HTR, which suggests that the carrier conduction at LTR is much easier than at HTR.
 | Fig. 4. Logarithmic electrical resistivity ρ versus reciprocal temperature of YCo1− xMnxO3. |
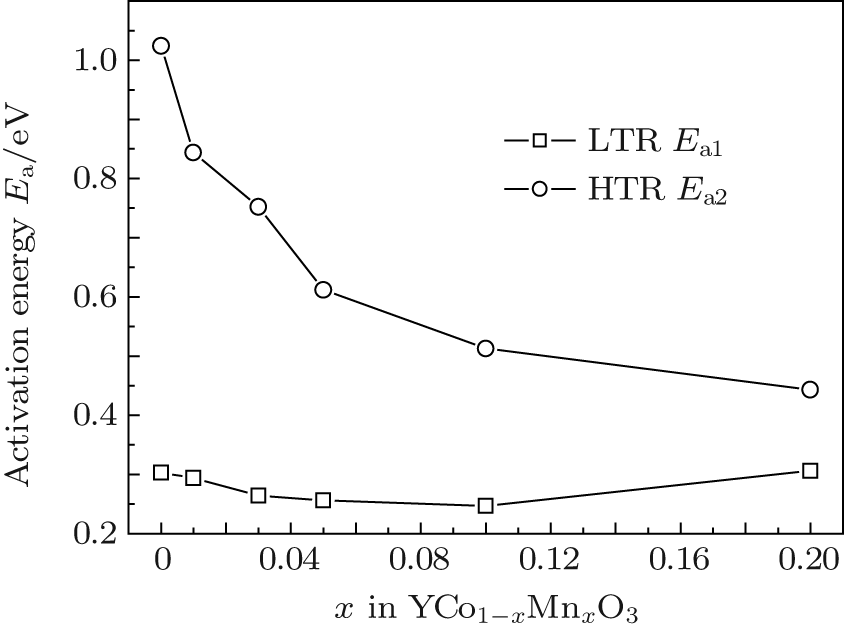 | Fig. 5. Activation energy Ea versus x in YCo1− xMnxO3. |
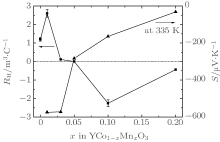
Figure 6 shows the temperature dependences of Seebeck coefficient S for samples YCo1− xMnxO3 (x = 0, 0.01, 0.03, 0.05, 0.1, 0.2). The sign of the Seebeck coefficient for YCoO3 is positive over the entire temperature range (300 K– 780 K), i.e., p-type conduction, which accords with the result of the Hall coefficient in Fig. 7. However, the sign of Seebeck coefficient for YCo1− xMnxO3 (x ≠ 0) is complicated, for each sample, both positive and negative. At room temperature, with a 1%-doping Mn content, the absolute value of the Seebeck coefficient for YCo0.99Mn0.01O3 becomes the largest value, which is negative, moreover, the absolute value of the Seebeck coefficient for YCo1− xMnxO3 gradually decreases with increasing the Mn substitution content, such as, from 574 μ V· K− 1 for x = 0.01, to 283 μ V· K− 1 for x = 0.05, to 164 μ V· K− 1 for x = 0.1, and to 32 μ V· K− 1 for x = 0.2, which are shown in Fig. 6. In order to get a better understanding of the phenomenon, we measure the room-temperature Hall coefficient RH for YCo1− xMnxO3 as shown in Fig. 7. We can note that the Hall coefficient changes from the positive value (for x = 0.01, 0.03 samples) to the negative value (for x = 0.1, 0.2 samples), correspondingly; moreover, the Seebeck coefficient changes from the positive value for the x = 0 sample to negative value (for x = 0.01, 0.03 samples), then gradually increases, which finally tends to a positive value.
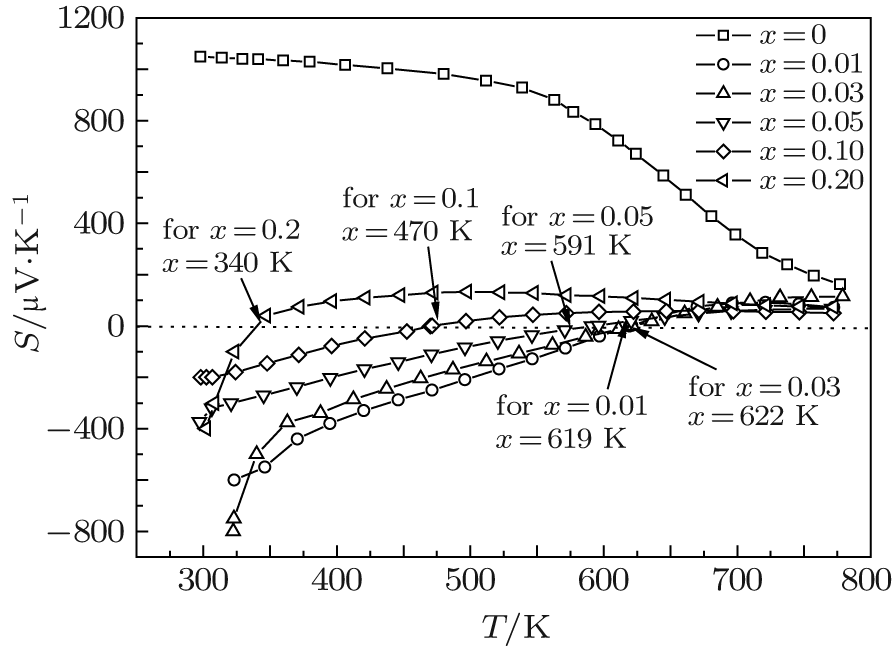 | Fig. 6. Temperature dependences of Seebeck coefficient S for YCo1− xMnxO3. |
The changes of Seebeck coefficient and Hall coefficient RH can be comprehended by the double carrier model. As the double carriers conduct, the Hall coefficient can be expressed as, [14]

where γ e and γ p are the Hall factors of electron and hole, respectively. The Hall coefficient of YCoO3 is positive, i.e., RH = γ p/npq > 0, np ≫ ne. With the increase of dopping Mn content, Mn4+ ion is introduced, resulting in an increase of electron concentration for YCoO3. These doped electrons will partially offset the hole contribution to the Hall coefficient. Therefore, with increasing the Mn content, the Hall coefficient decreases. From Fig. 7, we can see that as the dopping Mn content arrives at about 5%, RH = (3.42 ± 0.27) × 10− 6 m3/C value, compared to RH = 2.6 m3/C value for the sample x = 0.01, tends to 0, that is, 
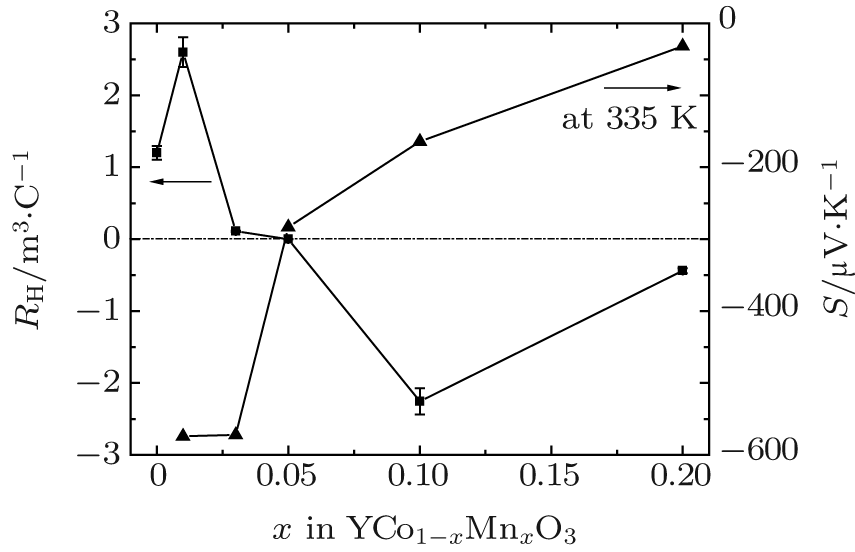 | Fig. 7. Hall coefficient RH and Seebeck coefficient at 335 K versus x in YCo1− xMnxO3. |
When the double carrier conducts, the Seebeck coeffient can be expressed as, [15]

where σ n = qneμ e is the electron conductivity, σ p = qnpμ p is the hole conductivity, Sn and Sp are the thermopowers of electron and hole, respectively. Substituting σ n = qneμ e and σ p = qnpμ p into the above equation, we can obtain

We can see from the above equation that the Seebeck coefficient is determined in ne (or np), μ e (or μ p), Sn, and Sp. As the Mn doping content is x = 0.01, a few electrons are introduced. At present, electrons exist in a nondegenerate state, thereby making the Seebeck coefficient larger because of S ∝ 1/n, resulting in neμ eSn > npμ pSp. Therefore, the Seebeck coefficient for the sample with x = 0.01 becomes a positive value. With the increase of the doped Mn content, ne increases, the absolute value of Sn decreases, and the total absolute value of neμ eSn decreases; therefore, the total absolute value of S decreases.
In addition, one can see that the Seebeck coefficients of YCo1− xMnxO3 at high temperature (T ∼ 800 K) all tends to a limit value, because the Seebeck coefficient of YCo1− xMnxO3 at high temperature is associated with the electrical configuration of Co ions.[4]
Electrical transport properties of Mn substitution compounds YCo1− xMnxO3 (0 ≤ x ≤ 0.2), prepared by using the sol– gel process, are investigated in the temperature range from 200 K to 780 K. The results show that after Mn substitution, the electrical resistivity of YCo1− xMnxO3 first increases, then decreases at temperature T < 500 K, which is due to the electrons introduced by Mn doping; at the highest temperature, the electrical resistivity of YCo1− xMnxO3 approaches to a value relating to the electrical configuration of Co ions. The sign of Seebeck coefficient for YCo1− xMnxO3 (x ≠ 0) is positive or negative for each sample, which is also proved by Hall coefficient measurement. Moreover, at about room temperature and with doping Mn content being 1%, the Seebeck coefficient becomes negative and its aboslute value is maximum, furthermore, the Seebeck coefficient absolute value of YCo1− xMnxO3 gradually decreases with increasing the Mn substitution content, which is explained by the double carrier model.
| 1 |
|
| 2 |
|
| 3 |
|
| 4 |
|
| 5 |
|
| 6 |
|
| 7 |
|
| 8 |
|
| 9 |
|
| 10 |
|
| 11 |
|
| 12 |
|
| 13 |
|
| 14 |
|
| 15 |
|