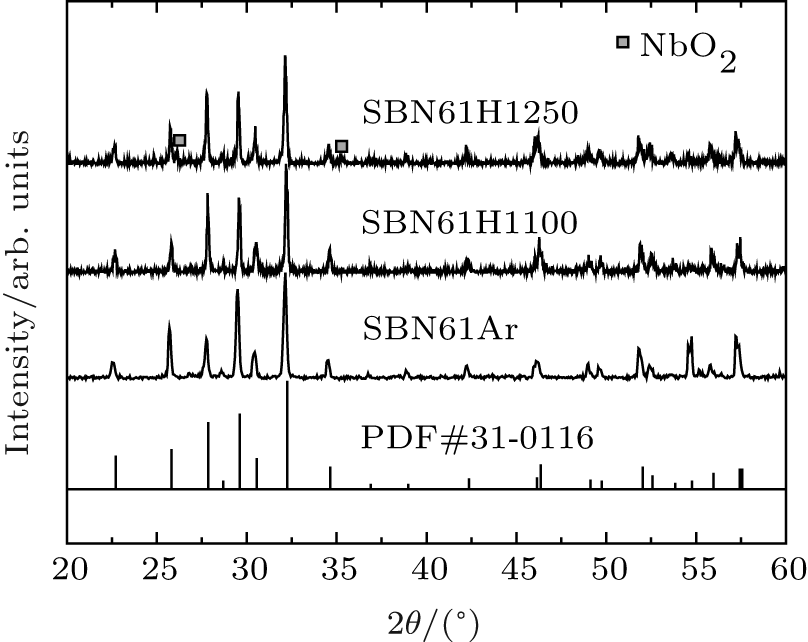
3.1. The x-ray diffraction and SEM analysisIn Fig. 1 we shows the x-ray diffraction patterns of the SBN61 samples in various oxygen-reduction conditions. The XRD patterns show that the profile of each sample includes all the diffraction peaks of tungsten bronze-structured Sr0.61Ba0.39Nb2O6. It is found that the NbO2 second phase is in the heavily oxygen-reduced sample SBN61H1250. The Nb4+ /Nb5+ ratio is increased by the oxygen-reduction reaction, and the Nb4+ O2 second phase will appear with the increase of Nb4+ /Nb5+ content.[11] Referring to Lee et al.’ s[10] paper, both the reductive forming gas and the high annealing temperature contribute to deepening the oxygen-reduction degree, so the oxygen-reduction degree increases in the order of SBN61Ar (annealed at 1250 ° C in argon), SBN61H1100 (annealed at 1100 ° C in a gas mixture of H2/Ar), and SBN61H1250 (annealed at 1250 ° C in a gas mixture of H2/Ar).
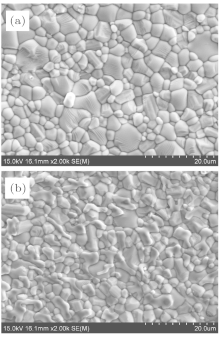
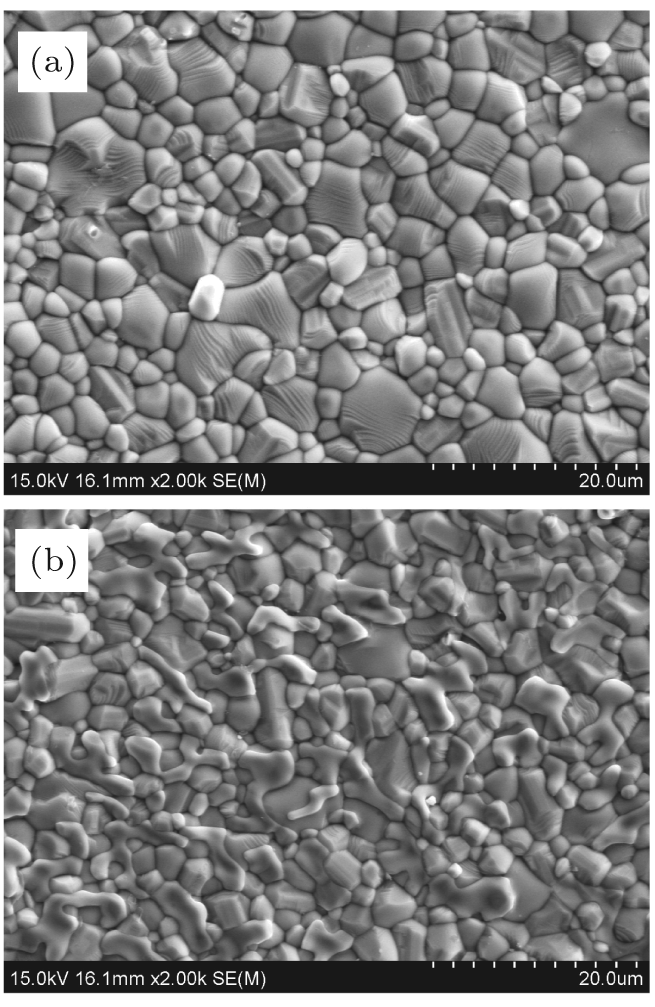
The densities and lattice parameters of the samples are shown in Table 1. The lattice parameters do not vary monotonically with increasing the degree of oxygen-reduction. The non-monotonic variations of the lattice parameters may be affected by many factors, such as the oxygen vacancies, the larger radii of Nb4+ than Nb5+ , and the bond angles in the NbO6 octahedrons.[11] The relative densities are calculated, which are also shown in Table 1. All the samples have high relative densities above 96.5%. Figure 2 shows the SEM micrographs of samples SBN61Ar and SBN61H1250. The average grain size is 3.11 μ m and 2.83 μ m for SBN61Ar and SBN61H1250, respectively. As seen from Fig. 2, the SBN61 ceramics have compact grains for both heavily and slightly oxygen reduction degrees. As shown in Fig. 2(b), there are two kinds of grains: coarse grains and slender grains. According to the results of EDS, the coarse grains are of the SBN61 crystal and the slender grains are of the NbO2 second phase. These slender grains do not exist in the sample SBN61Ar as shown in Fig. 2(a), which is consistent with the XRD result.
Table 1.
Table 1.
 Table 1. Lattice parameters (a, b, c), theoretical densities (ρ th), measured densities (ρ m), and relative densities (ρ r) of the samples. | a = b/Å | c/Å | ρ th/(g/cm3) | ρ m/(g/cm3) | ρ r |
|---|
| SBN61Ar | 12.441 | 3.931 | 5.31 | 5.14 | 96.8% | | SBN61H1100 | 12.434 | 3.921 | 5.33 | 5.18 | 97.2% | | SBN61H1250 | 12.466 | 3.928 | 5.29 | 5.14 | 97.2% |
| Table 1. Lattice parameters (a, b, c), theoretical densities (ρ th), measured densities (ρ m), and relative densities (ρ r) of the samples. |
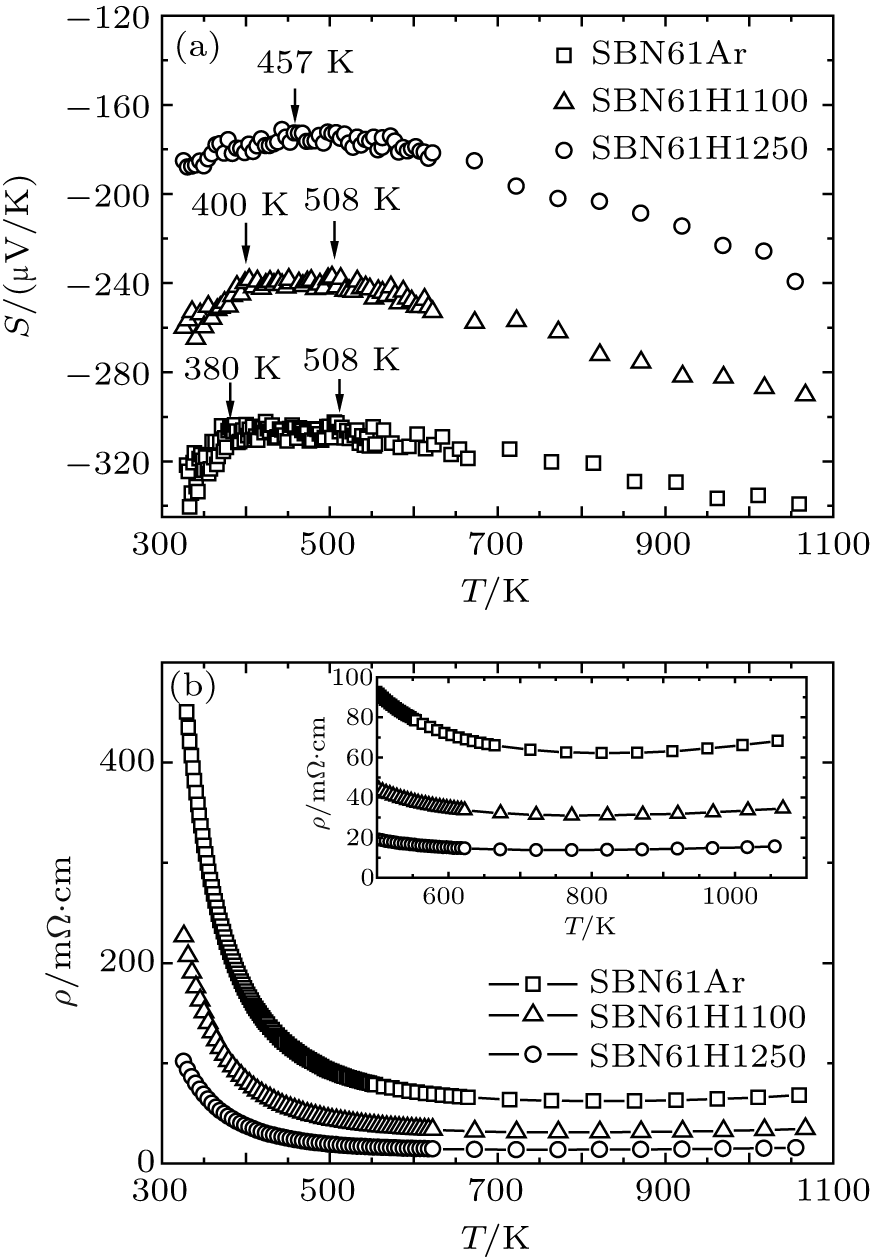
3.2. Seebeck coefficient and electrical resistivityFigure 3 shows the results of electrical resistivity ρ and the Seebeck coefficient S for samples SBN61Ar, SBN61H1100, and SBN61H1250. The electrical resistivity and the Seebeck coefficient are measured intensively below 623 K. As shown in Fig. 3, the temperature dependences of Seebeck coefficient and electrical resistivity below 508 K are similar to those in the slightly reduced SBN61 ceramics reported by Lee et al.[11] However, in Lee et al.’ s report, the temperature dependence of the Seebeck coefficient changes in the lower pO2 annealed sample. This distinction may be ascribed to the higher annealing oxygen partial pressure in our experiment. Moreover, we measure the Seebeck coefficient and the electrical resistivity up to 1073 K and find a different conduction behavior in the high temperature region (above 508 K). As shown in Figs. 3(a) and 3(b), both the electrical resistivity and the magnitudes of the Seebeck coefficient decrease with the deepening oxygen-reduction degree, which accords with Lee et al.’ s results.[11] As a result, the thermoelectric power factor (PF = S2/ρ ) is enhanced from 182 μ W/K2m (in SBN61Ar at 1073 K) to 375 μ W/K2m (in SBN61H1250 at 1073 K).
In the following, the electrical transport properties are discussed in detail. The Seebeck coefficient directly reflects the behavior of the band structure and is less influenced by the scattering at the interfaces of the grain boundaries, therefore, the discussion is based mainly on the behavior of the Seebeck coefficient. As shown in Fig. 3(a), the behaviors of the Seebeck coefficients of the SBN61Ar and SBN61H1100 samples can be divided into three parts: part I is in the low temperature range (below 380 K for SBN61Ar, and below 400 K for SBN61H1100); part II is in the middle temperature range (380 K∼ 508 K for SBN61Ar, and 400 K∼ 508 K for SBN61H1100); and part III is in the high temperature range (above 508 K for SBN61H1100 and SBN61Ar). The behavior of the Seebeck coefficient of the SBN61H1250 sample can be divided into two parts at temperature 457 K.
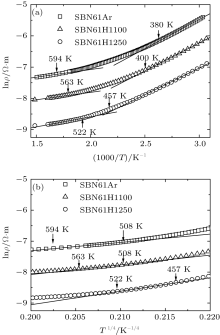
Firstly, we discuss the slightly reduced samples SBN61Ar and SBN61H1100. For these two samples, their temperature ranges are divided into three parts. In part I, the magnitudes of the Seebeck coefficients decrease with the increase of temperature, and the values of ln ρ for the two samples each show a linear dependence on 1/T, as displayed in Fig. 4(a), which indicates a thermal activation behavior. The ρ and S of this behavior can be related by[14]


where ρ 0 and A are the constants, kB is the Boltzmann constant, Eρ is the overall activation energy for conduction, and Es is the activation energy associated with carrier generation. If Eρ = Es, the semiconductor gap and the resistivity are thermally activated; however, if Eρ is larger than Es, the behavior is dominated by polaron hopping.[14] In this case, the charge carriers just jump between the neighbouring sites and the hopping is also thermally activated.[14, 15] From the data in Figs. 3(a) and 4(a), the values of Eρ and the Es for sample SBN61Ar and sample SBN61H1100 can be calculated according to Eqs. (1) and (2): Eρ is about 0.29 eV, and Es is about 0.01 eV. Apparently, Eρ is larger than Es, so the conduction behavior in part I is dominated by the thermal activated polaron hopping.
Part II shows the scenarios of temperature invariant S for the two samples SBN61Ar and SBN61H1100. There is an obvious change for the Seebeck coefficient from part I to part II, and this change may be correlated with the 4mm-to-4/mmm phase transition.[10, 11] In this part, the temperature-independent Seebeck coefficient can be described by the Heikes formula: S = − (kB/e) ln[(2 − c)/c], where c is the ratio of the number of electrons to the number of sites. It indicates that the Seebeck coefficient is determined solely by the constraints on the occupancy of states and the density of electrons in the system. The temperature independence of the Seebeck coefficient is governed entirely by the entropy change per added carrier.[16, 17] At the same time, the electrical resistivity shows an insulating behavior. Considering the complex crystal structure and large disorder in SBN, this behavior is probably due to the Fermi glass behavior, in which the disorder is great enough to ensure that electrons are localized in the Anderson sense.[14]
In part III, the magnitudes of the Seebeck coefficient increase steadily with the increase of temperature, and the slope of S versus T plot does not change obviously. The electrical resistivity values of these two samples each show a transition from semiconductor behavior to metal-like behavior at about 770 K. Taking these factors into account, these transport properties are assumed to be dominated by the Anderson localized behavior in a conduction band. Therefore, the resistivity should follow the variable range hopping (VRH) model at first, and the relation between ρ and T is given by Mott’ s law[18]

where ρ 1 and C are the constants and T0 is the Mott characteristic temperature. As shown in Fig. 4(b), the ln ρ depends linearly on T− 1/4 in the first temperature region in part III, following the VRH model. Then, after the temperature rises above T0, the electrons begin to enter into the extended states, and the variable range hopping turns into the fixed range hopping. Thus, the resistivity is determined mainly by the thermal activation behavior, and the relation of ρ and T obeys the following equation:[18]

where ρ 2 is a constant, and Δ ε = ε c − ε F is the thermal activation energy (ε c is the mobility edge, and ε F is the Fermi level). The ln ρ linearly depending on 1/T above T0 (∼ 594 K for SBN61Ar, 563 K for SBN61H1100) is also shown in Fig. 4(a). Finally, because plenty of electrons enter into the extended states, no more electrons enter into the extended states from the localized states with the increase of temperature. Therefore, the scattering plays an important role in determining the electrical resistivity. In this case, the resistivity should follow the metal-like model: ρ ∼ Tα , where α is an exponent of T.[18] As shown in the inset of Fig. 3(b), above 770 K, the ρ begins to increase with the increase of temperature, indicating the metal-like conduction behavior. Therefore, it could be concluded that the electrical conduction behaviors in part III for SBN61Ar and SBN61H1100 should be dominated by the Anderson localized theory.
In summary, the electrical transport behaviors of SBN61Ar and SBN61H1100 samples are dominated by the thermally-activated polaron hopping in the low temperature range, the Fermi glass behavior in the middle temperature range, and the Anderson localized behavior in the high temperature range. In the low temperature region, the interaction between electrons and the lattice is very strong, and the lattice near electrons is distorted to form the polaron. So the transport behavior is dominated by the thermally-activated polaron hopping. After the phase transition around 400 K, the interaction between electrons and the lattice is weakened and the polaron is broken up. In the intermediate temperature region, the disorder of the lattice is so strong that all electron states are localized, therefore, the transport behaviors exhibit the Fermi glass behaviors. With increasing the temperature, the disorder of the lattice is weakened and the extended states appear after the phase transition at 508 K. Thus the transport behaviors are dominated by the classical Anderson localized conducting band model in the high temperature region.
In most of the heavily oxygen-reduced sample SBN61H1250, the transport behaviors can be divided into two different parts at about 457 K, as shown in Fig. 3(a). Like the discussion above, the thermal-activated polaron hopping behavior is present in the low temperature region and the Anderson localized conducting band behavior appears in the high temperature region. The Fermi glass behavior with the plateau Seebeck coefficient is not observed in the sample SBN61H1250, indicating that the disorder in the lattice should be weakened by oxygen reduced treatment. It is still an open question how the oxygen reduced treatment influences the disorder of the lattice, which needs further investigation, both experimentally and theoretically.
3.3. Thermal conductivityFigure 5 shows the variations of total thermal conductivity κ (a), and the lattice thermal conductivity κ l (b) with temperature. The value of κ l is calculated by subtracting the electronic thermal conductivity κ e from κ . κ e is calculated by the Wiedemann– Franz relation, κ e = LT/ρ (where L = 2.23 × 10− 8 V2/K2 is the Lorenz number, ρ is electrical resistivity, and T is the absolute temperature).[18] With increasing the oxygen-reduction degree, the average grain size decreases and the NbO2 second phase appears in the heavily reduced sample, both of which can reduce the lattice thermal conductivity. However, the magnitude of the lattice thermal conductivity increases, indicating that the scattering of grain boundaries and NbO2 second phase do not have the largest influence on the lattice thermal conductivity. The increase of the lattice thermal conductivity might be related to the change of the lattice structure, such as weakened disorder. As shown in Fig. 5(b), the values of lattice thermal conductivity of these three samples exhibit the same behaviors. At first, the κ l increases with the increase of temperature. Then, the high-temperature plateau κ l (∼ 1.77 W/Km, 1.97 W/Km, 1.98 W/Km for SBN61Ar, SBN61H1100, and SBN61H1250, respectively) is observed when the temperature is above 530 K. This thermal conduction behavior indicates a glass-like thermal conductivity, which probably relates to the complex lattice structure.[19, 20]
However, the magnitude of the glass-like lattice thermal conductivity of SBN61 is surprisingly larger than the one (∼ 1 W/Km) predicted by the method in the literature.[21] The origin of this glass-like thermal conductivity remains to be further investigated.


 , Wang Chun-Lei