Negative refractions by triangular lattice sonic crystals in partial band gaps*
[Alagoz S.a)†  , Alagoz B. B.
b) , Sahin A.a) , Nur S.c) ]
, Alagoz B. B.|
|


†Corresponding author. E-mail: serkan.alagoz@inonu.edu.tr
*Project supported by the Inonu Universty Scientific Research Projects Coordination Unit (Grant Nos. 2012/29 and 2013/56).
This study numerically demonstrates the effects of partial band gaps on the negative refraction properties of sonic crystal. The partial band gap appearing at the second band edge leads to the efficient transmissions of scattered wave envelopes in the transverse directions inside triangular lattice sonic crystal, and therefore enhances the refraction property of sonic crystal. Numerical simulation results indicate a diagonal guidance of coupled scattered wave envelopes inside crystal structure at the partial band gap frequencies and then output waves are restored in the vicinity of the output interface of sonic crystal by combining phase coherent scattered waves according to Huygens’ principles. This mechanism leads to two operations for wavefront engineering: one is spatial wavefront shifting operation and the other is convex–concave wavefront inversion operation. The effects of this mechanism on the negative refraction and wave focalization are investigated by using the finite difference time domain (FDTD) simulations. This study contributes to a better understanding of negative refraction and wave focusing mechanisms at the band edge frequencies, and shows the applications of the slab corner beam splitting and SC-air multilayer acoustic system.
Artificial crystals are made from periodically inhomogenization of a medium, and studies on artificial crystal structures reveal the remarkable wave propagation properties for wave-control technologies, such as perfect lenses, [1– 5] wave guides, [6] acoustic isolation, [7, 8] spatial filters, [9, 10] one-way transmission devices[11, 12] (diode), and wave propagation control devices.[13, 14] Scalability property of crystal structure[2] enables the development of innovative devices operating in a very broad range of wave spectrum from electromagnetic waves to acoustic waves. It is not easy to design acoustic properties of natural material due to difficulties in adjusting the porosity.[15] However, artificial crystal structure allows the control of spatio-spectral wave propagation properties of the artificial crystal by configuring lattice parameters, [16– 20] and the fabricating of the acoustic devices, which can be optimized to meet application specifications.
Sonic crystal (SC) consists of periodic arrays of rigid circular scatterers embedded in the air background, [6] the periodical inhomogenization of acoustic medium leads to frequency selectivity property depending on the periodicity of crystal, and thus the band gaps and conduction bands appear in the band structure of the crystal.[6, 7] Waves propagate in SC structure as if they propagate in a homogenous medium when the wavelength of incident waves is much larger than the lattice constant of SC, mainly, in the first band. When the wavelength of incident wave is slightly less than twice the lattice constant, which coincides with that of the second band of triangular lattice SC, the acoustic wave is effectively scattered and therefore the scattered wave envelope travels inside the SC structure in an allowed direction. Transmission direction of scattered wave envelope inside SC lattice is widely analyzed by using the band structure characteristics, which shows the spatio-spectral distributions of band gaps and conduction bands.
Due to the high reflection coefficient of the scattering material of SC, the scattered wave envelopes move around the solid scatterers inside the SC. This phenomenon leads to the anisotropic wave propagation inside the SC structure.[18, 21] As previously reported, the negative refraction shows the dependence on the propagation anisotropy of crystal.[22] The large negative effective refraction index (ERI) is possible at bottom edge frequencies of the second band.[22, 23] The hexagonal deformation of equifrequency contour (EFC) increases wave propagation anisotropy at the band edge frequencies.[24] Indeed, hexagonal deformation (hexagonalization) of EFC of triangular lattice SC at the second band edge establishes partial band gaps in Γ K high symmetry directions and enhances the anisotropic wave propagation inside the SC.
Specifically, the partial band gaps appearing at bottom edge frequencies of the second band leads to highly anisotropic wave transmission because partial band gaps forbid the wave propagation in certain directions inside the SC, and therefore the wave transmission is mainly channelized (guided) towards a certain symmetry direction, where partial conduction bands appear in the band structure of the SC. This wave guidance mechanism exhibits symmetrical nature inside the SC corresponding to the lattice symmetry. In the literature, different waveguide mechanisms have been reported for the longitude or transverse waves in crystal structures, such as using anisotropic defect resonators[25] and locally resonant unit.[26] Our simulations show that the guided propagation of acoustic wave at partial band gap frequency can enhance the intensity and formation of negative refracted waves and provide more intense far-field wave focalization by a triangular lattice SC. As is already known, all-angle negative refraction (AANR)[27, 28] provides wave focusing but we observe that AANR may not be a necessary for wave focalization by SC flat lens. Our numerical results confirm that the highly directional acoustic wave radiation in the transverse direction of triangular lattice SC slab can enhance the negative refraction and, correspondingly, the wave focalization. Previously, a similar discussion was given for wave focalization by photonic crystal depending on tunneling effect or guided propagation in the presence of partial band gaps.[29] Besides, Ozbay et al.[30] reported that it is possible to obtain highly directional radiation and effective negative refraction by modifying the band structure so that only the modes along the Γ X direction are allowed to propagate inside the two-dimensional (2D) photonic crystal. In a recent work, Sun and Kirk[31] also revealed that the negative refraction is possible within the partial band gap of photonic crystal. For an acoustic wave, Chen et al.[32] showed that a stable imaging effect is possible by a flat square-lattice sonic crystal slab within the partial band gap. He et al. reported that negative refractions of acoustic waves are possible even in a forbidden frequency region by using a surface grated 2D phononic crystal slab.[33] An anisotropic band gap, such as a partial gap and deaf band, was reported to form a stable imaging focus effect.[34] In our paper, we address the effects of partial band gaps in the Γ K symmetry directions on the negative refraction and wave focusing properties of triangular lattice SC. This study also explains underlying mechanisms of negative refraction and focusing appearing at the partial band gap frequencies.
The numerical analyses presented in this paper show that a 2D SC with triangular lattice geometry effectively guides scattered wave envelopes in Γ M symmetry directions (11 direction) at edges of the second band due to the existence of partial band gap in Γ K symmetry directions. This effect results in highly directional transmission of phase coupled scattered wave envelopes in a transverse direction (Γ M direction) all the way through the output interface of the SC slabs. Then, the output interface of SC slab restores the output waves from these phase coherent scattered waves according to Huygens’ principle. It is seen in FDTD simulation results that when the scattered wave envelops maintain their phase coherences inside the SC, it can restore Huygens wavefronts in the vicinity of the output interface in the form of spatially shifted and convex– concave inverse versions of the incident wavefronts.
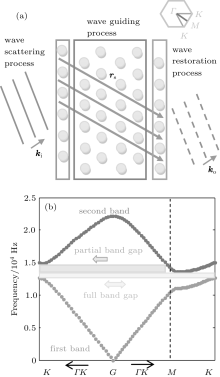
Figure 1(a) shows the functional decomposition of SC structure into three processes, which are experienced by the transverse transmission of through the SC in the presence of partial band gaps in Γ K symmetry directions (10 and 01 directions). Firstly, incident waves are scattered and negatively refracted by the first array of the SC. This process is referred to as the wave scattering process in the figure. It is then followed by a scattered wave guiding process that transmits scattered wave envelops towards the last array of SC (guiding process). Finally, the last array of SC restores the output wave of SC according to Huygens’ principle (restoration process). The collaboration of these processes implements a transverse (Γ M direction) wave conduction mechanism of the SC, and this mechanism results in two basic wavefront operations involving in negative refraction and wave focusing phenomenon: (i) spatial wavefront shifting, and (ii) convex– concave inversion of wavefronts. In this study, these effects are numerically demonstrated by FDTD simulation results. Band structure and EFC analyses are also carried out to investigate spatio-spectral wave propagation properties of the SC.
 | Fig. 1. (a) Decomposition of triangular lattice SC structure into three process: wave scattering, wave guiding, and Huygens wave restoration. (b) Band structure of the SC calculated by plane-wave expansion (PWE) method. |
The test SC used in numerical analyses has a 2D triangular lattice geometry with a lattice constant of 15 mm and a circular scatterer radius of 5 mm. The test SC is composed of eight scatterer arrays, which gives the SC slab have a width of 108 mm. The densities of the circular aluminum scatterers and the air are taken to be 2.7 g/cm3 and 1.4 g/cm3, respectively. The speed of sound (c0) in air is assumed to be 340 m/s.
The FDTD-based acoustic wave simulations[6] are widely used in spatio-temporal analyses of SCs. In the FDTD simulation, the linear acoustic wave equations are given as

and are solved numerically.[6] In Eq. (1), υ denotes the normalized particle velocity; p is the acoustic pressure;
The plane wave expansion (PWE) method[6] is used to obtain the band structure of the test SC, as shown in Fig. 1(b). This band structure reveals that the SC allows the wave transmission in the Γ M direction, whereas it prohibits the wave transmission in the Γ K directions at band edge frequencies of the second band. This asymmetric band structure results from the hexagonal deformation of the second band EFC and thus establishes partial band gaps in Γ K symmetry directions in a range of about 14300 Hz– 15000 Hz frequencies. Partial band gaps cause the transmission of wave energy mostly in Γ M symmetry directions where the edges of conduction bands allow the wave transmission. So, the partial band gaps cause strong diagonal guidance of coupled scattered wave envelop inside the triangular lattice.
An equifrequency surface (EFS) in the first Brillouin zone is frequently used to analyze the dispersion of crystal structure in the reciprocal space and it provides useful information about the spatio-spectral wave propagation properties of SCs. The EFS and band structure characteristics are commonly calculated by using the PWE method.[6] The wave equation (2) is solved by using the Floquet– Bloch theorem.[6] Finally, wn(k) eigen-angular frequencies are obtained for the first and second frequency band (n = {1, 2}).

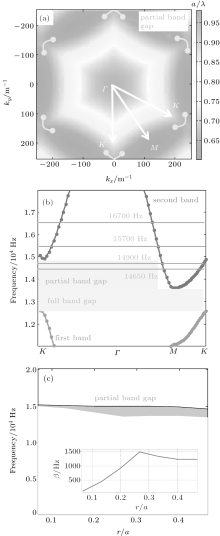
Figure 2 shows the band structure and EFS analyses of the test SC. As shown in Fig. 2(a), the triangular lattice SC presents a hexagonally deformed, convex EFS with the six high symmetry directions in the first Brillouin zone for the second band. The convex topology of EFS is widely recognized as an indicator of negative refraction because the gradient of EFS, namely group velocity (Vg = ∇ kwn), and the wave vectors k are opposite in direction (Vg · k < 0).[2, 21, 23, 27, 35] The test SC exhibits the negative refraction index within the second band.
 | Fig. 2. (a) The second band EFS of SC in Brillouin zone; (b) a close view of band structure characteristic seen in Fig. 1(b); (c) Γ K direction partial band gap frequency ranges versus (r/a). The inset shows the bandwidth of the partial band gap versus r/a. |
Anisotropic wave propagation, which is governed by the geometry of SCs, deforms EFS of the test SC into a hexagonal form within the second band. Hexagonal deformation of EFS infers the occurrence of partial band gaps at the edge frequencies of the second band. These partial band gaps appear in directions of hexagonal corners as indicated in Fig. 2(a) and prohibit the wave transmission in Γ K symmetry directions. However, the SC still allows a wave transmission in Γ M symmetry directions at this frequency due to the second band edges. As a result, it channels wave transmission in a transverse direction, similar to the transmission of wave guide structures, and causes highly directional diagonal wave propagation inside the SC structure.
Figure 2(b) shows a close view of the band structure characteristic given in Fig. 1(b). This figure indicates the sampled test frequencies selected from the partial band gap (14650 Hz and 14900 Hz) and the second band (15700 Hz, 16700 Hz). Figure 2(c) shows the partial band gap frequency region depending on the ratio of circular scatterer radius to lattice constant (r/a). The inset in Fig. 2(c) shows the bandwidth (β ) of the partial band gap. For the low r/a values, partial band gaps almost disappear because the influence of scatterer rods on wave propagation anisotropy decreases and the hexagonal deformation of EFS deteriorates. This results in the narrowing of the partial band gaps. As the r/a increases, the scatterers become more effective in the directional motion of scattered waves and thus the hexagonal deformation of EFS increases. Consequently, it widens the partial band gaps at the edge of the second band. For r/a ≥ 0.5, there is no air gap between scatterers for the travelling of scattered waves. In order to obtain a practical partial band gap, a test SC with r/a = 0.3 is used in our numerical analyses.
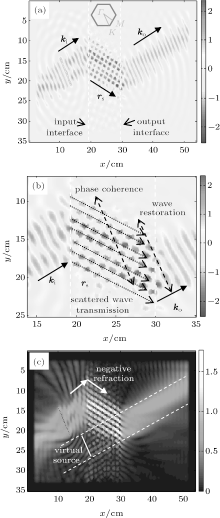
In this section, we investigate the refraction properties of a test SC at partial band gap frequencies. Figure 3 presents the FDTD simulation results obtained at 14650 Hz. This figure shows the negative refraction patterns of pressure fields by the SC and reveals the phase coherent traveling of scattered waves along the SC slab and restoration of plane waves at the output interface. As seen in the figure, when the incident plane wave (ki) comes to input interface of the SC, it is scattered by the first solid circular scatterer array. After the scattering process, the coupled scattered wave envelopes travel in the direction rs towards the output interface of SC and then the phase coherent scattered waves restore the plane waves (ko) according to Huygens’ principle in the vicinity of output interface.
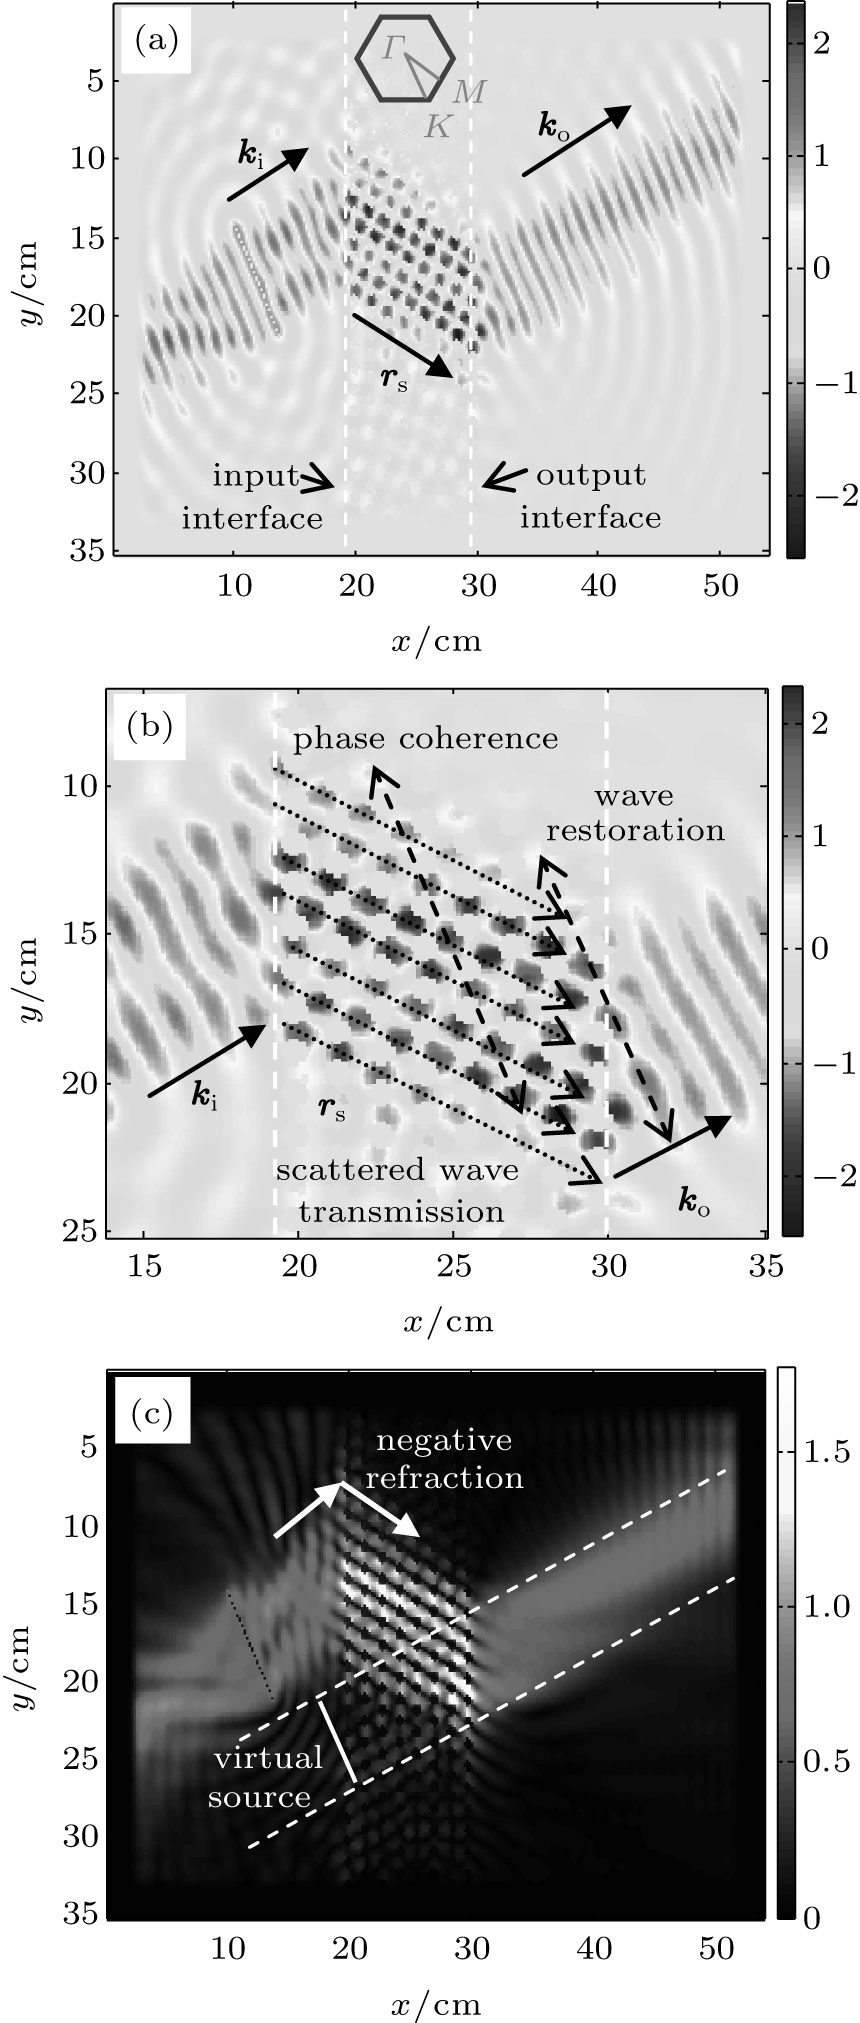 | Fig. 3. (a) Pressure field image of guided negative refraction pattern, (b) a close view of the pressure field image in panel (a), and (c) distribution of average pressure field amplitudes, obtained from FDTD simulation. |
The Huygens’ principle suggests that a wavefront can be a tangential surface to spherical wavelets from point sources.[36] Particularly, the last scatterer array (output interface of SC) behaves as a point source array and forms subsequent Huygens wavefronts. Figures 3(a) and 3(b) clearly display these processes by the pressure field images obtained from FDTD simulations. Figure 3(b) shows a close view of this wave conduction mechanism involving three processes: (i) scattering of incident waves at the input interface, (ii) phase coherent conduction of scattered wave envelope in Γ M direction inside the SC, and (iii) Huygens wave construction from restored plane waves at output interface. In fact, this mechanism results in a spatial shifting of incident wave in the direction of rs (Γ M direction) and it leads to the appearing of a virtual wave source as indicated in Fig. 3(c). Figure 3(c) shows the distribution of average pressure field amplitude and a consistent negative refraction pattern with an ERI of about − 0.9 at 14650 Hz. After the scattering of waves by circular scatterers in the first array of SC, the amplitudes of scattered envelopes traveling inside the SC in the direction rs increase. Because the energy of incoming sound wave is compressed and efficiently transmitted toward the output interface of the SC by the guidance of diagonal, the narrow air channels in rs direction among the scatterers. This transverse (diagonal) wave guiding becomes effective when the wavelength is slightly less than twice the lattice constant (a) of SC.
By considering the Floquet– Bloch theorem for the periodic system, the spatial function of the pressure field distribution is commonly written as p(r) = A(r)ejk· r, where A(r) is the amplitude distribution of pressure wave in real plane.[6] The vector r is the radial displacement vector with respect to the source location and expressed in the form of r = (x, y) in the 2D real plane. For a spatial wave shifting with rs vector, the pressure field distribution at the output of SC can be expressed as,

For a single wave beam in the direction of incident wave vector (ki), by considering Beer– Lambert law for modeling the attenuation of wave in a lossy medium, A(r) can be written as

where α ∈ R is the attenuation coefficient and A0 ∈ R is the source amplitude, A0 = pi(0). For a lossless medium, α becomes zero. Parameter ζ is any real number that is introduced for the scaling of wave vectors. The shifting vector rs can be expressed in terms of SC slab parameters as

where d is the width of SC slab and θ c is the refraction angle of the shifting vector with respect to the normal input interface. In the simulation result illustrated in Fig. 3(a), d ≅ 10.8 cm and θ c ≅ − 19° are measured and the shifting vector is obtained to be rs ≅ (10.8, − 3.9) cm from the simulation results. Assuming that the SC obeys the well-known Snell law, [36] one can rearrange Eq. (5) by using θ c = sin− 1(sin (θ i)/n) and expresses rs depending on ERI (n) and incident angle (θ i) as,

By considering the phase velocity of acoustic wave (v = w/k) and well-known Snell law for the SC interface (visin(θ c) = vcsin(θ i) and vcsin(θ o) = vosin(θ c)), the refracted wave vectors are written as kc = ki[sin(θ i)/sin(θ c)] and ko = kc[sin(θ c)/sin(θ o)] under the assumption of a monochromatic wave with angular frequency (ω ) inside a dispersive anisotropic medium similar to SCs. Then, one can write the pressure field distribution of spatially shifted monochromatic wave beams at the output of SC slab as

Here, the refraction quality index is defined as η = sin(θ i)/sin(θ o) for the SC flat lens. The parameters θ i and θ o are propagation angels of incident and output waves with respect to the normal of SC interface. Essentially, the refraction quality index expresses the relationship between output wave vector and input wave vector as ko = η ki. For η = 1, the SC slab exhibits perfect acoustic refraction, which indicates that the refraction angles of the input and output wave vectors are equal and the SC slab makes output wave vector perfectly parallel to the incident wave vector. In other words, the refraction index at the input interface (from air to SC) is equal to refraction index at the output interface (from SC to air). In our simulations, refraction quality index of the SC is close to one at about 14690 Hz. If η ≠ 1, then the SC slab changes direction of incident waves due to asymmetric refraction indices of the SC slab at output and input interfaces. The perfect acoustic refraction (η = 1) is obtained when ERI of SCs is equal to − 1. In this case, SC is theoretically assumed to focus all of the wave beams onto a single narrow spot, which is also known as “ ideal imaging” .[27] The case of “ ideal imaging” requires the condition of η = 1 for SC flat lens.
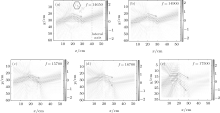
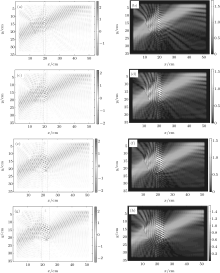
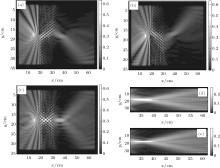
Figure 4 shows the pressure field simulation results obtained for the monochromatic wave frequencies sampled from the partial band gap and the second conduction band. One can compare negative refraction patterns obtained for the partial band gap frequencies (14650 Hz and 14900 Hz) with those for the second band frequencies (15700 Hz, 16700Hz, 17500 Hz) in Fig. 4. The balance pressure field (zero) is indicated as a white back ground in order to have a better view of pressure field patterns. Figures 4(a) and 4(b) demonstrate the enhanced negative refraction due to the guided transmission of the SC at the partial band gap frequencies. Figures 4(c)– 4(e) show the negative refraction of plane waves inside the second band, where the scattered wave is allowed to transmit in Γ K directions. Consequently, this deteriorates the negative refraction pattern of the SC and results in the appearance of two refraction patterns with different refraction angles, which is also known as birefraction.[37] The birefraction phenomenon leads to the split of total conducted wave energy between two refraction patterns with district angles.
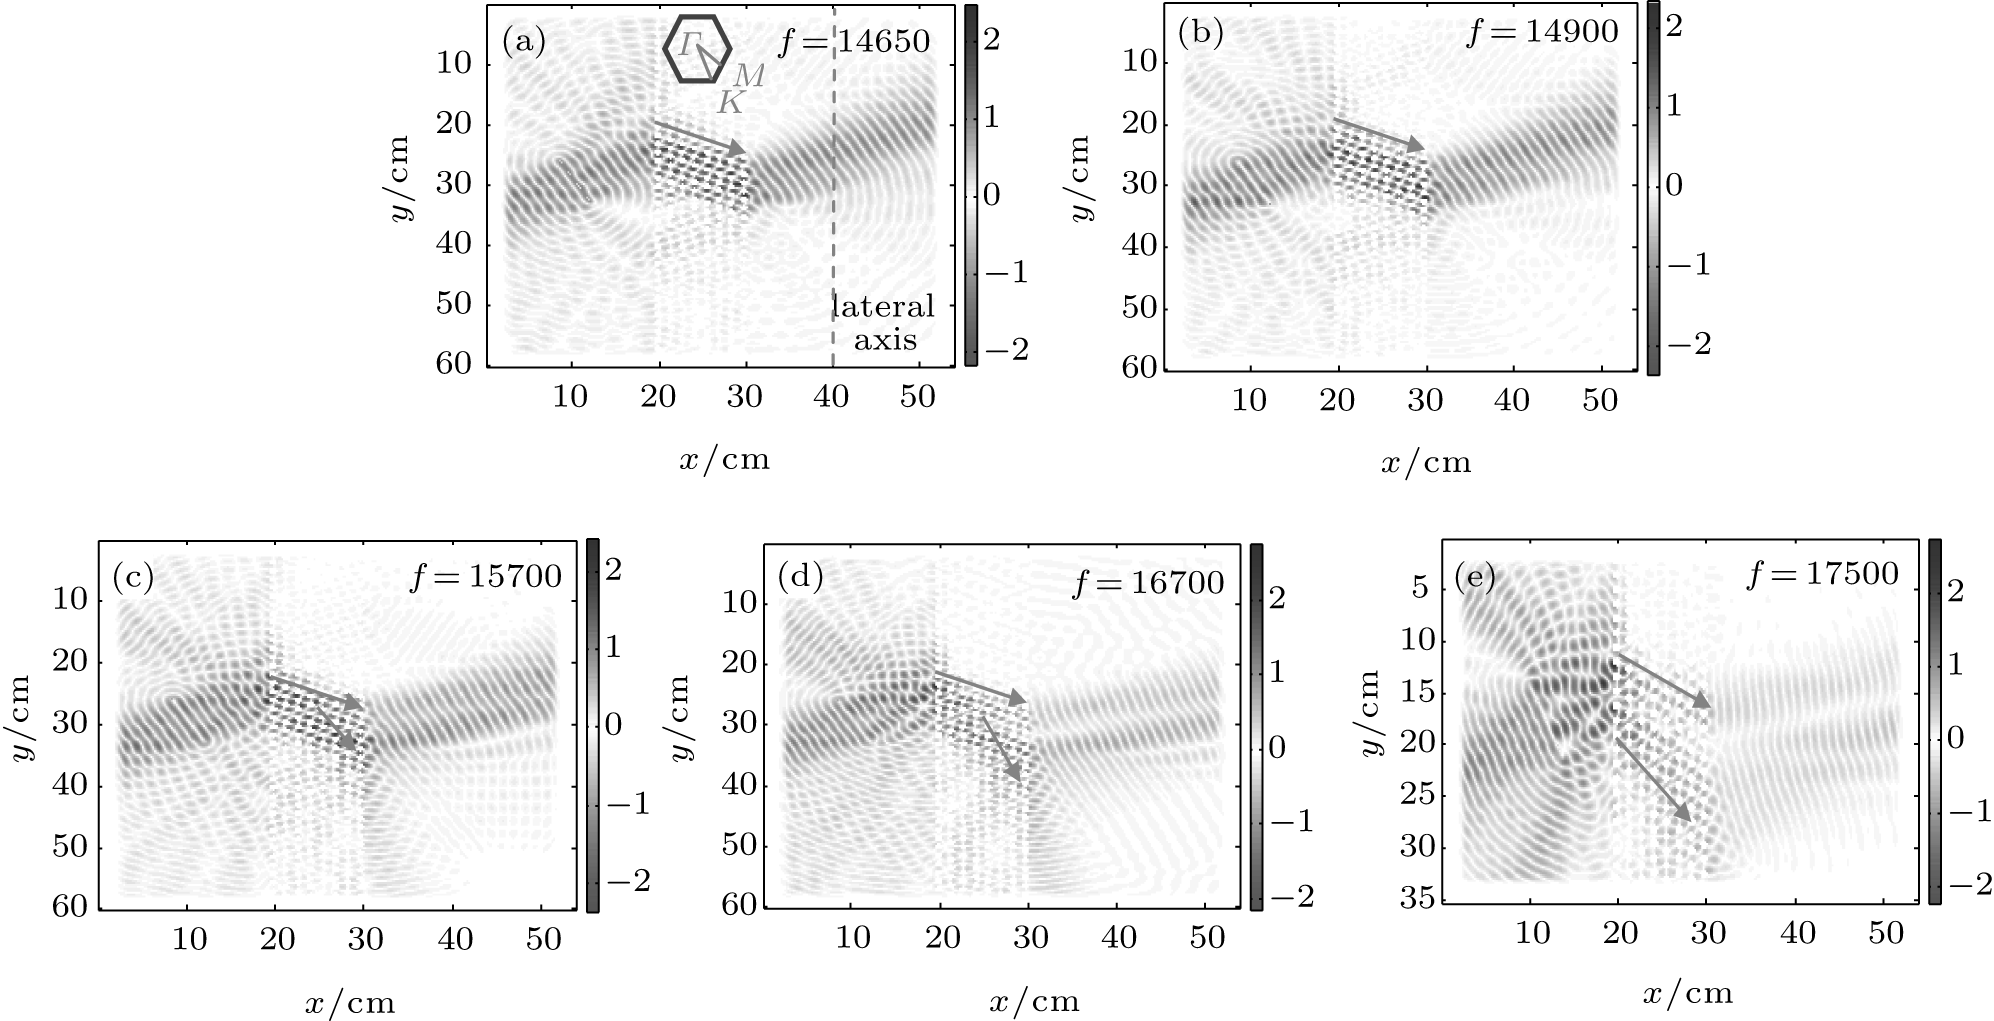 | Fig. 4. Negative refraction patterns obtained for various sampled wave frequencies (partial band gap frequencies: 14650 Hz and 14900 Hz, and second band frequencies: 15700 Hz, 16700Hz, and 17500 Hz). |
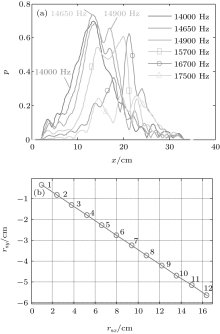
For a better comparison, figure 5(a) shows the distribution of average pressure field amplitudes along the lateral axis. The lateral axis is formed in a range of 10 cm from output interface so that Huygens waves can be completely reconstructed at the output. The simulation results reveal that the frequencies from the partial band gap (14000 Hz, 14650 Hz, 14900 Hz) considerably enhance negative reflection pattern in terms of magnitude and beam formations. Lateral average pressure field distribution patterns are more consistent at the partial band gap frequencies, so that transverse wave guiding process is effective. In the second frequency band (15700 Hz, 16700 Hz, and 17500 Hz), the magnitude and the formation of pressure field pattern are deteriorated because of the disappearing of the directional band gap in Γ K directions.
 | Fig. 5. (a) Average amplitude distributions on the lateral axis for various wave frequencies (partial band gap frequencies: 14000 Hz, 14650 Hz, 14900 Hz, and second band frequencies: 15700 Hz, 16700 Hz, 17500 Hz), (b) shifting vectors rs = (rsx, rsy) for SCs when the number of scatterer arrays increases from 1 to 12 (θ c ≅ 19° at a frequency of 14650 Hz). |
Figure 5(b) shows the change of shifting vector components versus the number of SC arrays, which is calculated by Eq. (5). As the number of arrays in SC increases, the vertical (y) and horizontal (x) components of the shifting vectors grow almost linearly. Figure 6 presents the simulation results illustrating the spatial wavefront shifting patterns for one, two, three, and four scatterer arrays of the SC at a frequency of 14650 Hz. For a single array seen in Figs. 6(a) and 6(b), the waves are scattered and then restored by the same array without guidance. In Figs. 6(c) and 6(d), the input and output arrays perform scattering and restoration processes, respectively; however, there is no notable shifting due to the absence of guidance process. Figures 6(e)– 6(h) demonstrate the complete processes including scattering, guidance, and restoration.
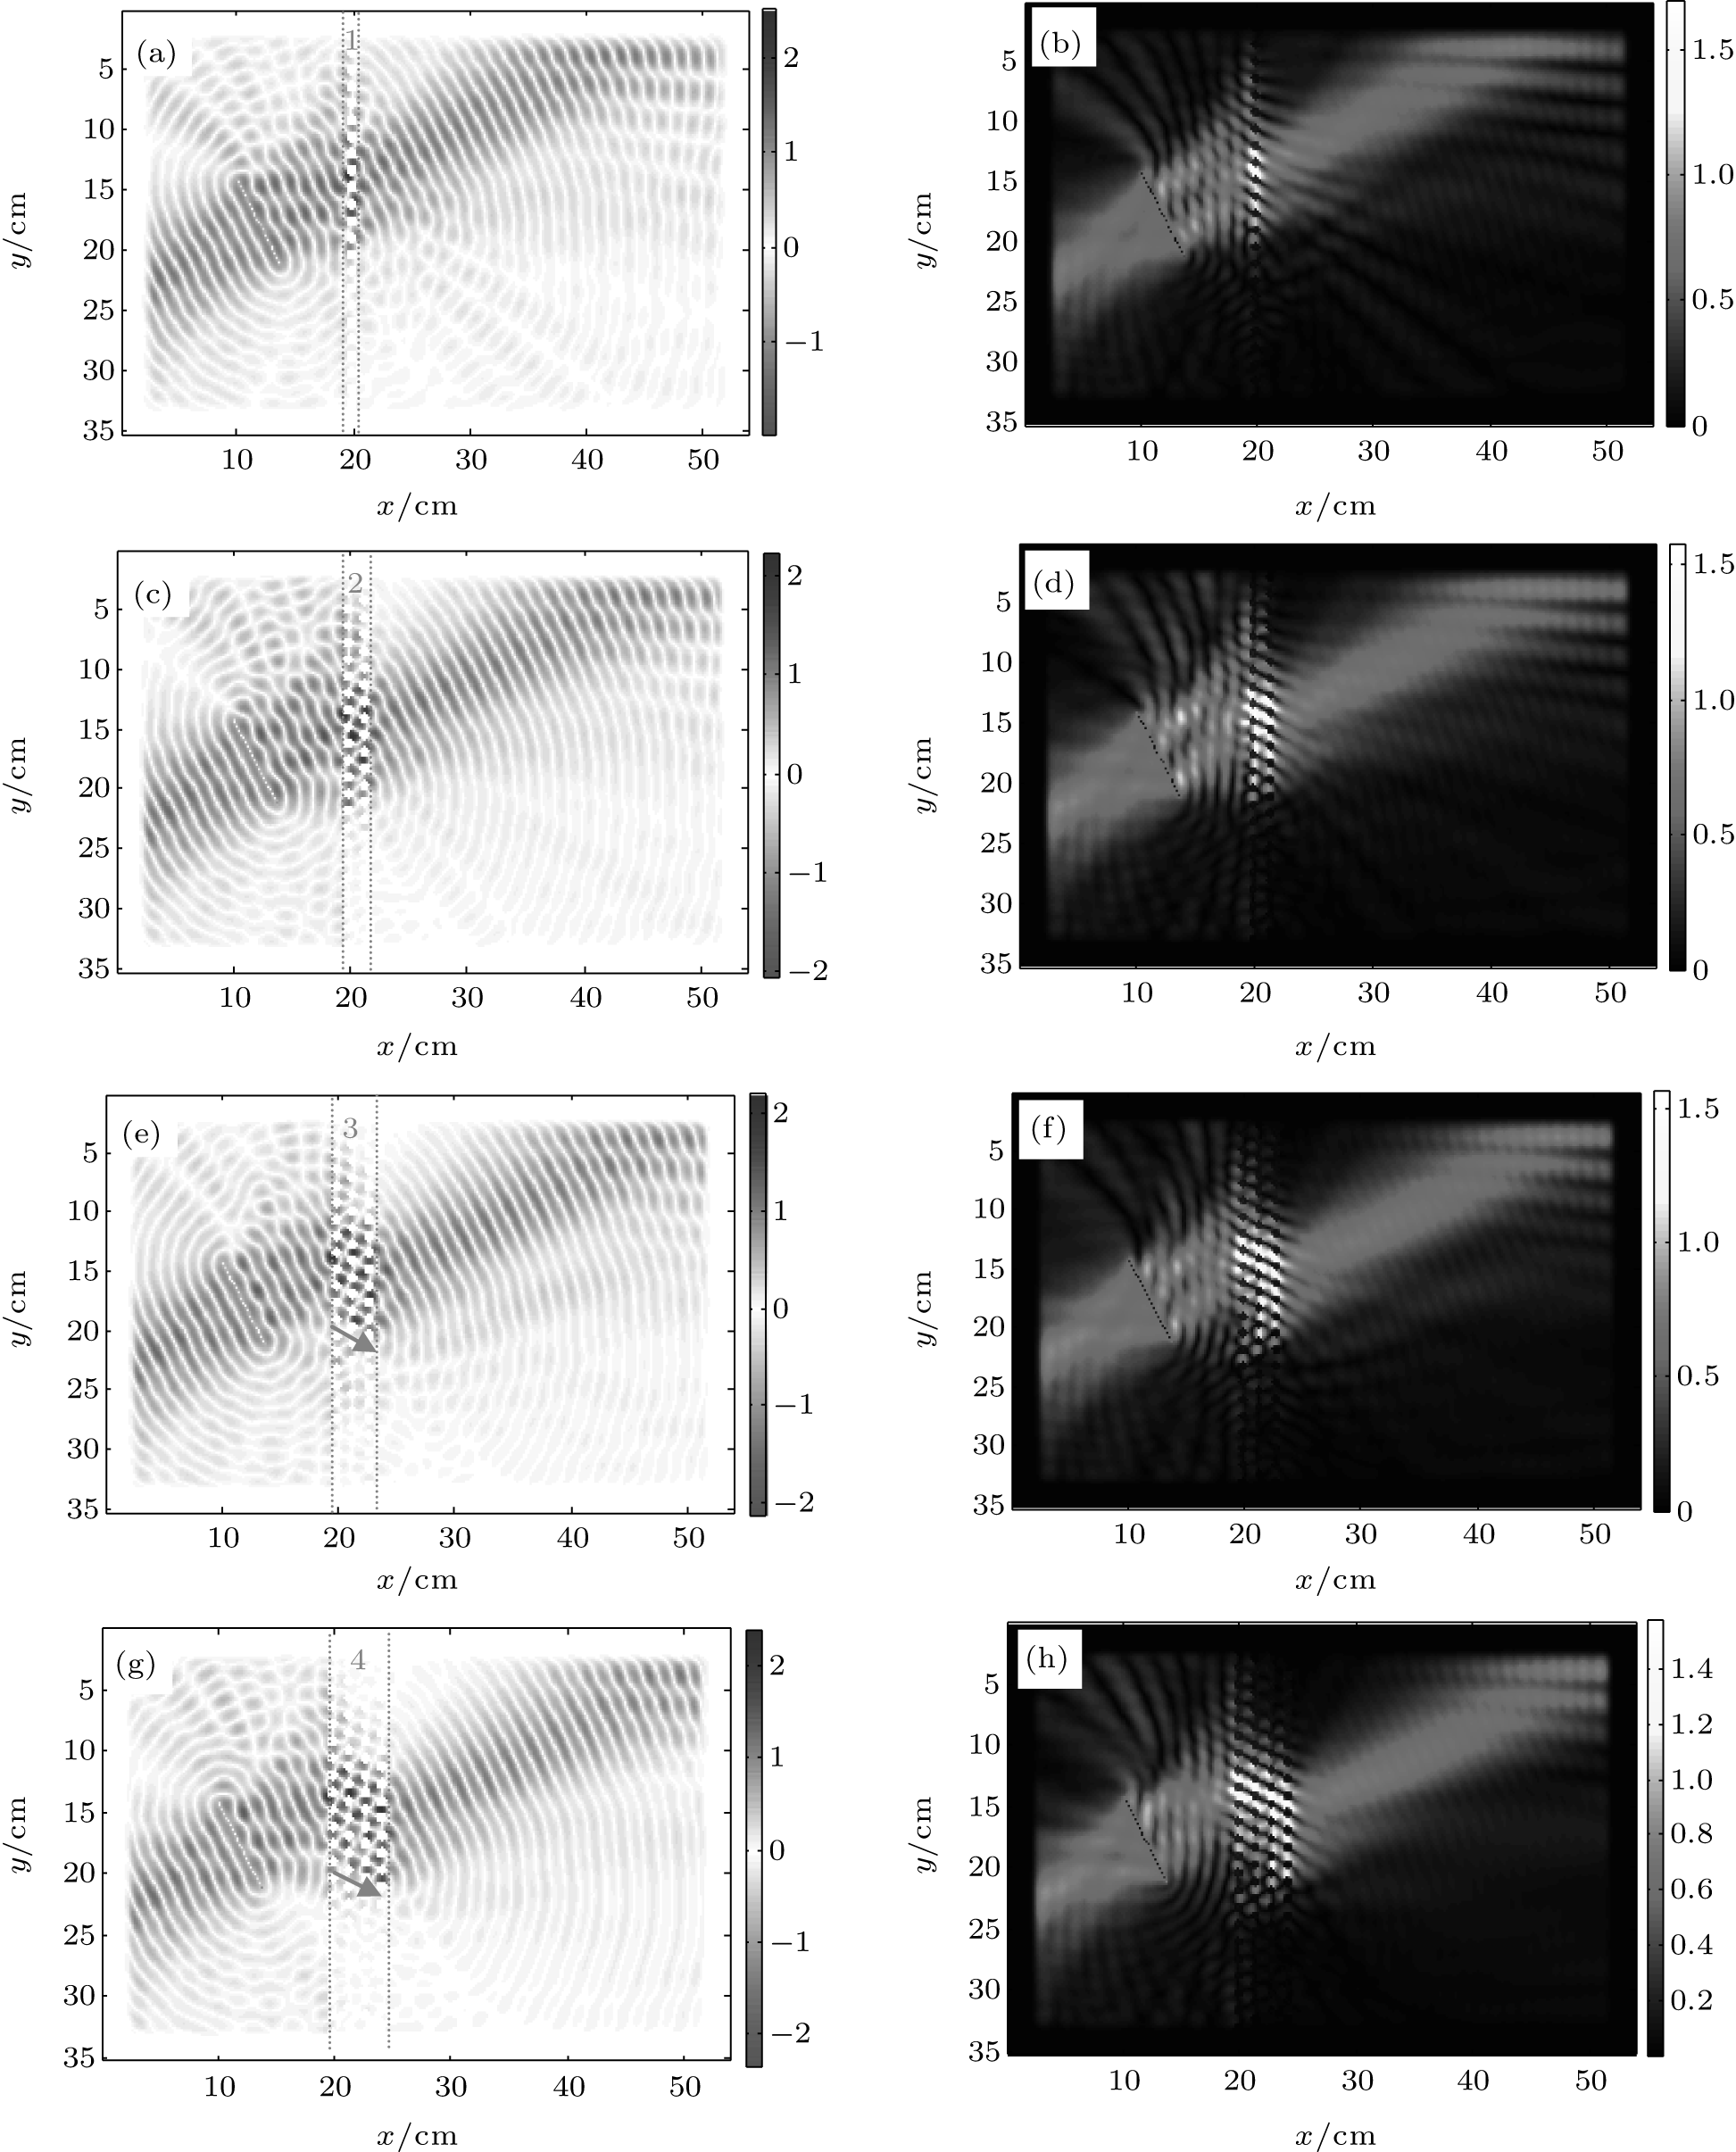 | Fig. 6. Simulation results showing the spatial wavefront shifting for one-, two-, three-, and four-scatterer array SCs at a frequency of 14650 Hz. |
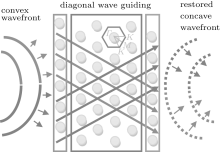
After demonstrating the negative refraction based on diagonal wave guidance in the presence of a partial band gap, this section aims to investigate the effects of this mechanism on the wave focusing properties of the SC flat lens. One can easily see in Fig. 7 that the diagonal wave guidance leads to the inversion of circular wavefront; that is, the convex wavefront (diverging wave envelops) coming to the input interface of SC is restored as concave wavefront (converging envelop) at the output interface.
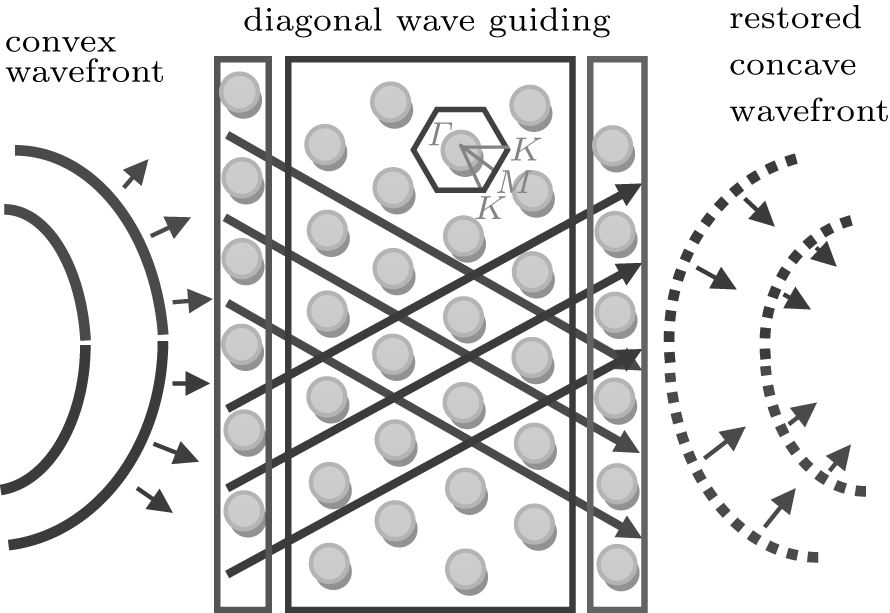 | Fig. 7. Diagonal guidance of scattered wave and convex-to-concave transformation of incident circular wavefronts. |
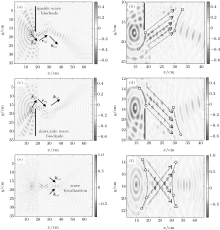
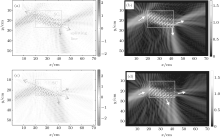
Figures 8 and 9 show the FDTD simulation results of the test SC for circular wavefronts generated by a point source. Firstly, we use an upside blockade for the incident waves to better observe the propagation properties of scattered wave envelopes inside the SC and the restored output waves in Figs. 8(a), 8(b), and 9(a). In a similar manner, a downside wave blockade is also used to observe the downside incident waves in Figs. 8(c), 8(d), and 9(b). Figures 8(e), 8(f), and 9(c) show the wave focalization without any blockades and reveal that wave focalization at the partial band gap frequencies can be considered as a phase coherent combination of upside and downside waves. The combination of upside concave wavefronts and downside concave wavefronts at the output forms complete converging waves and it yields the wave focalization, as demonstrated in Figs. 8(e) and 8(f). The upside of the incident wave (kiu) forms the downside of the focusing wave (kod), and the downside of incident wave (kid) forms the upside of focusing wave (kou). This effect occurs as a result of spatial wavefront shifting in rsd and rsu directions and the convex-to-concave wavefront inversion operation of the SC. It is noteworthy that figure 9(d) shows a focalization pattern that is obtained by arithmetical sum of the average amplitude distribution of the blockaded SC shown in Fig. 9(a) and the average amplitude distribution of the blockaded SC shown in Fig. 9(b). Figure 9(e) shows a close view of the conventional focalization pattern without any wave blockading in Fig. 9(c). The apparent similarity between Figs. 9(d) and 9(e) confirms that the combination of upside and downside output waves forms diverging waves for focusing.
 | Fig. 8. A pressure field image for upside blockade (a) and its close view (b); a pressure field image for downside blockade (c) and its close view (d); a pressure field image for wave focusing by point source (e) and its close view (f), all of which are obtained from the FDTD simulations. |
 | Fig. 9. Distributions of average pressure amplitudes in the cases of (a) upside wave blockading, (b) downside wave blockading, (c) wave focalization (without the blockading). (d) The sum of focalization region amplitudes in panels (a) and (b). (e) A close view of focalization pattern obtained in panel (c). |
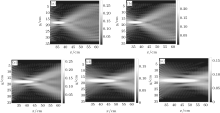
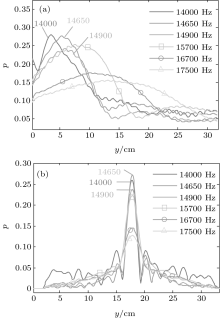
Figure 10 shows the wave focusing patterns obtained for the sampled test frequencies. For the partial band gap frequencies at 14650 Hz and 14900 Hz, the SC produces an intense and narrow focalization region compared with the second band frequencies, which are 15700 Hz, 16700 Hz, and 17500 Hz. Figure 11 shows a comparison of the average pressure field amplitudes along the focal axis (a) and along the lateral axis (b). The peak point of focalization region obtained from partial band gap frequencies is closer to the SC output interface than those from the second band. Although the lateral cross sections of focalization regions do not vary noticeably, the focalization regions of the second band frequencies broaden along focalization axis, causing the peak amplitude in the second band to decrease. Similar effects were also reported by Sanchez– Morcillo et al. for a square lattice SCs[38] and it is indeed an indicator for the divergence of the refraction quality index from the value of one.
 | Fig. 10. Wave focusing patterns at various wave frequencies, partial band gaps frequencies: (a) f = 14650 Hz, (b) f = 14900 Hz, and the second band frequencies: (c) f = 15700 Hz, (d) f = 16700 Hz, and (e) f = 17500 Hz. |
 | Fig. 11. Average pressure field amplitude distributions on focal axis (a) and lateral axis (b) for various wave frequencies (partial band gaps frequencies: 14000 Hz, 14650 Hz, and 14900 Hz, and the second band frequencies: 15700 Hz, 16700 Hz, and 17500 Hz). |
In this section, we discuss some acoustic applications of triangular lattice SCs within the partial band gap.
Optical beam splitters are of great significance in photonic and optic technologies.[39] Similarly, beam splitters, made of SC structures, were reported for acoustic waves. The wave splitting effect is obtained by using several methods, such as defect states, [40] orthogonal self-collimation paths of square lattice, [41] directional band gaps.[42] Cicek et al. benefited from the directional band gaps in order to split the emission from a point source inside the triangular lattice SC.[42] These wave-splitting methods are practically effective for point source emission and the beam splitting takes place inside the crystal structure. However, partial band gaps also enable the implementation of SC acoustic wave splitters, which is based on the exploitation of output interface geometry of SC slabs. When the angle of output interface normal is discriminated via a slab corner, this leads to the restoration of output waves with respect to different angles and therefore results in splitting of wavefronts at the slab corners. This method can work effectively for splitting plane waves and, in contrast to other methods, the wavefront splitting takes place at the output interface of the SC. Moreover, the geometrical structure of output interface can be designed to obtain the desired wavefront splitting effects.
Figure 12 shows the simulation results obtained for wavefront splitting via the SC slab corner. Diagonally guided scattered waves encounter with orthogonal output interfaces at the slab corner. In such a case, Huygens waves are constructed as two distinct wavefronts. The propagation directions of output waves are separated according to the corner angle. The splitting position of the wavefront can be adjusted by shifting the source location up or down with respect to position of the splitting line, as shown in Fig. 12.
 | Fig. 12. SC slab corner beam splitting at a frequency of 14650 Hz. |
Research on standalone SC structures has been reported for many useful acoustic devices.[1, 6, 7, 11, 42, 43] However, sophisticated acoustic functions to perform more advanced tasks are made possible by a large scale integration of standalone acoustic structures. For instance, underpinning technologies with their potential applications in communication and acoustic imaging were found to be useful for integrating the micro-phononic crystal devices.[44]
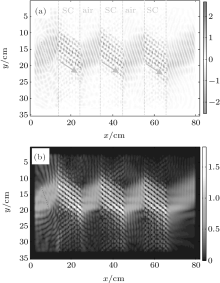
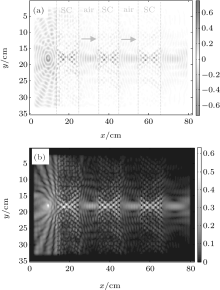
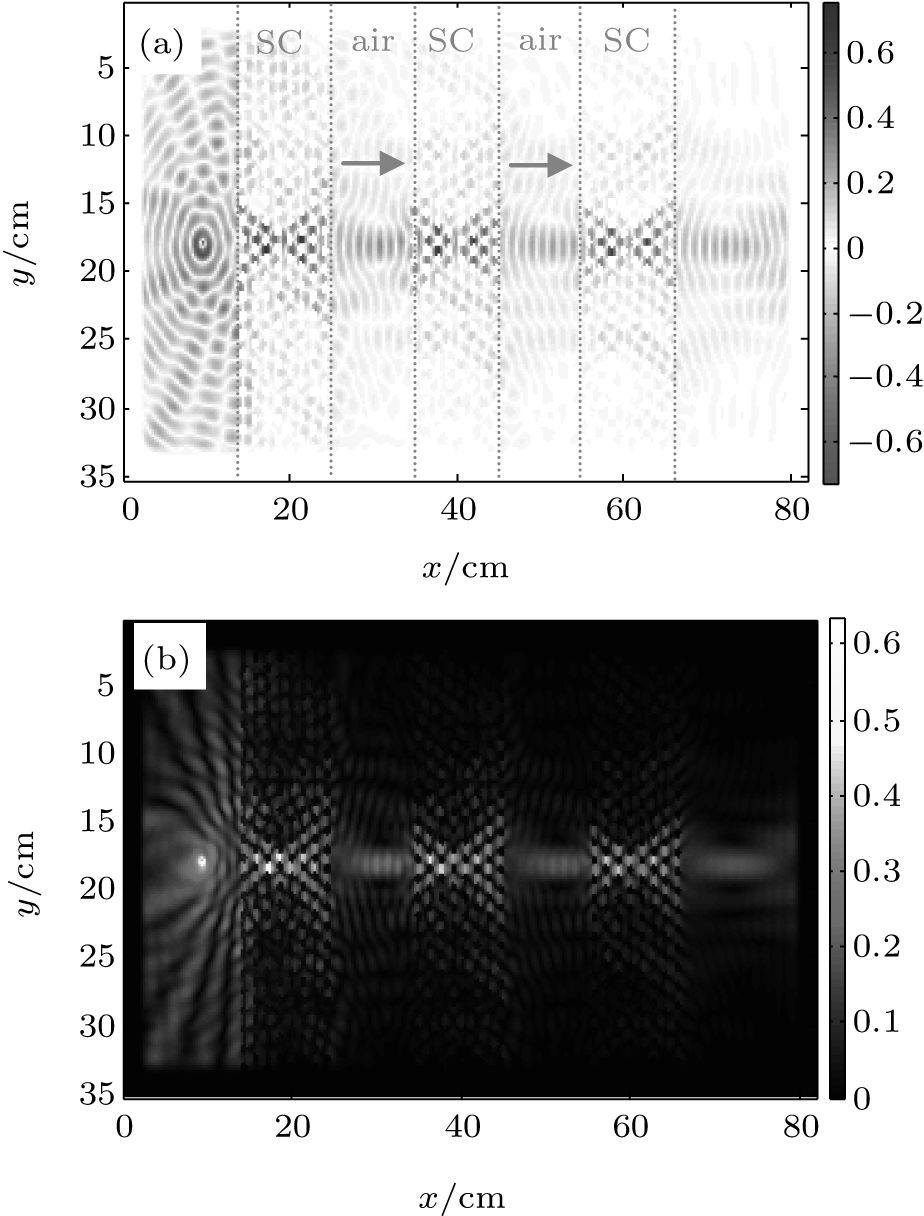
Complex acoustic systems require fundamental wavefront control and shaping components. In fact, the partial band gaps of SCs promise opportunities for implementing the propagation control and wavefront shaping components. Here, we illustrated FDTD simulation results for an SC– air multilayer acoustic system consisting of the cascaded SC slab sequence. Figure 13 shows the quality of refraction patterns after multiple negative refractions by cascaded SC slabs at a frequency of 14650 Hz. It is apparent that the negative refraction pattern is transferred all through the sonic crystal slab sequences. Wavefronts are spatially shifted three times by a shifting vector rs = (10.8, − 3.9) in this example.
 | Fig. 13. Spatial wavefront shiftings by multiple negative refractions of cascaded sonic crystals at a frequency of 14650 Hz. |
The wave focusing sequence, which is generated by the SC– air multilayer acoustic system at the frequency of 14650 Hz, is shown in Fig. 14. The virtual images of the point source are copied along the radial axis throughout subsequent cascaded SC slabs. This system can be useful for the harvesting or the transmitting of focalized acoustic energy.
 | Fig. 14. Waves focused by cascaded sonic crystals at a frequency of 14650 Hz. |
The majority of studies discussed the AANR for the negative refraction and wave focusing effects by SC within the second band. There are a few studies relating to the negative refraction, which address the acoustic wave transmission mechanisms appearing at the partial band gaps. In this study, we demonstrate acoustic wave conduction mechanisms taking effect in the case of a partial band gap in Γ K direction for the triangular lattice SC with r/a ≅ 0.3. It is observed in numerical analyses that this partial band gap ensures a strong diagonal guidance of coupled scattered wave envelopes inside the triangular lattice SC and finally the last scatter array restores the output waves on the basis of the Huygens’ principle. This mechanism enables most of the incident wave energy to be conveyed between rigid circular scatterers in transverse directions. Thus, a clear negative refraction pattern without birefraction can be achieved at the partial band gap frequencies. Some remarks about this study can be summarized as follows.
i) The wave transmission mechanism of SC can be explained on the basis of three essential processes: wave scattering process (the first array of SC), wave guiding process (arrays between the first and the last arrays), and wave restoration process (the last array of SC).
ii) A clear negative refraction pattern for plane waves and enhanced focalization for point sources are obtained by using the partial band gap in Γ K direction.
iii) The guided negative refraction accomplishes two basic wavefront operations: spatial wavefront shifting (expressed by Eq. (7)) and convex-to-concave wavefront inversion.
iv) Wavefront splitting and multilayered SC acoustic system applications are illustrated.
The authors thank the Inonu University Research Projects Coordination Unit for their support.
| 1 |
|
| 2 |
|
| 3 |
|
| 4 |
|
| 5 |
|
| 6 |
|
| 7 |
|
| 8 |
|
| 9 |
|
| 10 |
|
| 11 |
|
| 12 |
|
| 13 |
|
| 14 |
|
| 15 |
|
| 16 |
|
| 17 |
|
| 18 |
|
| 19 |
|
| 20 |
|
| 21 |
|
| 22 |
|
| 23 |
|
| 24 |
|
| 25 |
|
| 26 |
|
| 27 |
|
| 28 |
|
| 29 |
|
| 30 |
|
| 31 |
|
| 32 |
|
| 33 |
|
| 34 |
|
| 35 |
|
| 36 |
|
| 37 |
|
| 38 |
|
| 39 |
|
| 40 |
|
| 41 |
|
| 42 |
|
| 43 |
|
| 44 |
|