

Identification of isomers and control of ionization and dissociation processes using dual-mass-spectrometer scheme and genetic algorithm optimization*
[Chen Zhou, Qiu-Nan Tong, Zhang Cong-Cong, Hu Zhan† ]
]
]
|
|


†Corresponding author. E-mail: huzhan@jlu.edu.cn
*Project supported by the National Basic Research Program of China (Grant No. 2013CB922200) and the National Natural Science Foundation of China (Grant No. 11374124).
Identification of acetone and its two isomers, and the control of their ionization and dissociation processes are performed using a dual-mass-spectrometer scheme. The scheme employs two sets of time of flight mass spectrometers to simultaneously acquire the mass spectra of two different molecules under the irradiation of identically shaped femtosecond laser pulses. The optimal laser pulses are found using closed-loop learning method based on a genetic algorithm. Compared with the mass spectra of the two isomers that are obtained with the transform limited pulse, those obtained under the irradiation of the optimal laser pulse show large differences and the various reaction pathways of the two molecules are selectively controlled. The experimental results demonstrate that the scheme is quite effective and useful in studies of two molecules having common mass peaks, which makes a traditional single mass spectrometer unfeasible.
Coherent control (quantum control), in which a molecule system is steered towards the desired direction by manipulating its interaction with a laser field, has received widespread attention since it was proposed conceptually in the 1980s.[1– 3] A variety of coherent control studies on ionization, [4] selective fragmentation, [5] population transfer, [6] isomerization, [7] impulsive stimulated Raman scattering (ISRS), [8] and high-harmonic generation, [9] have been conducted. Initially, coherent control strategy was used to solve the problem of simple systems, such as atoms or diatomic molecules. Optimal control was achieved by changing one or a few of the parameters of the laser field in time and frequency domain, such as intensity, [10] wavelength, [11] spectral bandwidth, [12] pulse duration, [13] and temporal envelope.[14] However, for most molecular systems, which have more complex structures, it is hard to predict the optimal laser field that can guide the system towards the particular target because the system Hamiltonian is usually not known well enough or is even unknown. Thus, a closed loop control scheme using learning algorithms was proposed by Judson and Rabitz, [15] and Warren et al.[16] The adaptive feedback control method enables the experimental system itself to find the tailored laser pulse, which maximizes a pre-designed target value.[17– 19] Various methods have been developed to better decipher the optimal control mechanism by automatically finding the pulse train. For example, control pulse cleaning can be used to exclude extraneous pulse structures, [18, 20] and a few-parameter spectral phase modulation can be used to narrow the searching space.[21, 22]
As an object of coherent control study, the molecular families, such as the homologous molecule series and isomers, have received special interest recently. This is due to the similarity in the structures of these molecules, which challenges scientists to distinguish them, as well as to control the reaction from one molecule to another. For example, Tachiya et al. investigated the different behaviors in the ionization processes of a series of methyl halide molecules, by using two-colored femtosecond laser fields with a controlled phase between them.[23] Li and Bruder proposed theoretically that a series of different polarized femtosecond laser pulses may be used to distinguish the left- and right-handed chiral molecules.[24] Cardoza et al. studied the fragmentation mechanisms of a series of molecules with an acetone structure in which H atoms in one methyl radical are substituted by different atoms.[25] Learning control is used to maximize the yield ratio of the substituted to the un-substituted methyl radical, of each molecule. Cruz et al. found the most different fingerprints of two xylene isomers, under the irradiation of shaped femtosecond laser pulses, by the method of binary phase shaping (BPS) space mapping.[26] These molecules yield practically identical mass spectrum (MS) when a transform limited (TL) laser pulse is used. In order to increase the degree of identification or control over similar molecules, two aspects should be considered. Firstly, one needs to simultaneously change many parameters of the laser field, such as the relative position, intensity, and phase of each sub-pulse in a femtosecond pulse train. In order to find the solution with higher quality, the search space of the phase on a femtosecond laser spectrum should be selected to be as large as possible; hence, there will be more varieties of laser pulse shapes. Secondly, even in a few studies in which the closed loop learning method was used, the optimal control was only used on one molecule in the molecular family, in one optimal experiment. However, the pulse shape found after one run of the experiment can only be used to control the reaction dynamics of that molecule. An optimal pulse shape that can simultaneously control the reaction pathways of the two different molecules needs to be found if the goal is to distinguish or control these similar molecules.
In this paper, we report a dual-mass-spectrometer scheme in which the mass spectra of two different isomeric molecules from two spectrometers but under the irradiation of the same shaped pulses are obtained synchronously. Closed loop learning method is used to maximize the yield ratio of the two ions from two spectrometers. The goal is to investigate the optimal control of ionization, dissociation and isomeric identification in acetone and two of its isomers, i.e., propylene oxide and propionaldehyde.
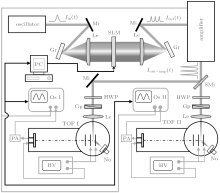
The experimental setup in the present study is shown schematically in Fig. 1. It consists of a laser system, a pulse shaping setup, two sets of time of flight (TOF) mass spectrometers (denoted as TOF I and TOF II), two molecular beam systems, two detection systems, and a computer control system with a genetic algorithm (GA)[27] program. The femtosecond laser pulses are generated by an oscillator (Spectra-Physics Tsunami), and are amplified by a Ti:sapphire regenerative chirp-pulse amplification laser (Spectra-Physics Spitfire amplifier) with a central wavelength of 800 nm, a pulse duration (FWHM) of 90 fs, and a repetition rate of 1000 Hz. Pulse shaping is performed in between the oscillator and the amplifier. The final laser beam is split into two identical beams by a semipermeable mirror, after which they are focused respectively by two identical lenses, each with a focal length of 225 mm, into the vacuum chambers of the two sets of TOF mass spectrometers. The intensities of the laser beam at the focal spot where it interacts with the molecular beam are about 1.3 × 10¹³ W/cm2 for the isomeric identification experiment and 3.0 × 10¹³ W/cm2 for the ionization and dissociation control experiment. A half-wave plate and a Glan prism are placed in front of each lens to adjust the laser intensity. The samples are acetone (Beijing Chemical Works, purity 99.5%), propylene oxide (Sinopharm Chemical Reagent Co, Ltd, purity 99%), and propionaldehyde (Tianjin Guangfu Fine Chemical Research Institute, purity 98%). In each mass spectrometer, the produced ions in the femtosecond laser field are collected by a dual micro-channel plate (MCP) detector at the end of the flight tube. The detected signal is amplified by a preamplifier (ORTEC VT120A) and then sent to an oscilloscope (Tektronix TDS 3054C). In order to clearly show the intensity of each peak in the mass spectrum, in the current paper the mass spectra are presented as bar diagram, in which the height of each bar corresponds to the integrated intensity of each mass peak. The processes in the two TOF mass spectrometers are identical and are fully synchronized. The mass spectrum signals from the isomers in the two TOF mass spectrometers are transmitted to a computer synchronously, serving as a closed-loop feedback signal, which is called “ fitness” . In the present study, the fitness is defined as the intensity ratio of a mass peak from one TOF mass spectrometer to that from the other TOF mass spectrometer. This means that the two sets of TOF mass spectrometers do not need to be completely identical because the ratio of mass peak yields rather than the absolute values are used as fitness.
 | Fig. 1. Schematic diagram of the experimental setup. The pulse shaping setup is placed between oscillator and amplifier, which includes lens (Le), grating (Gr), mirror (Mi), and SLM. The shaped pulse from the amplifier is split into two identical beams by a semipermeable mirror (SMi). Two identical lenses focus respectively the two laser beams into vacuum chambers of the two sets of TOF mass spectrometers. A half-wave plate (HWP) and a Glan prism (GP) are placed in front of each lens for adjusting the laser intensity. The gas handling, and ion detection system for each TOF mass spectrometer include a nozzle (NO) and a microchannel plate (MCP). The electronic devices include two oscilloscopes (OSs), two preamplifiers (PAs), two high voltage supplies (HVs), and a computer (PC). |
The pulse shaping setup in the present work is similar to that used in our previous work.[28] It consists of a spatial light modulator (SLM, CRI, SLM-640-D-VN), two gratings (2000 grooves/mm), and two lenses (focal length f = 300 mm) arranged in a 4-f setup.[29] The laser spectrum is dispersed by the first pair of grating and lens onto the spatial light modulator, where each spectral component is modulated differently according to the phase pattern on the spatial light modulator. Then, all of the spectral components are recollimated again into a shaped pulse. The multiphoton intrapulse interference phase scan (MIIPS)[30– 32] method is used to ensure that the pulse without any phase modulation (constant phase as a function of wavelength) is transform-limited, and hence the pulse shapes with phase modulation are accurate and the reproducibility of the result is ensured. In the GA optimization process, an initial population of 46 individuals (46 different spectrum phase patterns) is generated randomly. Two mass spectra are obtained for each individual, and the fitness is calculated. All of the 46 fitnesses are evaluated and used to generate the next generation’ s 46 individuals. This process keeps going iteratively until an optimal solution is obtained. In order to reduce the phase searching space in the closed-loop control experiment, a sine phase function shown in the following equation:

instead of the random phase is loaded onto the SLM, which generates a train of equally spaced pulses.
In the above equation, ψ (m) is the phase loaded onto the pixel m of SLM, and m0 is the central pixel number. The number of sub-pulses in the train is controlled by parameter A. The spacing between them is controlled by parameter T, and ϕ represents a constant phase offset.[33] For our present pulse shaping setup, the relationship between spacing and T is given by

For example, a T value of 91 roughly gives a sub-pulse spacing of 200 fs.
In order to identify different molecules, their spectra need to be different under the irradiation of the same laser field. In the mass spectra of isomers, there usually exist common peaks with the same mass-to-charge ratio (m/z). With GA, it is impossible to find the pulse shape that can maximize the yield ratio of these peaks using just one spectrometer because they overlap in the spectrum, if one uses the mixture of the two molecules as the sample. The peaks of the parent ions are the common ones that can be observed in the isomers’ spectra. As seen in Fig. 2, in the mass spectra of the two isomers under the irradiation of the TL laser pulse and optimal laser pulse, they all show a prominent peak at the parent ion position, i.e., m/z = 58. The optimal pulse shape is obtained from the GA iterative optimization process, in which the fitness is defined as the parent ion integrated intensity ratio of propylene oxide in TOF I to acetone in TOF II, irradiated by the pulses with the same shape. Figures 2(a) and 2(b) show that bar diagrams of the mass spectra of propylene oxide, figures 2(c) and 2(d) show those of acetone; figures 2(a) and 2(c) are obtained using TL laser pulse, and figures 2(b) and 2(d) are obtained using optimal laser pulse. In order to clearly show the change of the integrated intensity after optimization, for each molecule the mass spectrum peaks are normalized to the parent ion intensity obtained using a TL laser pulse. All of the intensities of other peaks, including the spectra from TL pulse and optimal pulse, are relative to this peak. The relative yield of propylene oxide’ s parent ion is increased by 160% using an optimal pulse, and a considerable increase of other fragments’ intensities is also observed compared with those from the MS obtained using TL laser pulse. The yield of acetone’ s parent ion under the irradiation of optimal pulse is almost unchanged compared with that under the irradiation of TL pulse, while the intensities of fragments increase slightly.
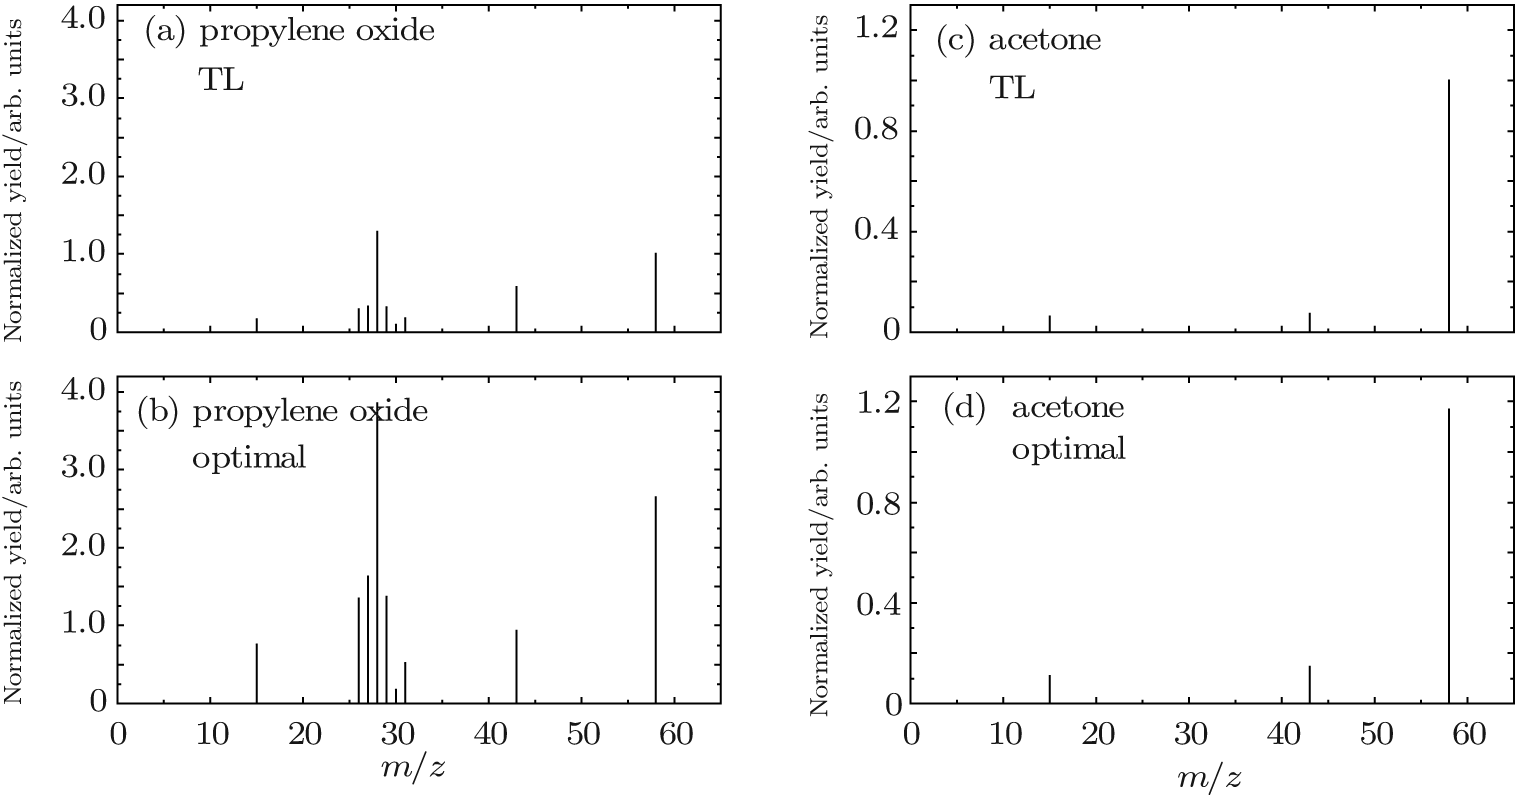 | Fig. 2. Bar diagrams of the mass spectra of propylene oxide and acetone under the irradiation of the TL and optimal laser pulse. Panels (a) and (b) show the mass spectra of propylene oxide corresponding to the TL and optimal laser pulse, respectively. Panels (c) and (d) display the mass spectra of acetone corresponding to the TL and optimal laser pulse, respectively. For each molecule, all of the peaks in the two spectra are normalized so that the integrated intensity of the parent ion with TL laser pulse equals unity. |
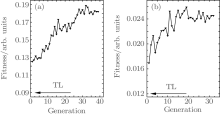
The fitness as a function of iterative generation is shown in Fig. 3(a), which increases from about 0.12 at the first generation to about 0.18 after the 39th generation. The fitness from TL laser pulse is only 0.09. The increased yield of propylene oxide’ s parent ion is mainly responsible for the increased fitness under the irradiation of optimal pulse because the yield of acetone does not change much. After the 39th generation of the GA optimization, the sine phase function parameters A, T and ϕ obtained are 0.88, 90.78, and − 2.98, respectively, which corresponds to a train of three equally spaced pulses and the separation between adjacent sub-pulses is 201 fs.
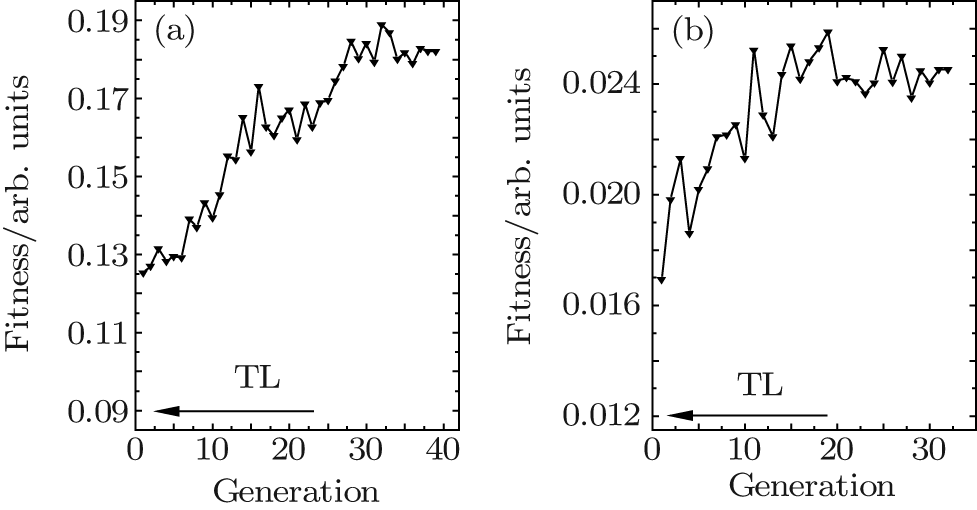 | Fig. 3. (a) Fitness (yield ratio between propylene oxide and acetone at m/z = 58) as a function of generation; (b) Fitness (yield ratio between acetone at m/z = 43 and propionaldehyde at m/z = 58) as a function of generation. The arrows indicate the corresponding fitnesses obtained with TL laser pulse. |
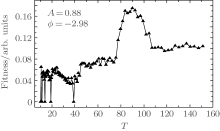
In order to testify the correctness of the GA optimization result from the dual mass spectrometer scheme, an open loop scan of the T value in sine phase function is performed, with the other two parameters fixed at the values obtained from GA optimization, A = 0.88 and ϕ = − 2.98. The T value is scanned from 10.25 to 151.23, which corresponds to sub-pulse separation from 1.78 ps to 121 fs. When calculating the fitness, if any one of the peak intensities is too small, the fitness will be set to be zero in order to exclude the influence of noise. As shown in Fig. 4, when T is in a range from 10.25 to 75.75, the fitness is small and increases slowly with the increase of T. A broad peak appears between T = 75.75 and 107.03, with the highest point at T = 90.03 and correspondingly the highest value of the peak is 0.17. The T scan result is consistent with the GA optimization result, and demonstrates that the combined method of GA optimization and dual spectrometer scheme is reliable. At even larger T values, the fitness is also small and increases slowly with the increase of T.
 | Fig. 4. Fitness as a function of parameter T in sine phase function, and the other two parameters are fixed at A = 0.88, and ϕ = − 2.98. |
In the GA run to increase the difference between the two mass spectra, we choose the fitness to be the yield ratio of two peaks in the two spectra. In principle, the two mass spectra can be readily identified even if only this one peak is different. However, to better describe the degree of the difference between the two whole mass spectra, we introduce a parameter called difference degree γ . This parameter can also be used as the fitness in the GA optimization process. For isomeric identification, the structures of the mass spectra, but not their absolute intensities, are important. Therefore, the expression of γ can be written as

in which P1i and P2i are the normalized relative yield of the i ion peak, from mass spectra obtained using TOF I and TOF II, respectively; and, N is the number of the ion peaks selected to calculate γ . If the yields of the same peak from both spectra are very small, then the peak will not be included in the calculation. From Eq. (3), we can see that the value of γ is in a range from 0 to 1. When the mass spectra of two isomers are completely the same, γ = 0. A value of 1 means that the two spectra are completely different; i.e., if a certain peak appears in one spectrum, it will not appear in the other spectrum. A larger value of γ indicates a larger difference between two mass spectra. In the present study, the goal is to increase the difference between the mass spectra; i.e., to increase the value of γ . For example, we calculate the values of γ for the mass spectra shown in Fig. 2 obtained with TL laser pulse and optimal laser pulse. In the calculation, common peaks of m/z = 15, 43, and 58 are included. The degree of difference γ between the mass spectra of propylene oxide and acetone increases from 0.41 using TL laser pulse to 0.62 using optimal laser pulse.
In other attempts, we increase the difference between the mass spectra of propylene oxide and acetone by increasing the yield ratio of same ion peak at m/z = 15 or 43, and that between the mass spectra of propylene oxide and propionaldehyde by increasing the yields ratio of same ion peak at m/z= 29 or 43. The corresponding fitness and difference degrees γ are shown in Table 1 for transform limited laser pulse and optimal laser pulse.
| Table 1. Values of fitness (yield ratio of the ion peak with same m/z) and difference degree γ in two acetone isomers for TL pulse and optimal pulse. |
In a mixture of different molecules one might want to selectively control their reactions in order to obtain the products only from specific molecule, to remove unwanted molecule, etc. When optimizing the yield ratio between two peaks from two different molecules with different mass-to-charge ratios, if one of the two peaks also exists in the other molecule’ s spectrum, then one cannot use a single spectrometer to run the GA process because it is impossible to obtain the correct yield from an overlapped peak.
We first look at the optimization of dissociation process of acetone in the ionization process of propionaldehyde. The fitness is defined as the integrated intensity ratio of acetone fragment ion at m/z = 43 from MS using TOF I to propionaldehyde’ s parent ion at m/z = 58 from MS using TOF II. There has been much research work on the ionization and dissociation dynamics of acetone under the irradiation of an laser field.[34– 37] The ion peak at m/z = 43 in acetone MS corresponds to the acetyl fragment ion. Under our laser field condition, the dominant channel yielding the acetyl fragment ion is for the dissociation of parent ion by breaking the C– C bond between acetyl fragment ion and methyl radical, [34, 35] which is the process of ionization followed by dissociation (ID).[38, 39] Other channels are also possible, e.g., acetyl radical is first produced by dissociation, and then ionized to produce acetyl fragment ion, [36, 37] which is the process of dissociation followed by ionization (DI).[38, 39] The purpose of the current GA optimization is to find a shaped femtosecond laser pulse such that it favors the channels yielding acetyl fragment ion and suppresses the channels yielding the propionaldehyde’ s parent ion. The bar diagrams of mass spectra of acetone and propionaldehyde are shown in Fig. 5, in which figures 5(a) and 5(b) show the mass spectra of acetone and figures 5(c) and 5(d) display the mass spectra of propionaldehyde; and, figures 5(a) and 5(c) are obtained using TL laser pulses, figures 5(b) and 5(d) are obtained using optimal laser pulses. Using the same method as that in Subsection 3.1, the mass spectra of each molecule are normalized to the intensity of its parent ion obtained using TL laser pulse. Under the irradiation of the optimal laser pulse, the yield of the m/z = 43 fragment from acetone molecule is increased by 120% in comparison with that obtained from TL pulse. The yields of other fragment ions also increase; however, the yield of acetone’ s parent ion is almost unchanged. A similar change of the yield of fragment ions to that of parent ions is also observed for propionaldehyde molecule but with a more obvious increase of the fragmentation. The fitness as a function of generation is shown in Fig. 3(b). The fitness, which is only 0.012 with TL laser pulse, increases to 0.025 after the 32th generation. The increase of yield of acetone’ s fragment at m/z = 43 is responsible for the increase of fitness.
In other runs of the GA optimization, we choose different combinations of ions from two molecules and try to selectively control the channels forming these products. For example, the ion peak at m/z = 15 in acetone mass spectrum corresponds to methyl fragment ion 
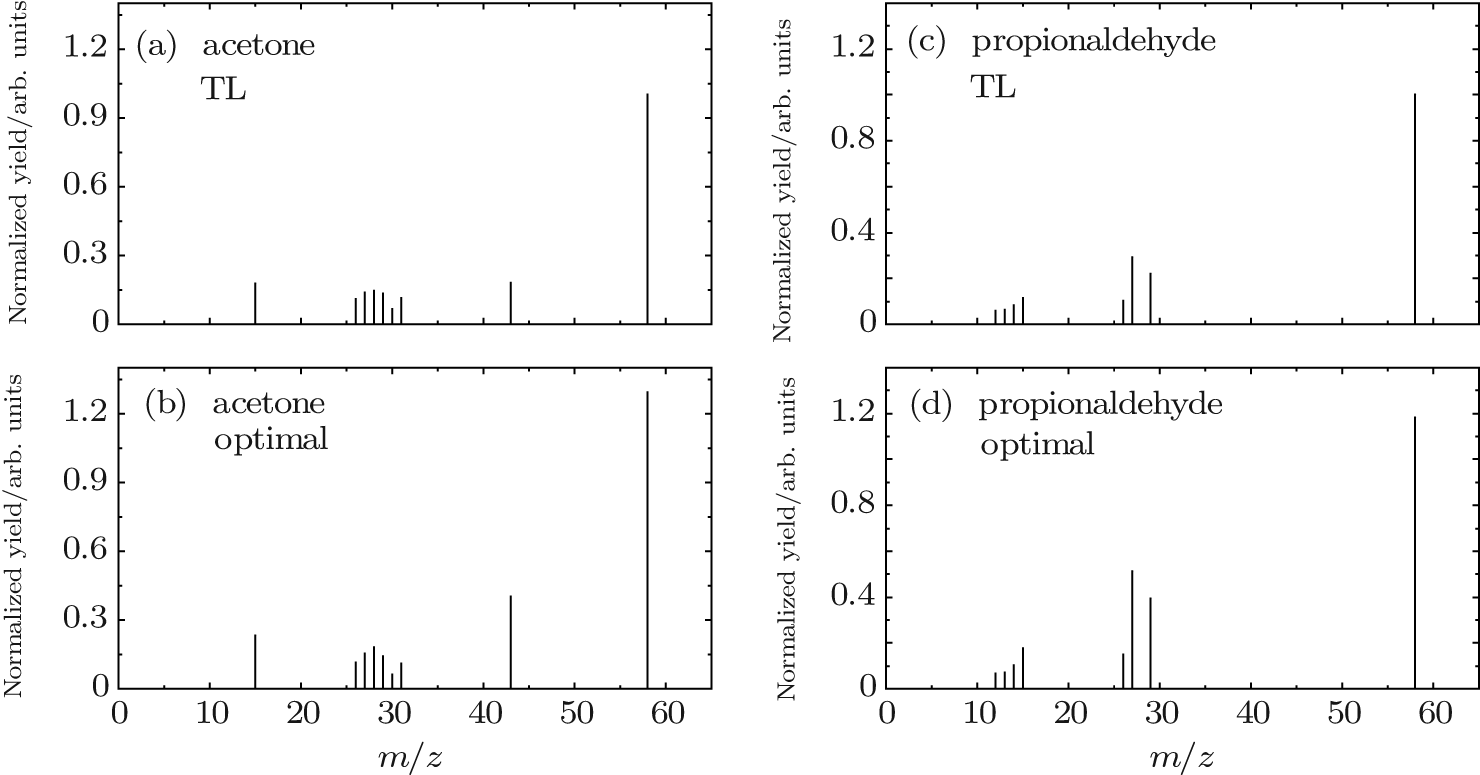 | Fig. 5. Bar diagrams of the mass spectra of acetone and propionaldehyde under the irradiation of the TL and optimal laser pulse. Panels (a) and (b) show the mass spectra of acetone, corresponding to the TL and optimal laser pulse, respectively. Panels (c) and (d) display the mass spectra of propionaldehyde corresponding to the TL and optimal laser pulse, respectively. For each molecule, all of the peaks in the two spectra are normalized so that the integrated intensity of the parent ion with TL laser pulse equals unity. |
| Table 2. Values of yield ratios of ion peaks with different m/z in two acetone isomers. |
In Subsections 3.1 and 3.2, we have used the dual mass spectrometer scheme, together with GA optimization of shaped femtosecond laser pulses, to identify isomers or to control the reaction of different molecules. In this subsection, we will discuss the main advantages of this scheme over the traditional single spectrometer scheme.
When one works with two or more molecules at the same time it is possible that some of the peaks in their mass spectra overlap with each other. This is especially true when these molecules are isomers or can be considered to be within a molecular family. Sometimes, all of peaks, and even their intensity distributions, are the same for different isomers, under the irradiation of the transform limited single pulse. In order to search for the shaped femtosecond pulse shape that can distinguish different isomers, the mass spectra of the isomers under the irradiation of same laser fields need to be compared with each other. There are different ways to do this. One way is to scan the parameter of femtosecond laser field and check the difference between the spectra of different isomers at each laser field parameter; i.e., doing an open loop study. The identification of xylene isomer molecules has been studied, [26, 40, 41] which are among the very few studies on isomer identification using a shaped femtosecond laser pulse and a mass spectrometer. The molecules yield essentially the same spectra under the irradiation of a transform limited pulse. By using a binary phase shaped laser pulse, in which each laser spectral component has a phase of 0 or π , they increase the difference between mass spectra. However, since the possible pulse shapes that can be generated from a pulse shaper are practically unlimited (a 128-pixel SLM with 100 degree of voltage levels yields 10256 pulse shapes), a complete scan of all the available pulse shapes is impossible. Cruz et al.[26] simplified the pulse shape space by assigning the adjacent 10-SLM pixel the same value and by reducing the voltage levels to the two binary values. In this way a search space of 1024 possible pulse shapes is achieved. Although this makes the experiment feasible, the greatly reducing searching space makes it almost impossible to find the true best pulse shape. To search in a much larger space, GA optimization needs to be used. However, for the isomer identification, GA optimization with a single mass spectrometer is not feasible. One might be able to perform the GA run on one of the two isomers at a time, aiming at making their mass spectra look different. However, the optimal laser pulse shapes found from each GA run for each molecule are not likely to be the same. Finally, we need to find a single pulse shape under which irradiation the two isomers yield two different mass spectra.
Using the dual-spectrometer scheme proposed in the present study, the laser beam is divided into two beams and the same laser field irradiates two isomers simultaneously. Thus, a GA optimization can be performed, whose fitness is taken from the two mass spectrometers, without the interference of one spectrum to the other. The optimal pulses are obtained from a much larger searching space. This will have the ability to distinguish isomers when the pulse irradiates each pure molecule sample. After calibration, it will also be able to show the relative concentration of each molecule sample when it irradiates the molecular mixture.
As seen in Subsection 3.2, the dual-spectrometer scheme is not limited to the usage of isomer identification. It can also be used in the selective control of molecular reaction dynamics of two molecules, simultaneously. As long as the reaction products we are interested in involve common peaks in the two mass spectra, the dual-spectrometer scheme will be useful because the GA optimization cannot be performed in a single spectrometer. This selective control of ionization and/or dissociation products has potential application in the purification of molecular mixtures because one of the molecules may be removed after having been dissociated or ionized. It can also be used for obtaining products from one of the molecules in a mixture in the circumstances that other molecules also yield unwanted products under the irradiation of transform limited pulse.
From the viewpoint of experimental technique, the dual-spectrometer scheme will, of course, save some time for experiment. For example, some GA optimization or even open loop study needs to be done with the same pulse shape but under two different experimental conditions simultaneously and the two results are compared with each other. Doing the same experiment with a dual-spectrometer will at least reduce half of the time. For example, in some experiments, one needs to compare the mass spectra from two different polarized laser pulses. The dual-spectrometer scheme will be able not only to obtain the two mass spectra at the same time but also to save the time needed to rotate the polarization direction. This amount of time is seemingly trivial for a single mass spectrum but it will be very important in a lengthy GA optimization that involves hundreds or thousands of mass spectra to acquire.
A dual-mass-spectrometer scheme is proposed in which two mass spectrometers are used to obtain the time of flight mass spectra of two different molecules at the same time under the irradiation of same shaped femtosecond laser pulses. This scheme is used for performing the isomeric identification, and controlling the ionization and dissociation of acetone and its isomers. The results show that the identification or control is effective. It is impossible to carry out the same type of GA optimization with a single mass spectrometer. The phase space of laser field in a closed loop feedback control is dramatically increased compared with that in open loop study, which provides more dimensions and greater degree of isomeric identification and control. The independent measurement of isomers in two TOF mass spectrometers eliminates the interference between the same mass spectrum peaks.
In the present study, we select acetone and its isomers as the sample, and limit GA optimization in sine phase space, to demonstrate the feasibility of the dual-spectrometer scheme. In future study, other isomer molecules with even closer structures and even similar mass spectra under the irradiation of a transform limited pulse will be chosen as the sample. More complex pulse structures will also be obtained using a random phase. We will also use polarization shaped femtosecond pulse, [42, 43] together with the dual-mass-spectrometer, to distinguish chiral isomers[24] or to control the reaction from one to the other.
| 1 |
|
| 2 |
|
| 3 |
|
| 4 |
|
| 5 |
|
| 6 |
|
| 7 |
|
| 8 |
|
| 9 |
|
| 10 |
|
| 11 |
|
| 12 |
|
| 13 |
|
| 14 |
|
| 15 |
|
| 16 |
|
| 17 |
|
| 18 |
|
| 19 |
|
| 20 |
|
| 21 |
|
| 22 |
|
| 23 |
|
| 24 |
|
| 25 |
|
| 26 |
|
| 27 |
|
| 28 |
|
| 29 |
|
| 30 |
|
| 31 |
|
| 32 |
|
| 33 |
|
| 34 |
|
| 35 |
|
| 36 |
|
| 37 |
|
| 38 |
|
| 39 |
|
| 40 |
|
| 41 |
|
| 42 |
|
| 43 |
|