Closed-loop control of epileptiform activities in a neural population model using a proportional-derivative controller*
[Wang Jun-Songa), b)†  , Wang Mei-Li
a) , Li Xiao-Lic) , Ernst Nieburb) ]
, Wang Mei-Li|
|


†Corresponding author. E-mail: wjsong2004@126.com
*Project supported by the National Natural Science Foundation of China (Grant Nos. 61473208, 61025019, and 91132722), ONR MURI N000141010278, and NIH grant R01EY016281.
Epilepsy is believed to be caused by a lack of balance between excitation and inhibitation in the brain. A promising strategy for the control of the disease is closed-loop brain stimulation. How to determine the stimulation control parameters for effective and safe treatment protocols remains, however, an unsolved question. To constrain the complex dynamics of the biological brain, we use a neural population model (NPM). We propose that a proportional-derivative (PD) type closed-loop control can successfully suppress epileptiform activities. First, we determine the stability of root loci, which reveals that the dynamical mechanism underlying epilepsy in the NPM is the loss of homeostatic control caused by the lack of balance between excitation and inhibition. Then, we design a PD type closed-loop controller to stabilize the unstable NPM such that the homeostatic equilibriums are maintained; we show that epileptiform activities are successfully suppressed. A graphical approach is employed to determine the stabilizing region of the PD controller in the parameter space, providing a theoretical guideline for the selection of the PD control parameters. Furthermore, we establish the relationship between the control parameters and the model parameters in the form of stabilizing regions to help understand the mechanism of suppressing epileptiform activities in the NPM. Simulations show that the PD-type closed-loop control strategy can effectively suppress epileptiform activities in the NPM.
Epilepsy is the third most common neurological disorder right after Alzheimer's disease and stroke, affecting approximately 50 million people around the world. Epilepsy is characterized by seizure-like high amplitude oscillations of global brain activities affecting various mechanisms on microscopic and macroscopic scales. It is a complex set of disorders that can involve many areas of the cortex as well as underlying deep-brain systems.[1] At the system level, epilepsy is a dynamical disorder of the brain, which makes it particularly suitable to be studied from the perspective of computational modeling and dynamical-system theory.[2]
In this context, computational models have become attractive due to their ability to model complex neurological phenomena with relative ease by modeling the effects of various neurological factors.[2] Over the past few years, substantial progress has been made in modeling epilepsy at levels ranging from microscopic to macroscopic.[3, 4] At the macroscopic level, the neural population model (NPM) is developed to relate macroscopic phenomena, at the level of the electroencephalogram (EEG), with oscillations in smaller neuronal populations. The neural population model is based on a biologically plausible parameterization of the dynamic behavior of the layered neocortex, which starts from the fact that the EEG is a reflection of ensemble dynamics arising from interconnected populations of pyramidal cells and interneurons.[5] The NPM was initially proposed to study the origin of the alpha rhythm, [6] and subsequently improved and extended to describe more general cortical electrical activities.[7] Recently, NPMs have been extensively used to generate EEG, magnetoencephalography (MEG), and functional magnetic resonance imaging (FMRI) signals.[8] Specifically, an NPM has been successfully used to generate an epileptic behavior similar to that observed experimentally, as well as the transition between normal and epileptic activities.[3] Therefore, NPMs are useful test-beds to develop seizure control strategies.[9]
The most commonly used treatment for epilepsy is administration of antiepileptic medication, usually anti-consultants. While frequently successful, such drugs can have significant systemic and central nervous system side effects. An alternative, on which we focus in this report, is the suppression of epileptiform activities through electrical brain stimulation, which seems to have minimal or no advserse side effects.[10] Furthermore, epilepsy is drug-resistant in a substantial fraction of patients, and the affectivity of these drugs frequently diminishes over time even in patients who first responded favorably to anti-epileptic medication. Minimally invasive transcranial application of direct current pulses has been demonstrated to be an effective anti-consultant measure in a rodent model of epilepsy.[11] This is the case even though the applied current is very simple and open loop (trains of rising bipolar pulses through a unilateral epicranial electrode). The adaptive (closed-loop) control is likely to be a much more powerful stimulation control strategy and it is therefore the focus of current experimental and theoretical researches.[12] An optimal control theory was employed to design an event-based, minimum-energy, desynchronizing control stimulus for a network of pathologically synchronized, heterogeneously coupled neurons.[12] One possibility was to use a radial basis function neural network responsive neuromodulator to control seizure-like events in a computational model of epilepsy.[13] Also, a closed-loop controller was developed based on a recursively identified autoregressive model of the relationship between stimulation input and local field potential output.[14] Although excellent performance has been achieved by these approaches, these intelligent or optimal control algorithms are somewhat complex. This suggests that simple control algorithms should be preferred in closed-loop seizure control.
Closed-loop control is a promising method for suppressing epilepsy.[15] A much used closed-loop control scheme is a proportional-integral-derivative (PID) controller, which gains its popularity in engineering because of its robust performance and simplicity.[16] A PID type closed-loop control strategy was introduced to control epileptic seizures by disrupting the synchronization patterns observed prior to the seizures.[9] However, the selection of the PID control parameters in the previous work was determined by trial and error. This makes the outcome strongly dependent on the designer's experience. Furthermore, the work is time-consuming and efficiency is not guaranteed, which makes the selection of control parameters quite challenging.
Given the non-stationary of neuronal signals over long time periods, the integral part of a PID controller likely contributes little functionality. Proportional-derivative (PD) control is a special case of PID, which provides a fast response to the control error and increases the system's stability.[16] Therefore, in this study, PD control is employed to control the epileptiform activity in an NPM. Since the epileptiform activity is caused by unbalanced excitation and inhibition, [17] intuitively the control parameters should be related to, and dependent on, the excitatory and inhibitory parameters. How to build a quantitative relationship between the PD control parameters and the model's excitatory and inhibitory parameters is, however, not known. We therefore apply the control theory to establish the above-mentioned relationship in the form of stabilizing regions, which can provide a guideline for the choice of control parameters. Our strategy is to start with a neural population model that shows the epileptic behavior due to its (abnormal) excitatory and inhibitory parameters. The epileptiform activities generated by the model are then suppressed by subjecting it to stimulation applied by a closed-loop PD controller. With the stabilizing region of the PD controller available for a given set of model parameters, we can avoid the time-consuming stability check for each set of PD controller parameters in the search process and thereby save the controller tuning time.
This report is organized as follows. After this introduction section, the neural population model is introduced and its transfer function representation is derived in Section 2. The stability of the NPM is analyzed based on the roots locus method in Section 3. In Section 4, a PD type closed-loop control strategy is proposed to suppress epileptiform activities in the NPM, and the stabilizing region of the PD controller is determined using a graphical approach. Simulation examples are given to demonstrate the performance of the proposed control scheme in Section 5. Finally, concluding remarks are given in Section 6.
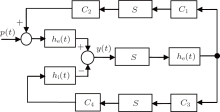
In this study, we use Jansen's neural population model as a test bed to design a PD-based seizure closed-loop control strategy.[8] As illustrated in Fig. 1, [4, 8, 18] the neural population model consists of three interacting subpopulations, the main subpopulation (middle), the excitatory feedback subpopulation (top), and the inhibitory feedback subpopulation (bottom). The main subpopulation is composed of principal cells that receive feedback from the excitatory and the inhibitory subpopulations.
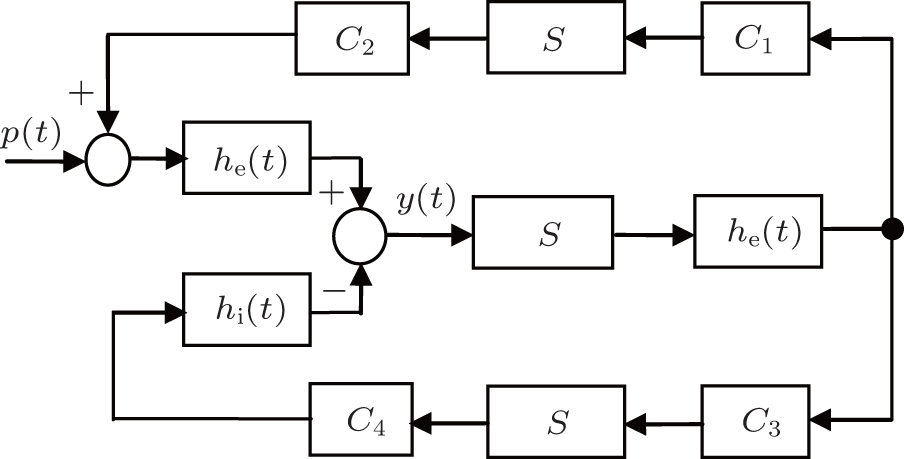 | Fig. 1. Schematic diagram of the neural population model. |
Each subpopulation is characterized by an excitatory or inhibitory linear dynamic function (he (t) or hi (t)) and a nonlinear static function (S(v)). The details of the subpopulation are given as follows, see also Refs. [4] and [8].
The excitatory and inhibitory linear dynamic functions that transfer the pre-synaptic average rates of action potentials into a post-synaptic average membrane potential have the impulse responses given by
where He and Hi denote the excitatory and inhibitory average synaptic gains, and τ e and τ i are lumped representations of the membrane time constants, which include synaptic delays as well as axonal and dendritic time delays for the excitatory and inhibitory populations, respectively. The parameters in Eq. (1) are used to tune the sensitivity of the excitatory and inhibitory synapses.
The excitatory and inhibitory linear dynamic function (1) can be described by a second-order ordinary differential equation as follows:

where p(t) and y(t) are the input and output signals of the NPM, respectively.
The nonlinear static function S(v) transforms the average membrane potential of the population into the average rate of action potentials fired by the neurons. This transformation is assumed to be instantaneous and described by the sigmoid function

where 2e0 is the maximum firing rate, v0 is the post-synaptic potential corresponding to a firing rate of e0, r describes the steepness of the sigmoid function, and v is the average pre-synaptic membrane potential.
| Table 1. Physiological interpretation and standard values of the parameters in the NPM. |
Interactions between main cells and interneurons are denoted in the model by connectivity constants C1, C2, C3, and C4, which characterize the average number of synaptic contacts.
The influence from neighboring populations is represented by an excitatory input p(t), which is modeled by Gaussian noise. The model output corresponds to the average synaptic activity of the pyramidal cells, which is interpreted as an EEG signal.
The standard values of the parameters of the neural population model are listed in Table 1, the standard values are those defined in Ref. [8].
From the viewpoint of control, the three subpopulations of the NPM represent a feed-forward loop and a positive and negative feedback loop, respectively. To take advantage of the linear system theory, we derive a linear approximation of the neural population model around its equilibrium point.[9, 19]
Since S(v) is the only nonlinear function in the NPM due to its input– pulse sigmoid curve, to derive a linear approximation we only need to linearize function S(v). The linear approximation treats the state as a small perturbation around the equilibrium point v = v0 . The dynamics depend on the slope of S(v0) at the equilibrium point, which we refer to as the sigmoid `gain'Ks,
where S'(v) is the derivative of S(v). It is noted that the most extensively used linearization technique applied to the NPM is to derive its Jacobian.[9, 19] Obviously, our linearization method is much simpler to use since it only needs to linearize the function S(v).
The Laplace transform of Eq. (2) gives the transfer function representation of he (t) and hi (t) as

where Ge(s) and Gi (s) are the transfer functions of he (t) and hi(t), respectively.
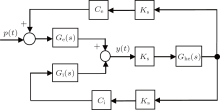
The diagram of the linear approximate representation of the neural population model is illustrated in Fig. 2, where Ce = C1C2 and Ci = C3C4
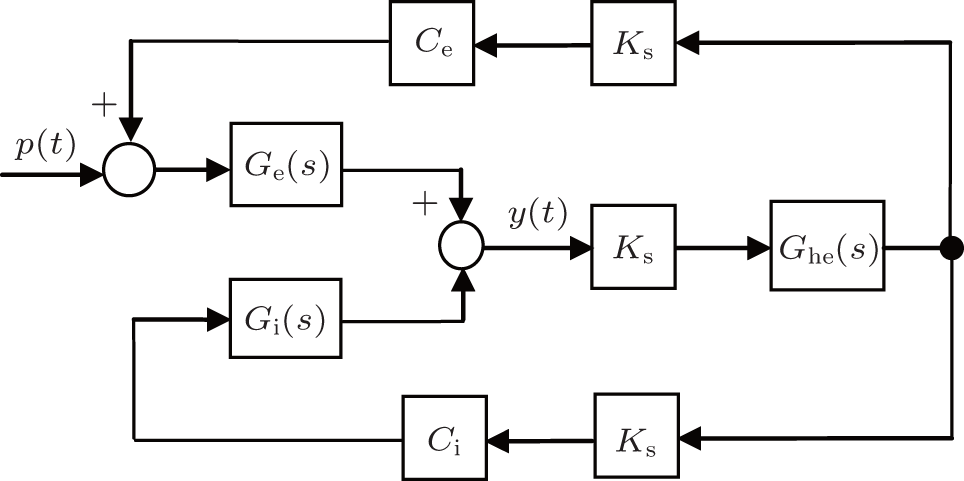 | Fig. 2. Block diagram of linearized NPM in the form of transfer function. |
From Fig. 2, we derive the transfer function of the neural population model as follows:

where Y(s) and P(s) are the Laplace transformation of y(t) and p(t), respectively. We are now in a position to apply the general theory of linear systems to the neural population model.
As is well known, synaptic plasticity is the key regulating mechanism of neural activity, which corresponds to two parameters of NPM, He and Hi, thus we conduct the following research in parameter space (He, Hi).
Epilepsy is a dynamical disease of the brain[2] caused by lack of balance between excitation and inhibition.[16] In this section, we consider the establishment and disturbances of neurophysiologtical homeostasis in an NPM to study the dynamical mechanisms underlining epileptiform activity in the NPM. This will be helpful to understand the mechanisms of seizure control strategies developed in the next section.
Homeostasis is a fundamental mechanism that stabilizes and maintains “ normal” activity levels in neural (and technical) systems.[20] In the NPM, a homeostatic equilibrium is achieved by the balance between excitation and inhibition. Excessive parameter drift of the NPM (an abnormal increase of excitatory parameters He or an abnormal decrease of inhibitory parameters Hi) can cause unbalance between excitation and inhibition, resulting in the generation of epileptiform activity by destabilizing the NPM. Thus, stability analysis of the NPM will provide insight into the dynamical mechanisms that generate epileptiform activities.
According to the linear control theory, the stability of a control system can be characterized completely by the location of its characteristic roots.[21] Thus, we plot the root loci of the characteristic equation of the NPM and use them to analyze the influence of the model parameters He and Hi on the stability of the NPM.
From Eq. (5), the characteristic equation of the NPM is
To analyze the influence of the parameters He and Hi on the stability of the NPM, we vary them independently while keeping all other model parameters at their standard values, as shown in Table 1. Therefore, the characteristic roots of Eq. (6) depend on He and Hi, i.e., si = f(He, Hi), where si is the i-th root of Eq. (6), i = 1, 2, … , 6.
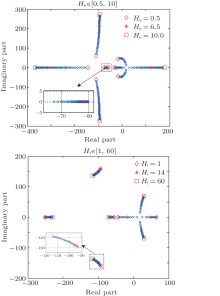
 | Fig. 3. Root loci of the neural population model. Only parameters (a) He and (b) Hi are varied, the other model parameters stay at the standard values given in Table 1. |
According to Eq. (6), we plot the root loci of the characteristic equation of the NPM, which are illustrated in Figs. 3(a) and 3(b). The characteristic equation (6) is sixth order, so there are six blue branches. The model parameters are given in Table 1 except for He which is varied in Fig. 3(a) and Hi which is varied in Fig. 3(b). The variation range of each parameter is specified in the title of the corresponding subplot. Stars show the locations of the roots of the characteristic equation of the NPM, while diamonds and squares show the root locations when the corresponding parameter is set at its minimum and maximum values, respectively.
This procedure provides considerable insight into how the parameters influence the system's stability. Abnormal increase of excitation (i.e., hyperexcitation) as well as decrease of inhibition (i.e., low inhibition) results in roots located in the right half of the s plane, with positive real parts. These roots correspond to parameters He and Hi that lead to an unstable behavior of the NPM, which results in the generation of the epileptiform activities by the NPM.
As described in the previous section, the unbalanced excitation and inhibition makes the NPM unstable and leads to epileptiform activities with high amplitudes.
In this section, we consider the neural population model as a controlled plant from the viewpoint of control theory. We construct a PD controller to stabilize the unstable NPM such that homeostasis is maintained and epileptiform activities are suppressed. The basic requirement for the PD controller parameters is to make the closed-loop system stable. A graphical approach is convenient for determining the stabilizing region in the parameter space for tuning parameters of the PD controller.
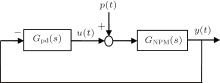
The PD based NPM (PD-NPM) closed-loop control system is illustrated in Fig. 4, where GNPM (s) is the transfer function of the NPM, and Gpd(s) is a PD controller with an ideal transfer function

Furthermore, u(t) is the control signal, p(t) the excitatory input of the NPM from neighboring areas, and y(t) is its output.
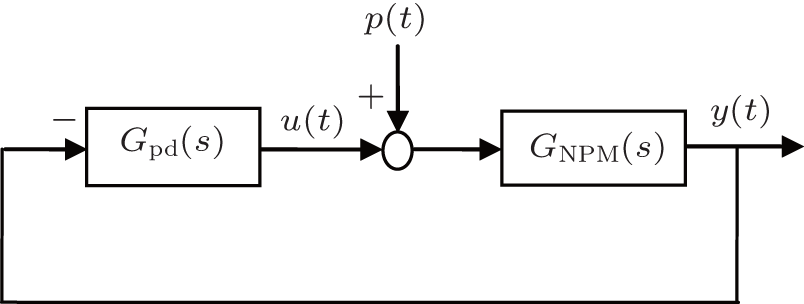 | Fig. 4. Schematic diagram of the PD-NPM control system. |
The objective is to determine the region of the PD controller in the (Kp, Kd) plane in which the PD-NPM control system is stable. We achieve this by using a graphical approach to determine the stability boundary of the PD controller in the (Kp, Kd) plane.
From Fig. 4, we see that the characteristic equation of the closed-loop PD-NPM system is

where Δ (s) is the characteristic polynomial of the PD-NPM control system.
According to the linear control theory, the stability of a control system can be determined according to the location of the characteristic roots. A feedback system is stable if all the characteristic roots lie in the open left-hand s plane of the imaginary axis, and unstable if any characteristic root lies in the open right-hand side.
Defining s = jω , and substituting it in Eq. (8), we obtain

which determines the stability boundary of the PD-NPM control system.
As the coefficients of the characteristic polynomial (9) are real, the complex roots must be complex conjugate. Hence, it is sufficient to consider the case ω ∈ [0, ∞ ). The stability boundary is then given as follows:[20]

where
In the following, we discuss the two cases, ω = 0 and ω > 0, to determine the boundary of the stabilizing region of the PD controller in the (Kp, Kd) plane.
Substituting Eqs. (5) and (7) in Eq. (8), we can derive the characteristic equation of the PD-NPM control system as follows:
For ω = 0, i.e. s = 0, equation (11) becomes

Thus we can derive the stability boundary for the case, i.e., H1, as follows:

This equation describes a line parallel to the axis through the point 
Next, from Eq. (11), we note that the coefficient of s6 in the characteristic polynomial, i.e., 

that is

Therefore, we obtain the following lemma.
Lemma 1 For the case ω = 0, along the direction of the arrow shown in Fig. 5, the region to the left of the line defined in Eq. (12) in the (Kp, Kd) plane is the stabilizing parameter sets of the PD controller.
From Eq. (9), we obtain
where δ R_NPM (ω ) and δ I_NPM (ω ) are the real and the imaginary components of GNPM (jω ), respectively. Partitioning the corresponding Δ (jω ) into real and imaginary components yields

where
Here δ R (ω ) and δ I (ω ) are the real and the imaginary components of Δ (jω ), respectively.
Note that both δ R (ω ) and δ I (ω ) are dependent on Kp and Kd. Thus, the stability of the characteristic equation (9) can be investigated in the parameter space (Kp, Kd) as follows.
From Eqs. (15) and (16), we obtain

Solving the above two equations simultaneously, we obtain
where 
Equation (17) defines the critical curve H2 in the (Kp, Kd) plane for the case ω > 0. We sketch the stability boundary curve (Kp (ω ), Kd (ω )) for ω > 0 in Fig. 5 (blue curve).
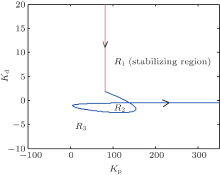
We thus find that the stability boundary is composed of the stability boundary line defined in Eq. (12) and the stability boundary curve defined in Eq. (17). As illustrated in Fig. 5, the stability line and the stability boundary curve divide the (Kp, Kd) plane into three disjoint regions, denoted by R1, R2, and R3, where R2 is the stabilizing parameter regions, and R2 and R3 are the destabilizing parameter regions. In the following, we will investigate how to characterize the system behavior in these regions.
 | Fig. 5. The stability boundary of the PD controller for suppressing epileptiform activities in PD-NPM with He = 4.5 mV. Arrows represent the direction of the curve (Kp (ω ), Kd (ω )) in which ω increases. |
To begin with, we introduce the following proposition.[22] Proceeding along the curve in the direction of increasing ω , the right side of the curve (Kp (ω ), Kd (ω )) is the stabilizing parameter region, where det J < 0; while to its left, det J > 0. Here J is the Jacobin matrix defined as
From Eq. (17), we obtain
Thus we conclude that det J = ω | GNPM (jω )| 2. Since ω > 0 and| GNPM (jω ) | 2 > 0, it follows that

Therefore, we obtain the following lemma.
Lemma 2 For the case ω > 0, following the curve (Kp (ω ), Kd (ω )) in the direction of increasing ω , the parameter space to the left of the curve defined by Eq. (17) is the stabilizing parameter region of the PD controller.
Combining Lemma 1 with Lemma 2 yields the following theorem.
Theorem 1 For the PD-NPM control system depicted in Fig. 4, following the curve (Kp (ω ), Kd (ω )) defined in Eq. (17) in the direction of increasing ω (ω > 0), the portion of the parameter space to the left of the curve defined by Eq. (17) and the line defined by Eq. (12) is the exact stabilizing parameter region of the PD controller.
Thus, according to Theorem 1, the region denoted by R1 in Fig. 5 can be identified as the stabilizing region of parameters (Kp, Kd).
The epileptiform activities in the NPM with abnormal values of excitatory and inhibitory parameters are the result of unbalanced excitation and inhibition. Therefore, in this subsection, we will analyze how the parameters He and Hi influence the stabilizing region of the PD controller.
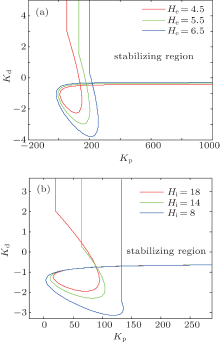
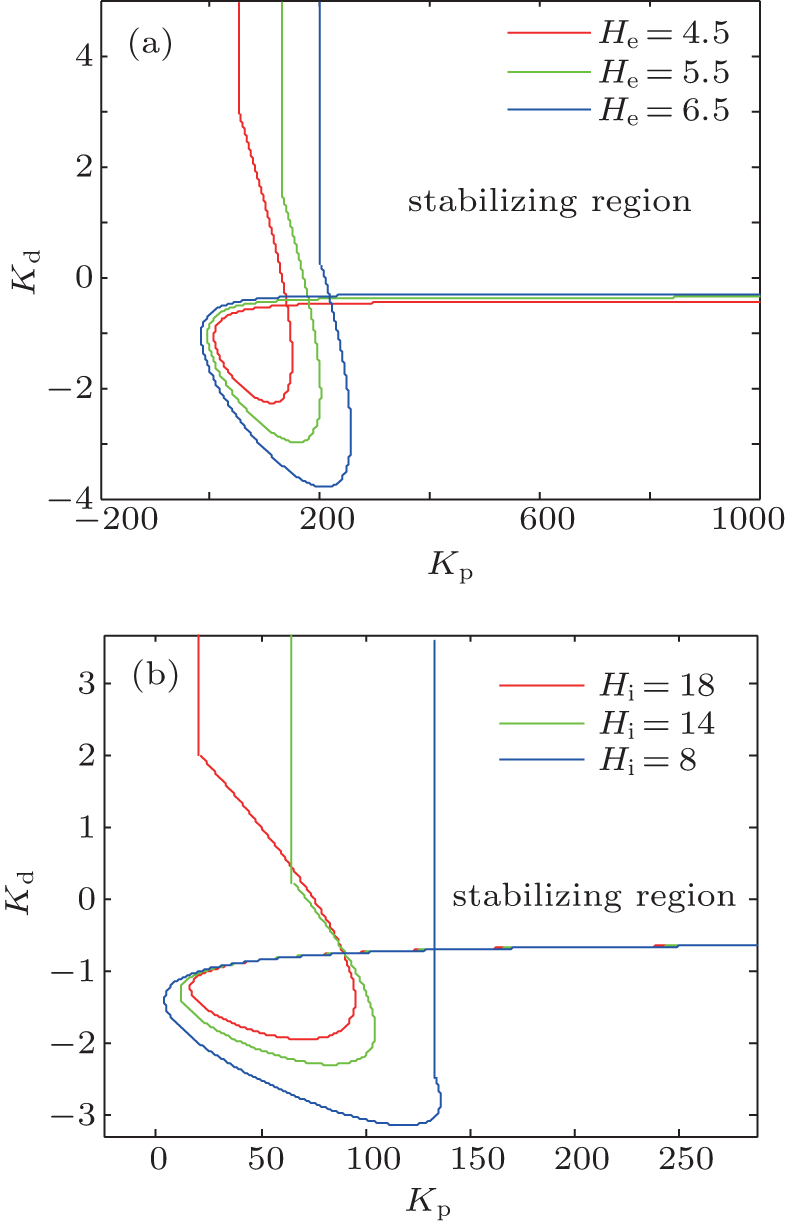 | Fig. 6. The influence of excitatory and inhibitory parameters He and Hi on the stabilizing regions of the PD controller. In panel (a), He is varied as shown and Hi is fixed at 22 mV; in panel (b), Hi is varied and He is fixed at 3.25 mV. |
We consider two cases with abnormal values of He and Hi . The stabilizing regions of the PD controller for the NPM with different abnormal values of the parameters He and Hi are illustrated in Figs. 6(a) and6(b), respectively. The results indicate that increasing He or decreasing Hi makes the stabilizing region of the PD controller smaller. This agrees with the intuitive notion that a stronger control signal is needed to stabilize the NPM if the latter has stronger excitation and/or weaker inhibition.
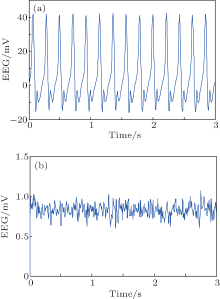
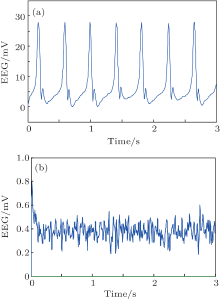
We conduct simulations to demonstrate the feasibility and efficiency of the proposed PD based control scheme. We use the NPM with the standard parameters from Table 1 but with the following two variations. In the first, we increase the excitation to He = 6.5 mV. In the second, we increase the excitation to a moderate one (He = 3.95 mV) and also decrease the inhibition to Hi = 18 mV. As shown in Fig. 3, in each of these cases, the NPM is linear unstable. The simulation results of the model dynamics are illustrated for these cases in Figs. 7(a) and 8(a), respectively. The output function y(t) of the NPM, which is in agreement with the previous work, [8] is interpreted as an approximation of the EEG signal. Without control applied (Figs. 7(a) and 8(a)), the EEG signal consists of spike-like high amplitude oscillations with obvious epileptiform characteristics.
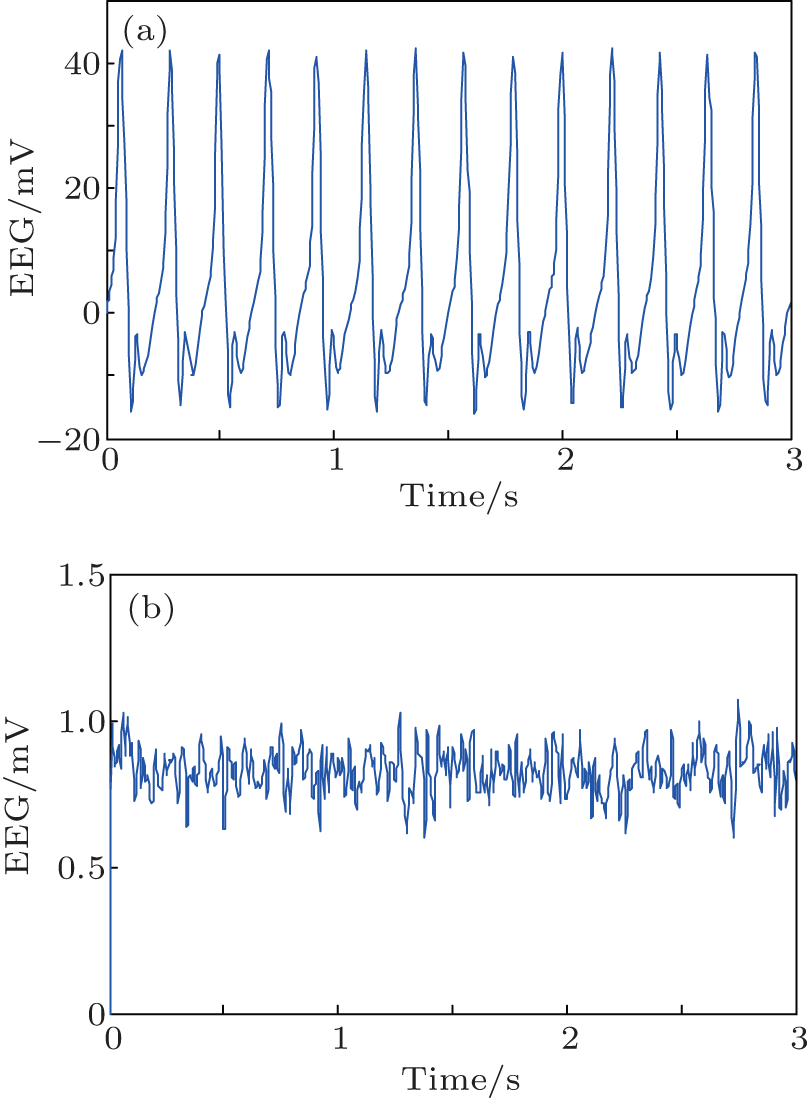 | Fig. 7. The output of NPM without (a) and with (b) the PD controller for the first case (He = 6.5). Note the difference in scales. |
In order to suppress the seizure-like behavior, we apply a PD controller as described with control parameters inside the stabilizing region illustrated in Fig. 6. Specifically, the control parameters are selected as Kp = 230, Kd = 0.2 for the first case (Fig. 7) and Kp = 120, Kd = 0.2 for the second one (Fig. 8). The simulation results of the controlled NPM are shown in Figs. 7(b) and 8(b). The output is now a low amplitude, noise-like activity similar to that seen during the normal (non-epileptic) behavior.
 | Fig. 8. The output of NPM without (a) and with (b) the PD controller for the second case (Hi = 18, He = 3.95). Note the difference in scales. |
We use a commonly used neural population model to study the generation of epileptic behavior. Parameters of the model are chosen such that seizure-like activities are obtained. We then consider this system from the point of control theory as one whose behavior needs to be steered towards a normal (non-pathological) state. Our goal is to use a simple, proportional-derivative (PD) control scheme, both for robustness and ease of parameter determination. We show that the parameters of the PD controller can be determined from graphically-defined stability regions which are defined in terms of the model parameters. This establishes a quantitative relationship between the control parameters and the model's excitatory and inhibitory parameters, thus providing a guideline for the choice of the control parameters to suppress epilepsy in the model. Simulation results suggest the feasibility of the PD based control scheme. A direct current stimulation may be effective for neurological disorders other than epilepsy, [22] and the closed loop strategies developed here may prove to be much more powerful than the typically very simple stimulation protocols that were conventionally applied. The linear approximation of the sigmoid function in our model will generate more unstable output than the full (nonlinear) model. Thus, determining the stability region of the PD controller based on the stability analysis of the linearized model provides a conservative estimate. In future work, we will use a bifurcation analysis method to obtain more specific results. An open question is how to determine the control parameters from measurements in a biological system, i.e., when no computational model with known parameters is available. We also propose to apply the proposed PD controller to standard animal models of epilepsy with the goal of on-line seizure suppression, with the obvious long-term goal of application to human patients.
| 1 |
|
| 2 |
|
| 3 |
|
| 4 |
|
| 5 |
|
| 6 |
|
| 7 |
|
| 8 |
|
| 9 |
|
| 10 |
|
| 11 |
|
| 12 |
|
| 13 |
|
| 14 |
|
| 15 |
|
| 16 |
|
| 17 |
|
| 18 |
|
| 19 |
|
| 20 |
|
| 21 |
|
| 22 |
|