Hu Mei-Hua, Bi Ning, Li Shang-Sheng, Su Tai-Chao, Zhou Ai-Guo, Hu Qiang, Jia Xiao-Peng, Ma Hong-An. Effects of FeNi-phosphorus-carbon system on crystal growth of diamond under high pressure and high temperature conditions* . Chinese Physics B, 2015, 24(3): 038101
Permissions
Effects of FeNi-phosphorus-carbon system on crystal growth of diamond under high pressure and high temperature conditions*
Hu Mei-Huaa)†, Bi Ningb), Li Shang-Shenga), Su Tai-Chaoa), Zhou Ai-Guoa), Hu Qianga), Jia Xiao-Pengc), Ma Hong-Anc)
School of Materials Science and Engineering, Henan Polytechnic University, Jiaozuo 454000, China
School of Physics and Chemistry, Henan Polytechnic University, Jiaozuo 454000, China
State Key Laboratory of Superhard Materials, Jilin University, Changchun 130012, China
*Project supported by the Doctoral Fund of Henan Polytechnic University, China (Grant Nos. B2013-013 and B2013-044) and the Research Projects of Science and Technology of the Education Department of Henan Province, China (Grant Nos. 14B430026 and 12A430010).
Abstract
This paper reports the crystal growth of diamond from the FeNi–Carbon system with additive phosphorus at high pressures and high temperatures of 5.4–5.8 GPa and 1280–1360 °C. Attributed to the presence of additive phosphorus, the pressure and temperature condition, morphology, and color of diamond crystals change obviously. The pressure and temperature condition of diamond growth increases evidently with the increase of additive phosphorus content and results in the moving up of the V-shape region. The surfaces of the diamonds also become coarse as the additive phosphorus added in the growth system. Raman spectra indicate that diamonds grown from the FeNi-phosphorus-carbon system have more crystal defects and impurities. This work provides a new way to enrich the doping of diamond and improve the experimental exploration for future material applications.
Keyword:
81.05.ug; 81.10.–h; 61.72.–y; diamond; high pressure and high temperature; additive phosphorus
It is well known that diamonds have many outstanding physical and chemical properties, such as extreme hardness, optical transmission over a wide range, high thermal conductivity, good insulator, so on.[1– 4] Some of these properties may be influenced by the impurities incorporated in the diamond lattice. Diamond crystals with some additive elements, like boron, nitrogen, and sulfur, are usually synthesized by the high pressure high temperature (HPHT) and chemical vapor deposition (CVD) growth methods.[5– 9] Diamonds with additive phosphorus exhibiting n-type semiconductor properties have been produced by CVD methods.[10]
Diamond can be synthesized from the phosphorus-carbon system at 6.3– 7.5 GPa and 1400– 1850 ° C, [11] and it is confirmed that these diamonds contained phosphorus as the impurity in the crystal lattice. However, these obtained diamond crystals using phosphorus as catalyst were too irregular and small to measure their physical and chemical properties. Consequently, it is very important to grow diamond crystals, > 2 mm in size, which is large enough to measure these properties. On the other hand, experimental studies and data are quite limited on the crystal growth of diamond crystals with phosphorus as an additive under high pressure and high temperature conditions.
For this purpose, growth experiments of diamond crystals were carried out at high pressure and high temperature conditions using additive phosphorus in the system of FeNi-carbon (FeNi-C). The diamond crystals were characterized by optical microscopes (OM), scanning electron microscope (SEM), and Raman spectroscopy. This work will provide a new way to enrich the doping of diamond and improve the experimental exploration for material applications in future.
2 Experimental
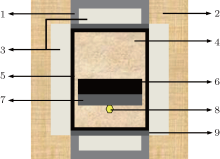
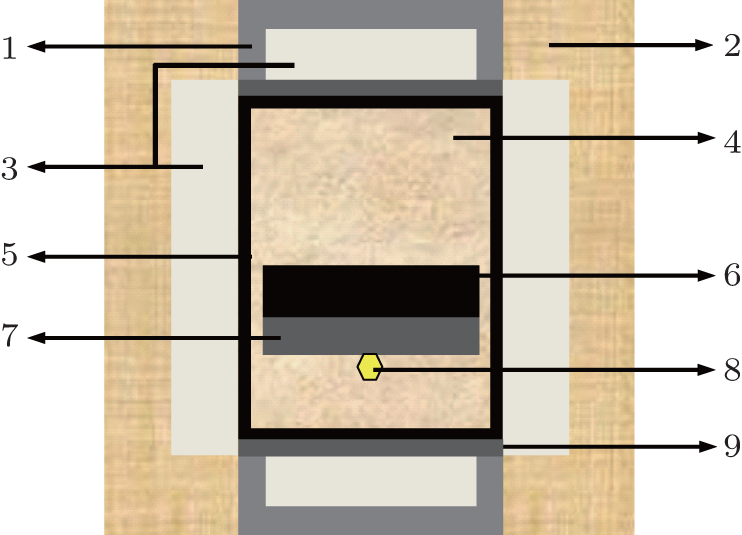
Growths of diamond crystals from the FeNi-phosphorus-carbon (FeNi-P-C) system were performed by the temperature gradient method using a China type cubic high pressure apparatus (CHPA) (SPD-6× 1200). The sample assembly for crystal growth of diamond is shown in Fig. 1. The FeNi alloy (Fe:Ni = 64:36, weight ratio, and 99.9% , purity) was used as the solvent catalyst. High purity graphite powder (99.9% , purity) was selected as a carbon source. Red phosphorus (purity 99.9% ) was used as an additive. High quality diamond crystals were used as seed crystals, with one of {100} crystal faces of about 0.7 mm× 0.7 mm in size as the initial growth crystal face. The growth time of diamond crystal was about 20.0– 21.0 h. In these experiments the pressure was estimated by the load of the oil press, which was calibrated by a curve that was established on the pressure-induced phase transitions of elements of Bi, Tl, and Ba, and temperature was determined by a Pt6% Rh– Pt30% Rh thermocouple, respectively.
Fig. 1. Sample assembly for diamond growth in the FeNi-P-C system. Number 1: steel ring; number 2: pyrophyllite; number 3: ceramic cylinder and cover; number 4: ceramic insulator; number 5: graphite heater; number 6: carbon source; number 7: alloy solvent; number 8: diamond seed; number 9: copper plate.
Samples taken from the high pressure apparatus were placed in a boiling solution of nitric acid and sulfuric acid to remove the remaining graphite and metal catalyst. OM and SEM were used to observe the color, morphology, inclusions and surface characteristics of the diamond crystals. Raman spectroscopy was used to characterise the quality of the diamonds.
3 Results and discussion
3.1. The changes of pressure and temperature conditions of diamond growth from the FeNi-P-C system
To investigate the influences of additive phosphorus on pressure and temperature conditions of diamond growth, the experiments were performed under the conditions of pressures and temperatures at 5.4– 5.8 GPa and 1280– 1360 ° C. The relationship between the growth conditions (pressure and temperature) of diamond crystals and the amount of additive phosphorus in the FeNi-P-C system is shown in Table 1. It can be seen that the pressure and temperature ranges of diamond growth change narrow evidently (N1, N2, and N3) with the increase of additive phosphorus. In the absence of phosphorus in the growth system at 5.4 GPa (N1), the temperature range is about 1280– 1320 ° C, and the morphologies of diamond crystals show that they are mainly composed of (100) crystal faces, (100)+ (111) crystal faces, and (111) crystal faces, respectively. However, in the presence of phosphorus in the growth system at 5.4 GPa (N2), the morphologies of diamond crystals show (100)+ (111) crystal faces, and (111) crystal faces. It is difficult to grow a diamond crystal that is mainly composed of (100) crystal faces. If we expand the range of temperature of crystal growth, it should raise the growth pressure, such as 1320– 1360 ° C at 5.6 GPa (N3), and 1350– 1360 ° C at 5.8 GPa (N4).
Table 1.
Table 1.
Table 1. Experimental results of diamond growth from the FeNi-P-C system (“ – ” : no single crystal).
Runs
Pressure/GPa
Grown temperature range/° C
Growth time/h
Phosphorus additive/wt%%
Morphology
N1
5.4
1280– 1320
20.5
0
(100); (100)+ (111); (111)
N2
5.4
1310– 1340
21.0
0.5
(100)+ (111); (111)
N3
5.6
1320– 1360
21.0
0.5
(100); (100)+ (111); (111)
1330– 1350
21.0
1.0
(100)+ (111); (111)
1340– 1360
21.0
1.5
(100)+ (111); (111)
1350– 1360
20.5
2.0
–
N4
5.8
1350– 1360
21.0
2.0
(100)+ (111); (111) or −
Table 1. Experimental results of diamond growth from the FeNi-P-C system (“ – ” : no single crystal).
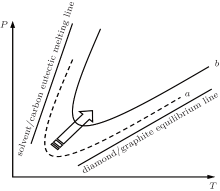
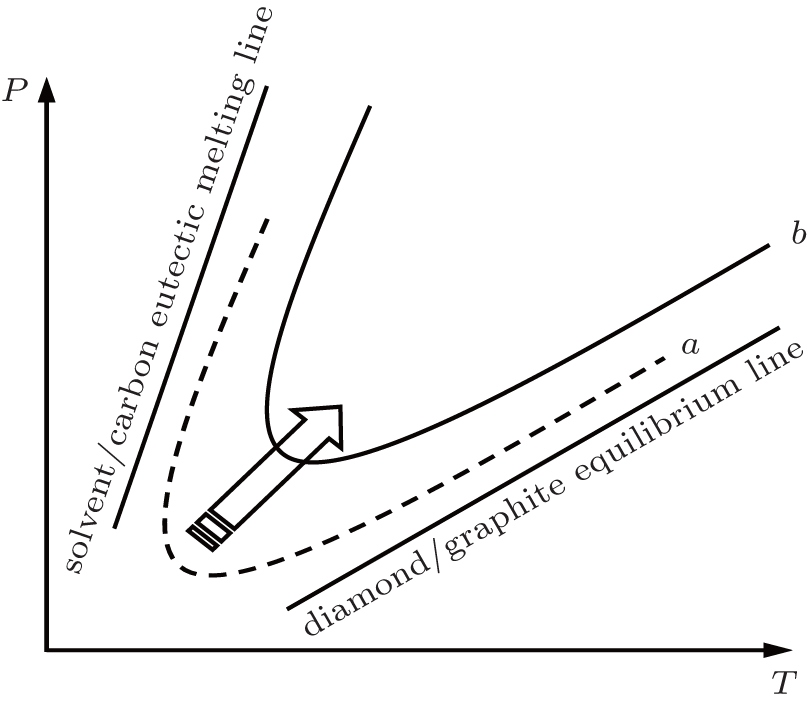
Generally, in the Pressure– Temperature P– T phase diagram of carbon, the district of diamond growth is a V-shape region bounded by solvent– carbon eutectic melting line and diamond– graphite equilibrium line in the metal solvent– carbon system, which is shown in Fig. 2. The solvent– carbon eutectic melting lines are different for diverse solvent– carbon system.[2] In our experiments, the properties of FeNi alloy solvent changed with the addition of additive phosphorus into the growth system of diamond, which results in the moving up of the V-shape regions (curve a moves towards curve b in Fig. 2). The most probable reason is that the FeNi alloy solvent and additive phosphorus may interact with each other under high pressure and high temperature conditions, and the characteristics of FeNi alloy solvent have been changed. In general, this change may increase the pressure and temperature conditions of crystal growth, and increase the energy required to grow the diamond.[8, 12, 13] Our research results are consistent with this.
Fig. 2. Scheme of the movement of V-shape region, curve a: the growth system without additive phosphorus; curve b: the growth system with additive phosphorus.
3.2. Morphology and inclusions of diamond crystals grown from the FeNi-P-C system
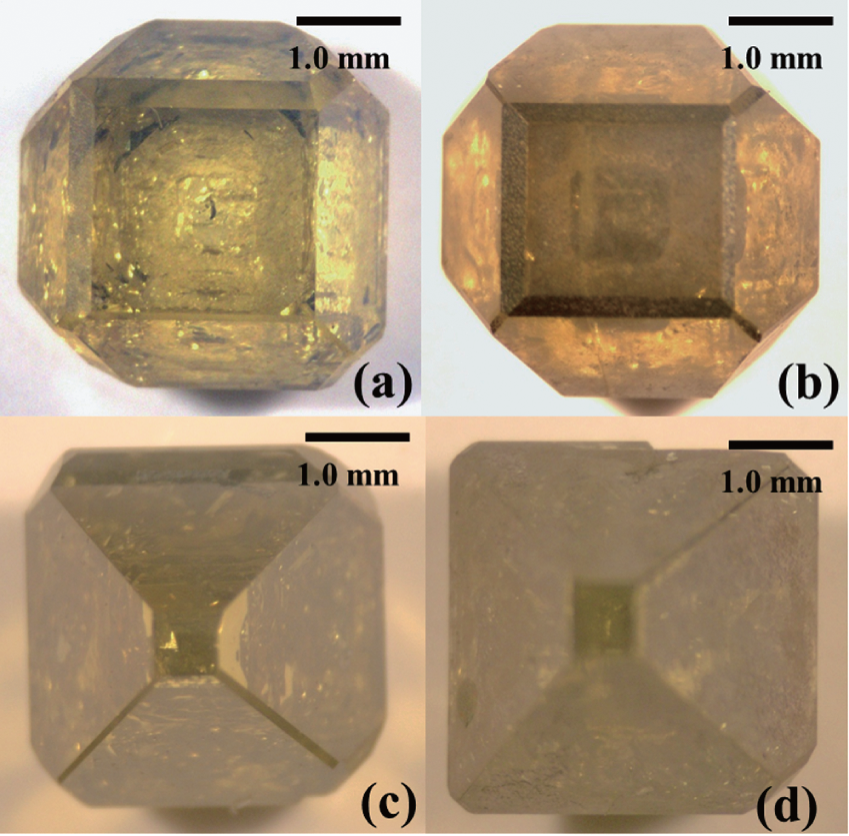
According to the above results, the pressure and temperature conditions for diamond growth obviously changed with the increase of additive phosphorus content. Figure 3 shows photographs of the diamond crystals from the FeNi-C system with different contents of additive phosphorus. Figure 3(a) shows the diamond crystal obtained in the absence of additive phosphorus. The crystal is yellow in color and has nearly no inclusions. As shown in Fig. 3(b), the diamond obtained in the presence of 0.5 wt% additive phosphorus, the crystal is dark in color and visible inclusions trapped in diamond crystals can be found easily. When additive phosphorus is up to 1.0 wt% , the obtained diamond is a deep dark color and has a bad transparence, which is shown in Fig. 3(c). At the same time, the content of inclusions increases with the increase of additive phosphorus. It can be seen in Fig. 3(d) that when the content of additive phosphorus is up to 1.5 wt% , the obtained diamond is of poor quality with more inclusions.
Fig. 3. Photographs of diamond crystals from the FeNi-C system with different additive phosphorus contents: (a) 0 wt% ; (b) 0.5 wt% ; (c) 1.0 wt% ; (d) 1.5 wt% .
3.3. SEM photographs of the diamond crystals
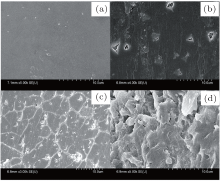
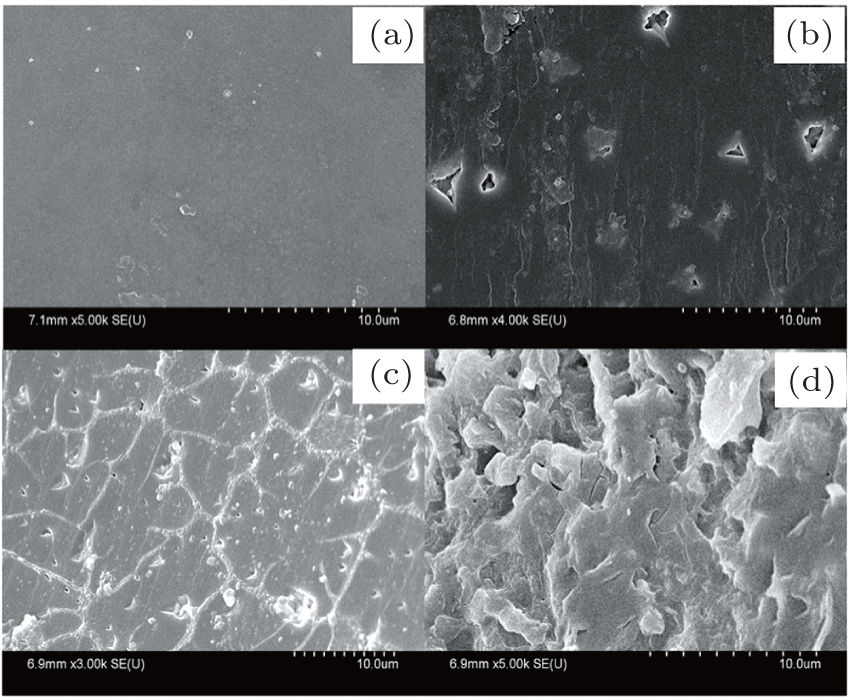
The surface characteristics of the diamond crystals from the FeNi-P-C system were analyzed by SEM. The SEM photographs of diamond crystals with different contents of additive phosphorus are shown in Fig. 4. It can be obviously seen that the integrality of diamond surfaces has been destroyed due to the introduction of additive phosphorus in the FeNi-C system. The surface of diamond crystal is smooth with a few pits (Fig. 4(a)), in which the growth system is in the absence of additive phosphorus. As shown in Fig. 4(b), there are more pits. A netlike growth texture appears as the additive phosphorus grows up to 1.0 wt% , as can be seen in Fig. 4(c). When additive phosphorus increases up to 1.5 wt% , the surface of diamond crystal becomes rougher, which is shown in Fig. 4(d). That is to say, the introduction of additive phosphorus reduced the quality of the diamond crystals. We believe that these results can be explained as follows. Some phosphorus dissolved in the FeNi solvent catalyst and made this alloy composition change. FeNi solvent catalyst with additive phosphorus was easily embedded in diamond crystals and formed the inclusions. The inclusions on the surface of diamond crystal were dissolved into the solution of nitric acid and sulfuric acid, and so pits remained on the diamond surfaces. At the same time, the appearance of pits on diamond surface would be more serious with the increase of phosphorus content in the growth system.
Fig. 4. SEM photographs of diamond crystals with different additive phosphorus contents: (a) 0 wt% ; (b) 0.5 wt% ; (c) 1.0 wt% ; (d) 1.5 wt% .
3.4. Raman spectra of diamond grown from the FeNi-P-C system
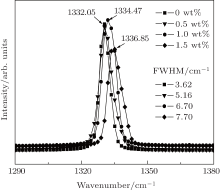
Raman spectroscopy was used to characterize the crystal defects or crystalline quality of diamond crystals. Figure 5 shows the Raman spectra of recorded diamond crystals from the FeNi-C system with different contents of additive phosphorus. It can be seen that the Raman spectra exhibits a series of system changes with the increase of phosphorus content in the growth system. Firstly, the positions of the maximum of Raman peaks tend to shift toward higher frequencies. The position of the maximum of the Raman peak without additive phosphorus is similar to that with 0.5 wt% additive phosphorus, which may be caused by the measurement error. However, the position of the maximum of the Raman peak with 1.0 wt% additive phosphorus is higher than that with 0.5 wt% . Secondly, the full width at half-maximum (FWHM) is about 3.62 cm– 1 for diamond grown in the system without additive phosphorus, 5.16 cm– 1 for diamond grown in the system with 0.5 wt% additive phosphorus, 6.7 cm– 1 for diamond grown in the system with 1.0 wt% additive phosphorus, and 7.7 cm– 1 for diamond grown in the system with 1.5 wt% additive phosphorus. The FWHMs of the diamond crystals become broader with the increase of the content of additive phosphorus. It is supposed that the observed features of the Raman spectra of diamond crystals from the FeNi-P-C system are related to impurities, residual stress, or defects, etc. Therefore, this illustrates that the diamond crystals grown from the FeNi-P-C system have more crystal defects and the quality is poorer than those from ordinary FeNi-C system.
Fig. 5. Raman spectra of diamond crystals with different contents of phosphorus.
4 Conclusions
Diamond crystals have been synthesized in the FeNi-carbon system with additive phosphorus at high pressure and high temperature conditions. The pressure and temperature conditions of diamond synthesis increase with the increase of phosphorus content and this results in the moving up of the V-shape region. Pits or netlike growth texture appear on the surfaces of the diamond and inclusions are trapped easily in diamond crystals. Raman spectra indicate that the diamond crystals grown from the FeNi-C system with additive phosphorus have more crystal defects and the quality is poorer than those from an ordinary FeNi-C system. Next, we need to improve the synthetic process, enhance the quality of diamond crystals, and then characterize the physical and chemical properties of the synthesized diamond with additive phosphorus.
LiS S, MaH A, LiX L, SuC, JiaX P, MaH A, HuangG F and LiY2011Chin. Phys. B20028103DOI:10.1088/1674-1056/20/2/028103[Cited within:1][JCR: 1.148][CJCR: 1.2429]
... [2] In our experiments, the properties of FeNi alloy solvent changed with the addition of additive phosphorus into the growth system of diamond, which results in the moving up of the V-shape regions (curve a moves towards curve b in Fig ...
1
2011
1.148
1.2429
1
1997
1.709
0.0
... 4] Some of these properties may be influenced by the impurities incorporated in the diamond lattice ...
Effects of an ultra-strong magnetic field on electron capture rates for Co-55 are analyzed in the nuclear shell model and under the Landau energy levels quantized approximation in the ultra-strong magnetic field, and the electron capture rates on 10 abundant iron group nuclei at the surface of a magnetar are given. The results show that electron capture rates on Co-55 are increased greatly in the ultra-strong magnetic field, by about 3 orders of magnitude generally. These conclusions play an important role in future study of the evolution of magnetars.
Du Jun 1 ;Li Ping-Ping 1 ;Luo Xia 1,2 ;
Effects of ultra-strong magnetic field on electron capture rates for 55 Co are analyzed in the nuclear shell model and under the Landau energy levels quantized approximation in the ultra-strong magnetic field, and the electron capture rates on 10 abundant iron group nuclei at the surface of magnetar are given. The results show that electron capture rates on 55 Co are increased greatly in the ultra-strong magnetic field, by about 3 orders of magnitude generally. These conclusions play an important role in future studying the evolution of magnetar.
Abstract In this paper, high quality green industrial diamond crystals were synthesized from the system of Fe 70 Ni 30 –graphite with additive Ba(N 3 ) 2 in a china-type large volume cubic high-pressure apparatus (CHPA). FTIR spectra show that the highest nitrogen concentration in the synthesized diamond crystals is up to approximately 2400 ppm. The synthetic diamond crystals exhibit green or deep green color. The shape of synthetic crystals is mainly cub-octahedron. Partial strip crystals are also observed, which may be formed from the stretched cub-octahedron having elongated (100) and (111) crystal faces. It is also found that the synthesis conditions (temperature and pressure) increase with the increasing quantity of Ba(N 3 ) 2 additive.
... [8,12,13] Our research results are consistent with this ...
1
2009
3.794
0.0
... 9] Diamonds with additive phosphorus exhibiting n-type semiconductor properties have been produced by CVD methods ...
1
1997
3.794
0.0
... [10] ...
1
2011
4.689
0.0
... C,[11] and it is confirmed that these diamonds contained phosphorus as the impurity in the crystal lattice ...
Abstract Sulfur was introduced to the synthesis of industrial diamonds using Ni 70 Mn 25 Co 5 alloy powder as catalyst. Optical microscope, XRD, XPS, and SEM were utilized for observation and detection. The influences of additive sulfur on the synthesis have been investigated from several aspects such as the diamond-forming conditions, the composition of synthesized sample and inclusions in diamond, and the morphology character of diamonds etc. The results indicate that the formation of MnS, which should have been in a solid state during the synthesis, has an important influence on the synthesis of industrial diamonds.
... [8,12,13] Our research results are consistent with this ...
Abstract In this paper, the effects of the additive NaN 3 -added in powder catalysts to synthesize nitric diamond were studied in a cubic anvil high-pressure and high-temperature apparatus (SPD-6 × 1200). Diamond crystals with perfect shape were successfully synthesized using NaN 3 -added Fe 90 Ni 10 catalyst under pressure 5.4 GPa and temperature 1600 K for 15 min. The temperature and pressure of crystals growth were increased with an increase of the content of NaN 3 . The V-shape section for the diamond's growth, which is the region between the solvent/carbon eutectic melting line and diamond/graphite equilibrium line under pressure and temperature, was moved upwards. The synthetic diamonds exhibited perfect cubo-octahedral shape or octahedral shape with green or densely green in color. However, some orderly accidented lines were observed on the surfaces of most of the diamond crystals synthesized with NaN 3 -added in Fe 90 Ni 10 . These lines might be formed during the procedure of crystal growth according to the results of the scanning electron microscope images. Moreover, the Mössbauer spectrometry for these diamonds indicated that the concentrations of inclusions formed by iron in diamonds were changed and iron nitride was detected.
... [8,12,13] Our research results are consistent with this ...
Effects of FeNi-phosphorus-carbon system on crystal growth of diamond under high pressure and high temperature conditions*
[Hu Mei-Huaa)†, Bi Ningb), Li Shang-Shenga), Su Tai-Chaoa), Zhou Ai-Guoa), Hu Qianga), Jia Xiao-Pengc), Ma Hong-Anc)]


 , Bi Ning