1. IntroductionIt is known that gallium oxide (Ga2O3) is an important wide band gap semiconducting material with good chemical and thermal stability. Ga2O3 can crystallize into different polymorphic phases such as rhombohedral α -, monoclinic β -, cubic γ - (spinel), and δ -Ga2O3 phases.[1] Among them, the monoclinic β -Ga2O3 is known to be the most stable form at ambient conditions. It undergoes phase transition from β -Ga2O3 to α -Ga2O3 upon increasing pressure.[2, 3] The α - and β -Ga2O3 has a wide band gap of above 4 eV, which enables it to modify their properties such as transportation, photoluminescence, as well as magnetism by the incorporation of suitable ions in the Ga2O3 lattice.[4– 9] For the β -Ga2O3, the Ga3+ ions are accommodated in non-equivalent tetrahedral and octahedral sites, preferential substitution for Ga3+ ions on either the tetrahedral or the octahedral sites depending on the radius of the impurity ions has been frequently observed. Consequently, the influence of the impurities on the properties of β -Ga2O3 could be complex.[5, 7, 10] In the α -Ga2O3, all the cations reside on the octahedral sites, and it is isostructural with the well-known hematite with a well established high ferromagnetic transition temperature of ∼ 670 K.[11] Thus, Fe3+ ions would be desirable to manipulate the magnetic properties of α -Ga2O3 for the practical application.
Experimental results of α -Ga2− xFexO3 series are encouraging to achieve the non-conventional ferromagnetic semiconductor for room-temperature spintronic applications, including band gap tailoring, photoconductivity, ferromagnetism, multiferroic domain switching, and ferroelectric polarization.[12– 17] However, most of previous work has been focused on the properties of α -Ga2− xFexO3 with an Fe content x higher than 0.5. Kaneko et al. reported the preparation of high crystalline α -Ga2− xFexO3 thin films (0 ≤ x ≤ 2) by mist chemical vapor deposition, and revealed that ferromagnetism occurred at a temperature of ∼ 110 K when x∼ 0.5.[4, 18] Amores et al.[19] reported the synthesis of a solid solution of α -Ga2− xFexO3 with 0 ≤ x ≤ 2 at ambient pressure, and the obtained α phase was shown to be stable only below 400 ° C. However, the solid solution is a mixture of α and β phases when the Fe content is low. The compression experiments showed that the transition of β → α occurred at a pressure as high as 20– 22 GPa at room temperature.[20] However, it has been shown that the pressure required for the stabilization of the metastable α -Ga2O3 can be greatly reduced at elevated temperatures.[21] So far, there are scare reports on the high-pressure synthesis and properties of Fe3+ -doped α -Ga2O3 with the doping level less than 0.5. In the present study, a single phase of Fe3+ -doped α -Ga2− xFexO3 with x ≤ 0.4 is fabricated at high temperature and high pressure to explore the effect of Fe3+ doping on the structural, magnetic, and optical properties of α -Ga2O3.
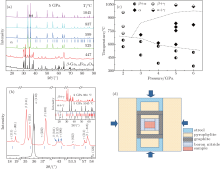
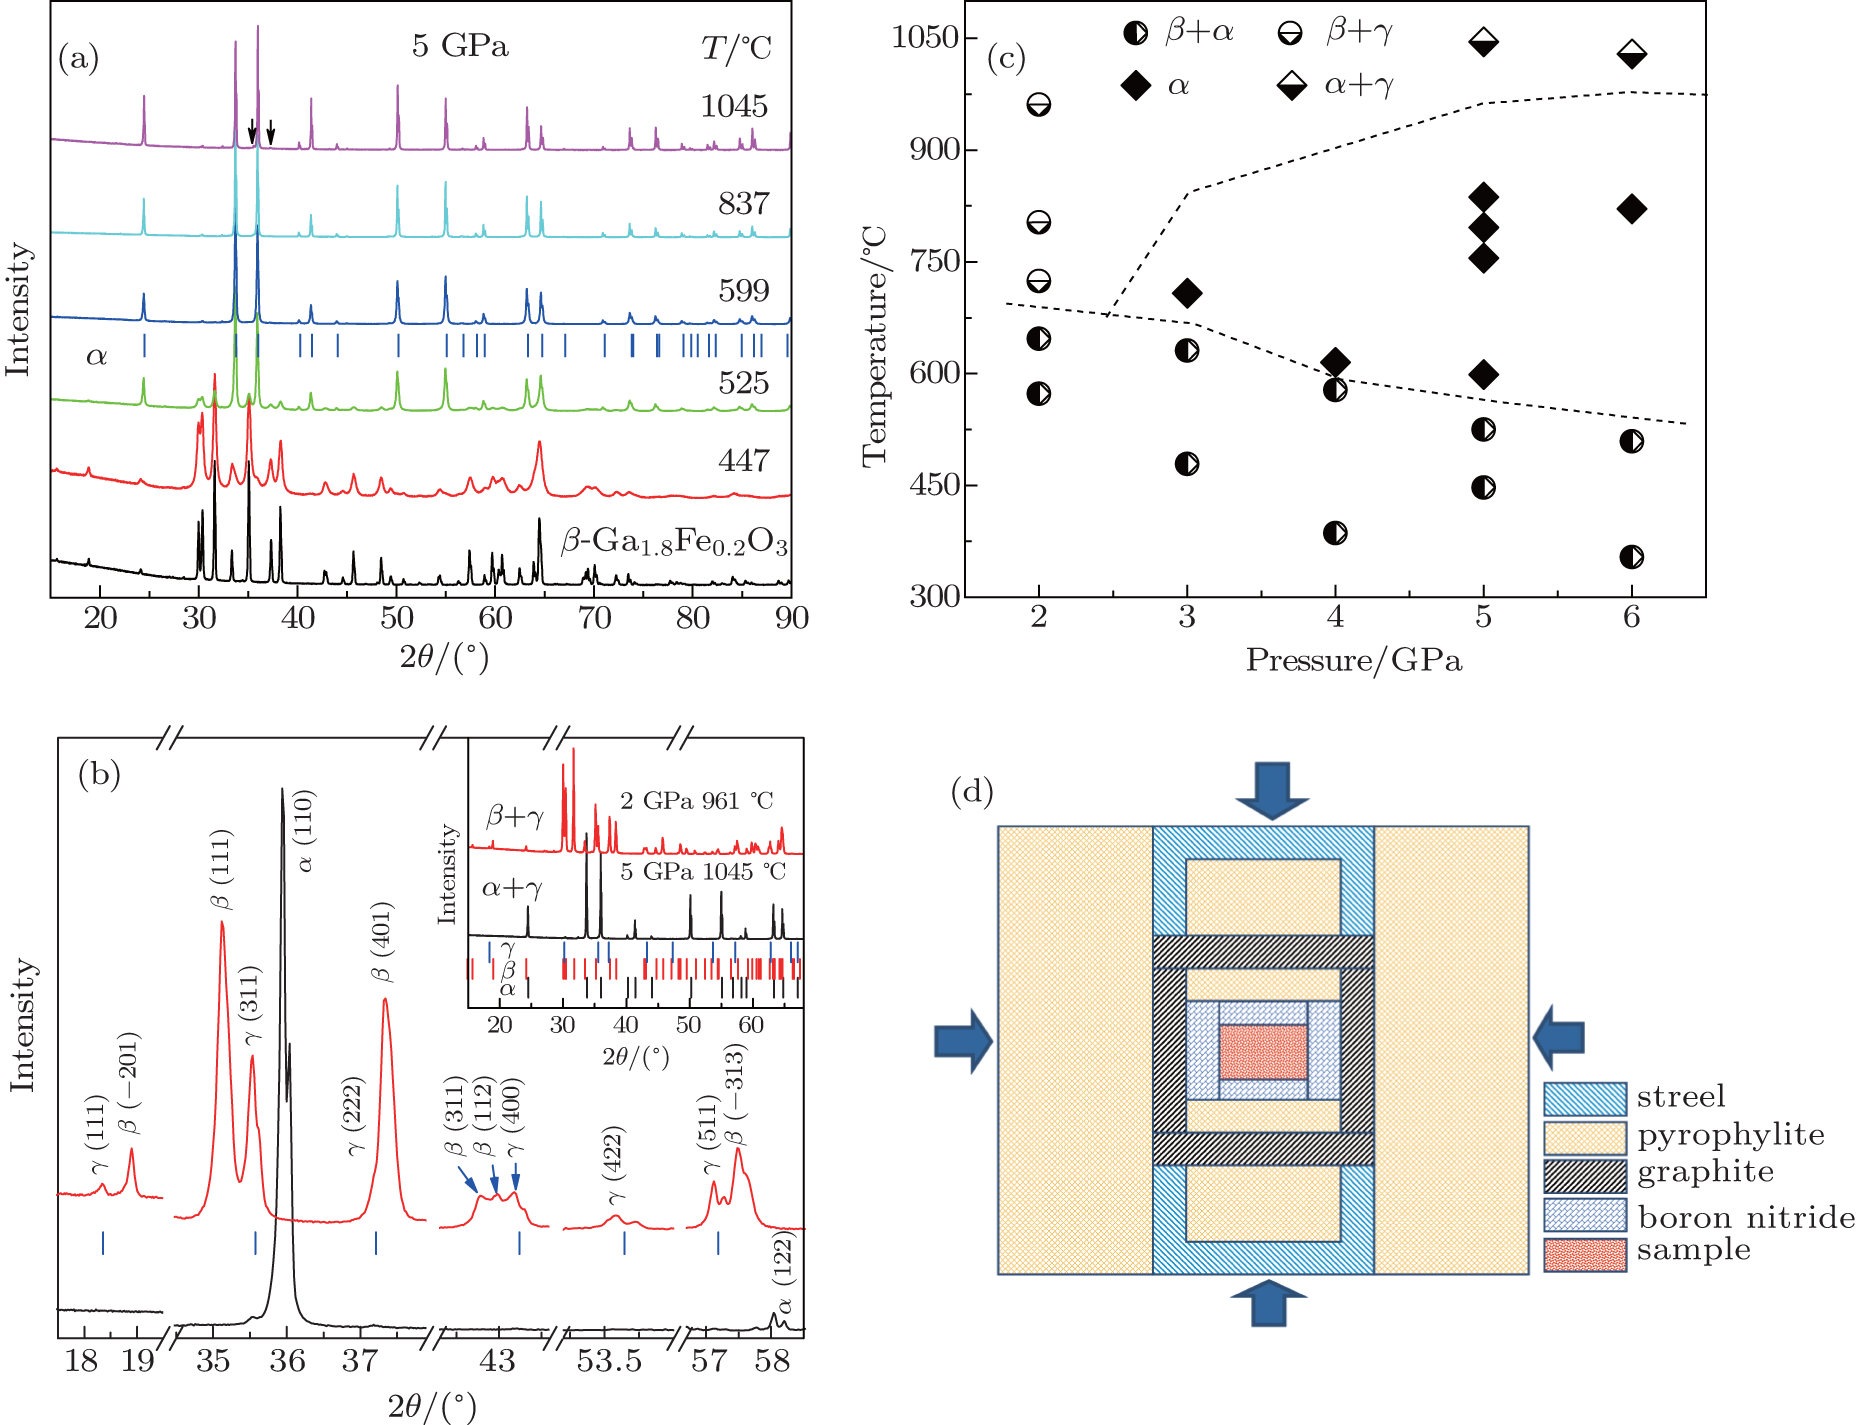
2 Materials and methodsIn order to synthesize the Fe3+ -doped α -Ga2O3, i.e., α -Ga2− xFexO3 (x ≤ 0.4) (refer to α -GFxO thereafter), we firstly synthesized the Fe3+ -doped β -Ga2O3, i.e., β -Ga2− xFexO3 (x ≤ 0.4) (refer to β -GFxO thereafter) as a starting material. The details of the preparation of β -GFxO with x = 0.1, 0.2, 0.3, and 0.4 can be found elsewhere.[22] Briefly, the starting powders of β -Ga2O3 (99.999%, − 325 mesh, Alfa Aesar) and α -Fe2O3 (99.99%, − 325 mesh, Alfa Aesar) were mixed in the designed atomic ratio of Ga to Fe by a vario-planetary ball miller (Pulverisette 4, Fritsch, Germany) at a rotation speed of 200 RPM for 10 hours. After the milling, the obtained mixtures were dried at 90 ° C for 24 hours and subsequently pressed into a pellet of 10 mm in diameter. A single phase of β -GFxO (x = 0.1, 0.2, 0.3, 0.4) was then obtained after sintering in air at 1350 ° C for 10 hours. The α -GFxO (x = 0.0, 0.1, 0.2, 0.3, 0.4) managed to synthesize with the precursors of the as-received β -Ga2O3 and as-prepared bulk samples of β -GFxO (x = 0.1, 0.2, 0.3, 0.4) in a single large-volume cubic anvil press under high pressure and high temperature. The precursors were inserted into the graphite furnace with a pure h-BN layer, which served as a barrier, as shown by the sample assembly in Fig. 1(d). The sample assembly was sintered under compressive pressures of 2– 6 GPa and temperatures of 350– 1050 ° C for one hour, and then allowed to cool rapidly to room temperature.
The as-sintered samples were carefully polished to remove any possible contamination from the barrier, and then ground for the structure characterization, which was performed by powder X-ray diffraction (XRD) with Cu Kα radiation (PC/Dmax 2500, Rigaku, Japan). The XRD spectra were analyzed via the Rietveld refinements using software package of FullProf Suite (v2.05).[23] The Calorimetric measurements were conducted on the ground powder by a simultaneous thermal analyzer (STA 449C Jupiter, Netzsch, Germany) with a heating rate of 10 ° C· min− 1 under the atmosphere of high-purity air. The magnetic measurements were carried out using a vibrating sample magnetometer attached to the PPMS (Quantum Design, USA). The diffuse reflectance was measured using a UV– Vis spectrophotometer equipped with an integrating sphere (UV-2550, Shimadzu, Japan). The reference sample is barium sulfate (Wako 1st grade, Wako Pure Chemical Industries, Ltd., Japan).
3 Results and discussionIn order to elucidate the required pressure and temperature for the preparation of single phase of Fe3+ -doped α -Ga2O3 from the starting powder of Fe3+ -doped β -Ga2O3, a concentration of 10 at% Fe3+ was chosen (i.e., β -Ga1.8Fe0.2O3 or β -GF0.2O) and treated at different temperatures and pressures. Figure 1(a) shows the collected powder XRD spectra at room temperature for the sintered β -GF0.2O under a compressive pressure of 5 GPa with different temperatures. With the increase in temperature, diffraction lines of β -GF0.2O (PDF# 41-1103) were observed to decrease in intensity and broaden in width, disappeared at ∼ 599 ° C. Bragg peaks of α -GF0.2O (PDF# 06-0503) were observed to appear at ∼ 447 ° C and increases in intensity upon increasing temperatures. The β -GF0.2O was completely transformed to α -GF0.2O at a temperature higher than 599 ° C. The observed transition of β → α at elevated temperatures is in good agreement with previous reports.[21] However, we find that the temperature required for the synthesis of single phase of α -GF0.2O is as low as ∼ 600 ° C, which is quite low in comparison with that reported in Ref. [21]. A new set of diffraction peaks appears beside those of the α -GF0.2O (Fig. 1(c)) when the temperature is increased to 1045 ° C, which is close to the limitation of the safety temperature of our apparatus. These peaks coincide well with the diffraction lines of spinel-type γ -Ga2O3 (PDF# 20-0426), except for a downshift of the diffraction lines due to the larger radius of Fe3+ . Various pressures and temperatures were tried to treat the starting powder of β -GF0.2O, and the XRD data of these samples were analyzed and summarized in Fig. 1(b). It demonstrates that the temperature window for the synthesis of single α -phase is narrowed down when decreasing the sintering pressure. By decreasing the pressure to 2 GPa, there is no single phase of α -GF0.2O observed, and the as-prepared sample shows a mixture of either β + α or β + γ .
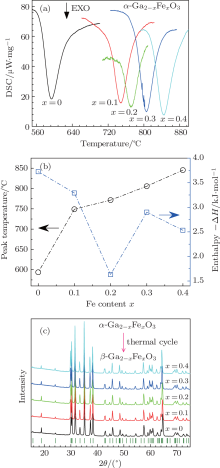
According to the temperature– pressure (T– P) phase diagram shown in Fig. 1(b), the sintering pressure and temperature are chosen to be 5 GPa and 850 ° C, respectively, for the synthesis of single phase of α -GFxO with x = 0, 0.1, 0.2, 0.3, and 0.4. Figure 2(a) shows the collected powder XRD spectra at room temperature for the sintered α -GFxO samples, confirming the single phase of corundum-type structure of undoped and Fe3+ -doped samples. The enlarged diffraction peaks of (110) in the inset of Fig. 2(b) display clearly that the diffraction peaks shift consistently towards the lower angle with the increase of Fe3+ content, demonstrating the expansion of lattice constants induced by the successful replacement of Ga3+ by Fe3+ . The Rietveld refinements with consideration of the corundum R-3c symmetry were carried out on the XRD spectra of the Fe3+ -doped and undoped α -Ga2O3. As a typical example, the experimental and calculated XRD spectra for α -GF0.2O are shown in Fig. 2(b). For all the synthesized samples, the calculated spectra are in a good agreement with the experimental ones, with the agreement factors of the weighted profile factor and the goodness of fitting larger than 10 and 6, respectively. For the as-prepared α -Ga2O3, the lattice parameters a and c, and the unit cell volume are determined to be 4.9814(5) Å , 13.4327(3) Å , and 288.671(3) Å 3, respectively, which are consistent with previous report.[21] The lattice constants of a and c, and the unit cell volume increase upon increasing the Fe3+ content (Fig. 2(c)), demonstrating the doping-induced structural expansion along the different axes.
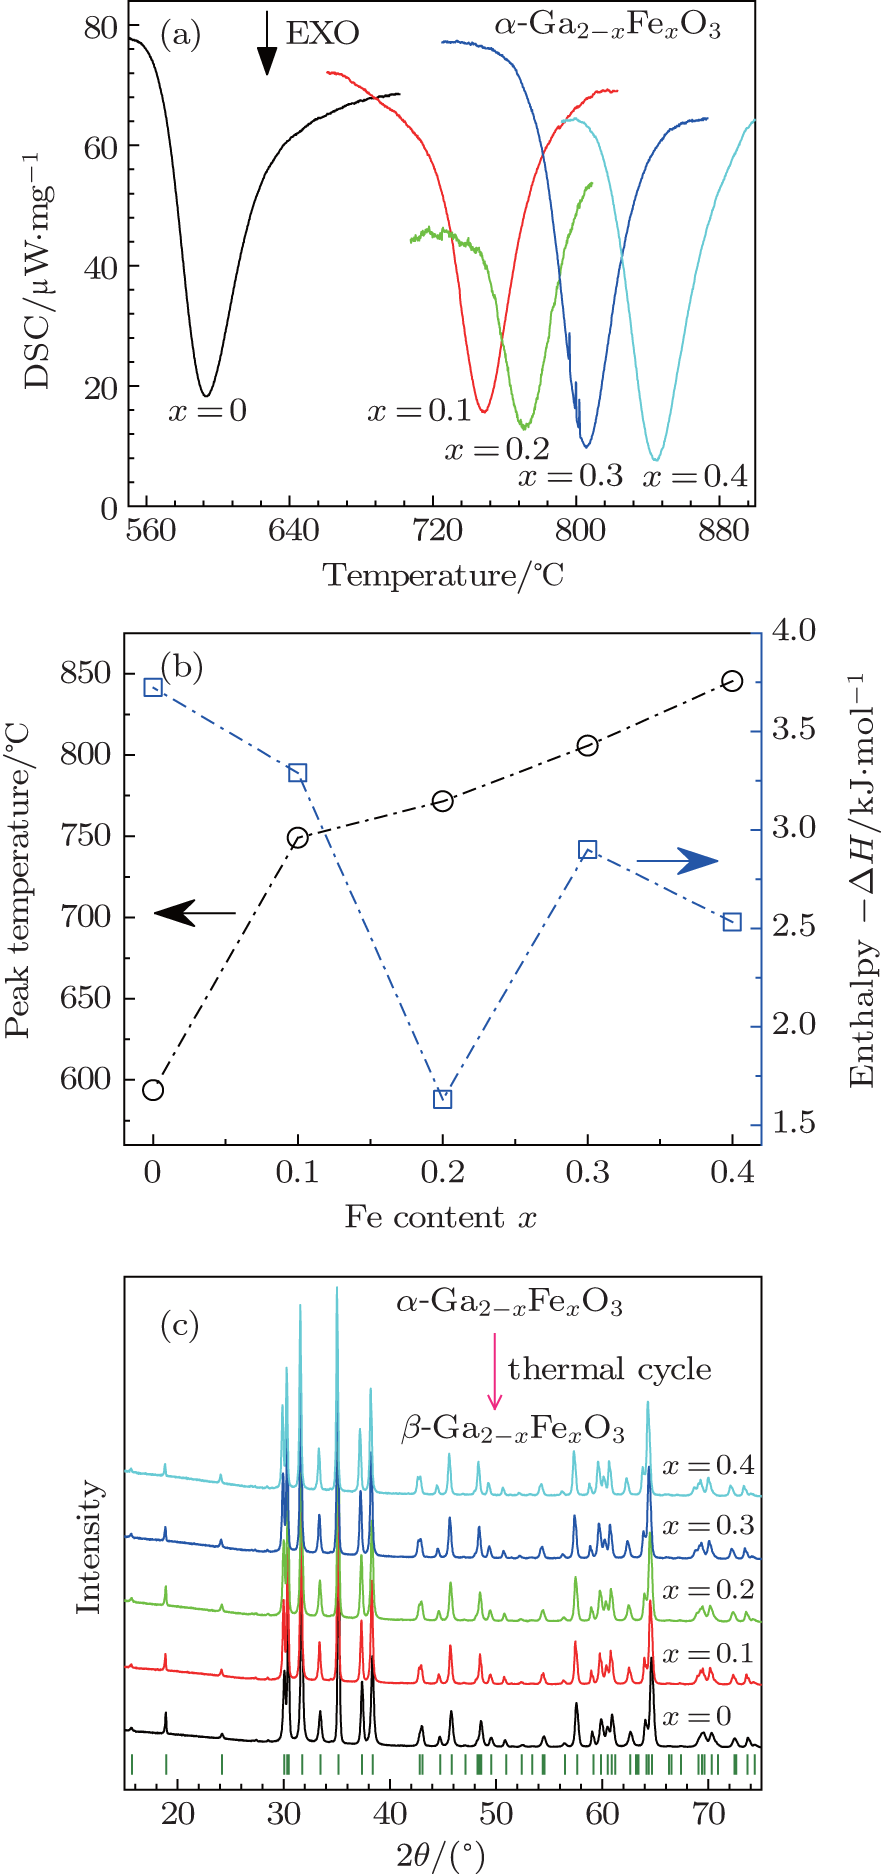
To investigate the thermostability of sintered α -GFxO, we employ a differential scanning calorimetry (DSC) for samples of α -GFxO (x = 0, 0.1, 0.2, 0.3, 0.4) in the temperature range from room temperature to 1100 ° C. No appreciable changes of the thermogravimetry (TG) signals are found over the entire temperature range for investigated samples. For the undoped and Fe3+ -doped α -Ga2O3 samples, there is only one exothermic peak observable from room temperature to 1100 ° C. The exothermic peak was observed to occur at an onset and peak temperature of ∼ 560 ° C and ∼ 594 ° C respectively for the undoped α -Ga2O3, and they were found to shift toward higher temperature with the increase of Fe3+ content (Fig. 3(c)). After one thermo-cycle, XRD results show that the final product is single phase of β -GFxO with a monoclinic structure (Fig. 3(c)). Thus, the exothermic peaks are attributed to the transition of the metastable α -GFxO to the stable β -GFxO. The area of the exothermic peak, which corresponds to the enthalpy change Δ H associated with the transition of α -GFxO→ β -GFxO, is determined to be ∼ – 3.7 kJ· mol- 1 for the undoped α -Ga2O3, being in a reasonable agreement with the theoretical expectation at 5 GPa.[24] It decreases with the increase of Fe3+ content (Fig. 3(b)), being indicative of the decreased energy difference between the Helmholtz free energy of β -phase and α -phase, which is consistent with the theoretical expectation.[24]
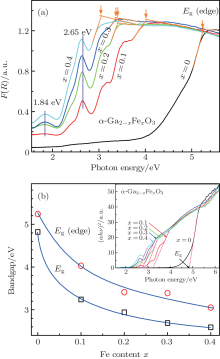
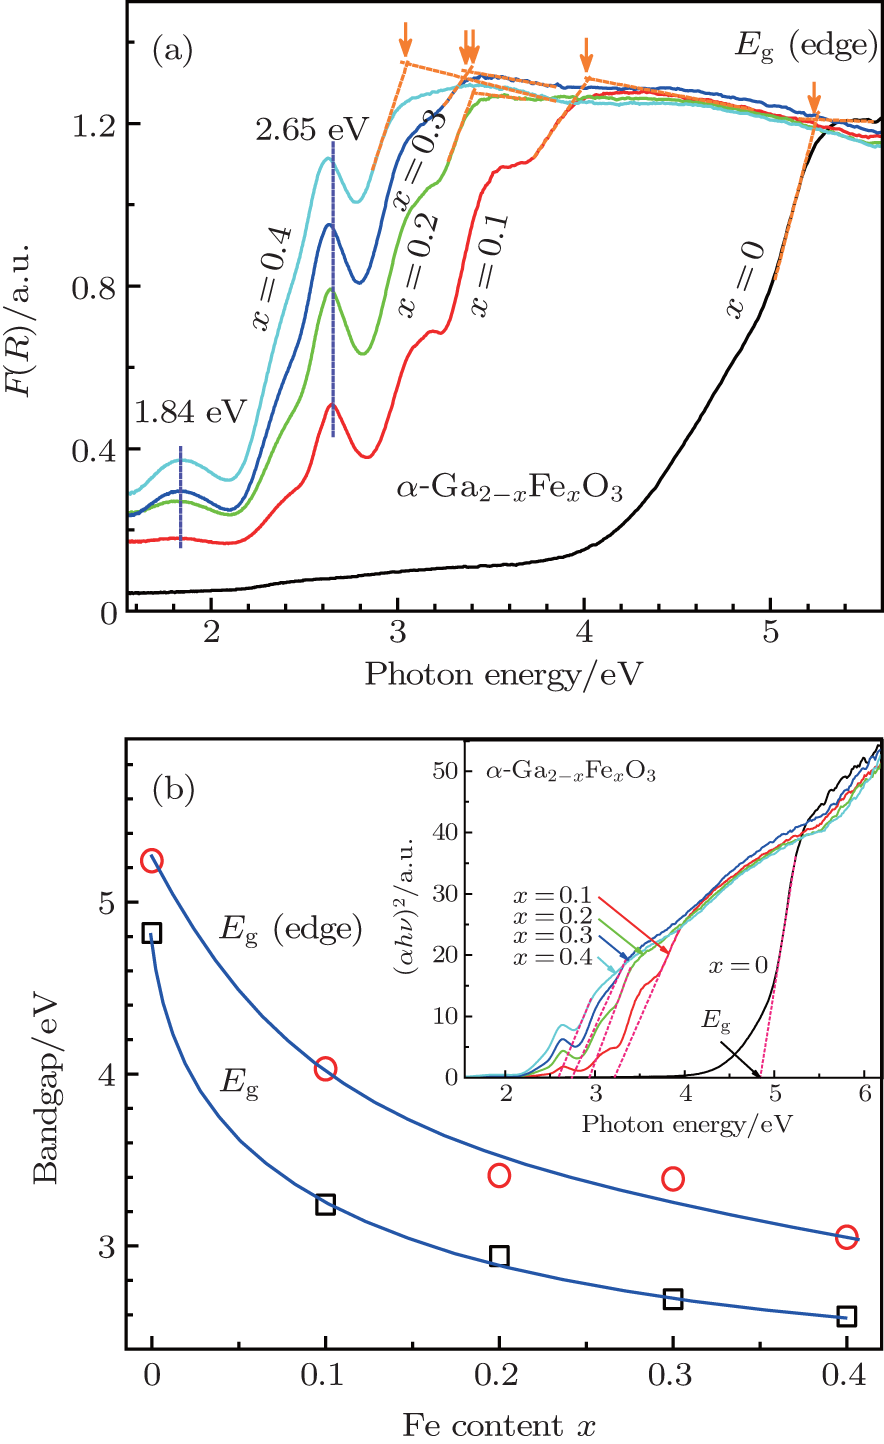
The doping of Fe atoms into the Ga sites of α -Ga2O3 structure is further confirmed from the absorption spectra of the samples in UV– Visible range (200– 1000 nm). The required relative diffuse reflectance spectra R refering to the BaSO4 standard of the undoped α -Ga2O3 and Fe3+ -doped α -GFxO samples were converted to the Kubelka– Munk functions F(R) (= (1 − R)2/2R) and shown in Fig. 4(a), where F(R) is proportional to the absorption coefficient.[25] For the undoped α -Ga2O3 sample, a strong absorption edge is observed to occur at Eg (edge) ∼ 5.3 eV. With the increase of Fe3+ concentration, the absorption edge shifts systematically toward lower energy (Fig. 4(b)). For the Fe3+ -doped α -GFxO, a number of subspectra are observed below the absorption edge, which is consistent with the previous report.[19] In the octahedral environment of Fe3+ ions (i.e., FeO6) five-fold degeneracy of d orbital splits into low-energy t2g and higher-energy eg levels. Transition of electrons between these levels contributes to absorption bands in the UV– Vis region. Among these subspectra, the bands at ∼ 1.8 eV and ∼ 2.6 eV are well defined and found to shift toward a lower energy with the increase of Fe3+ content. They are ascribed to the electronic transitions of 6A1g (6S) → 4T2g(4G) and 6A1(6S) → 4T2g(4D) of Fe3+ respectively, according to previous work on oxides containing Fe3+ and Mn2 + (3d5).[26, 27, 28]
In order to determine the room-temperature optical bandgap (Eg) of the undoped α -Ga2O3 and Fe3+ -doped α -Ga2− xFexO3 samples, we use the relational expression proposed by Tauc et al.[29] in conjunction with the Kubelka– Munk function for a semiconductor, hν F(R) ∝ A(hν − Eg)m / 2, where h is the Planck constant, hν the incident photon energy, m is related to the nature of transition and is 1 or 4 for a direct or indirect allowed transition, and A the proportional constant independent of the photon energy. For the pure α -Ga2O3 and α -Fe2O3, or Ga-doped Fe2O3, it was reported that the band gaps are of direct transition, [12, 30, 31] and we take the assumption of direct transition for the Fe3+ -doped α -Ga2O3. Therefore, the energy intercept of Tauc plot[32] of (F(R)× hν )2 versus hν gives Eg for a direct allowed transition when the linear region is extrapolated to zero ordinate, as indicated in the inset of Fig. 4(b). The determined Eg for the undoped α -Ga2O3 is ∼ 5.3 eV, being consistent with the published values of 4.9– 5.6 eV.[9, 30, 31, 33] Upon increasing the Fe3+ concentration, Eg is found to decrease monotonically (Fig. 4(b)), reaching a value of ∼ 2.9 eV of the sample with the Fe3+ concentration x = 0.4. The decrease of optical energy gap and red shift of absorption band indirectly confirm the doping of Fe into α -Ga2O3 structure.
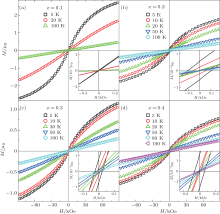
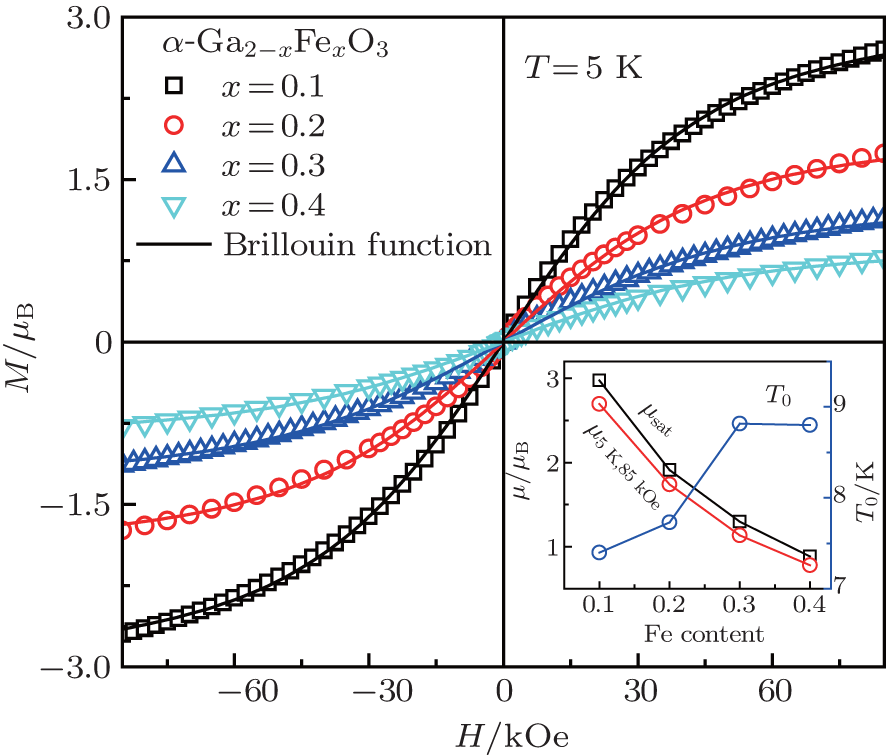
Figures 5(a)– 5(d) show the DC magnetization M versus magnetic field H curves measured at different temperatures for α -GFxO with x = 0.1, 0.2, 0.3, and 0.4, respectively. For the sample of α -GF0.1O, no magnetic hysteresis is detectable (inset of Fig. 5(a)). It does not behave in a paramagnetic way at low temperature since the plot of M as a function of the ratio of H to T does not comply with the Langevin theory of paramagnetism. When the Fe3+ concentration x is increased to 0.2 or higher, remnant magnetization is observed (inset of Figs. 5(b)– 5(d)). The slanted hysteresis diagrams of the remnant fields versus applied field are similar to ferromagnetic diagrams. However, for all the samples with the Fe3+ content higher than 0.2, the coercive field of ∼ 10 mT and the remanence on an order of ∼ 10− 3μ B per Fe3+ ion are obtained. The hysteresis loop is reduced with increasing temperature and vanishes at ∼ 30 K. Such a small magnetic moment, however, cannot be explained as a simple ferromagnetic ordering of localized spins but a frozen ferromagnetic moment in the spin-glass state.
The inset of Fig. 6 is the inverse susceptibility of  as a function of temperature for samples of α -GFxO. In the high temperature range, displays the linear variation with temperature in the range of 150– 300 K, following the Curie– Weiss law. Moreover, the extrapolation of the fitting lines show positive intercepts, demonstrating an antiferromagnetic coupling between the Fe3+ ions in α -Ga2− xFexO3.
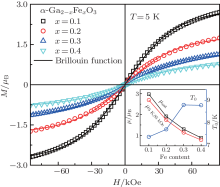
In order to investigate the antiferromagnetic coupling in the diluted magnetic semiconductors, a modified Brillouin function is used to describe the magnetization behavior by introducing the effective temperature (Teff) and the effective saturation magnetization (μ sat) per magnetic ion or the effective concentration (xeff) of magnetic ions.[34, 35] For the Fe3+ -doped α -GFxO, the modified Brillouin function.[34]M = (xNAμ sat/mx) B5/2(5/2gμ BH/kBTeff) is used to fit the measured M versus H curves at 5 K for α -GFxO, where g = 2, μ B is the Bohr magneton, NA and kB are Avogadro and Boltzman constants, respectively, x is the Fe3+ concentration, and mx is the molar mass of α -GFxO. Teff = T+ T0 and μ sat are used as the fitting parameters, which can be used to reflect the antiferromagnetic superexchange interaction between the Fe3+ ions.[35] Figure 7 shows that the fitting is in good agreement with the measured M versus H curves at 5 K for α -GFxO, and the, inset, shows, the, obtained, T0, and μ sat as a function of the Fe3+ content x. In the sublattice of α -GFxO, if two Fe3+ ions via an intermediate oxygen ion forms an antiferromagnetic pair of Fe3+ – O– Fe3+ , their moments can be cancelled and make no contribution to the measured magnetization. Only the uncoupled Fe3+ ions can be aligned in the applied magnetic field, according to the Brillouin function with Teff greater than the real temperature T or positive T0. Thus, the obtained value of μ sat smaller than 5.92μ B and the positive T0 indicate that a fraction of Fe3+ ions form the Fe3+ – O– Fe3+ pairs with antiferromagnetic superexchange interaction. At 5 K, the saturation cannot be obtained at the magnetic field of 85 kOe. Thus, the measured magnetic moment per Fe3+ ion at 5 K and 85 kOe is smaller than the effective saturation moment μ sat obtained from the fitting, but they show similar dependence on the Fe3+ content x. With the increase of the Fe3+ content x, the decrease of μ sat is suggestive of the formation of more Fe3+ – O– Fe3+ pairs with the antiferromagnetic superexchange interaction. Moreover, T0 is found to increase with the increase of Fe3+ content x. These behaviors of the obtained μ sat and T0 indicate that the antiferromagnetic interaction between the magnetic ions becomes stronger with the increase of the Fe3+ content.[35]
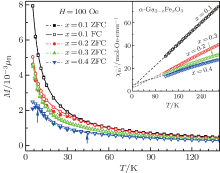
Figure 6 shows the temperature dependence of zero-field cooling (ZFC) and field cooling (FC) of the DC magnetization measured in the magnetic field of 100 Oe for α -GFxO with x = 0.1, 0.2, 0.3, and 0.4. For the sample of α -GaF0.1O, the ZFC curve coincides with the ZFC curve. Irreversible magnetization (splitting of ZFC and FC magnetization) is observed to occur at the temperature of ∼ 33 K for x = 0.2 and shifts slightly towards higher temperature with the increase of Fe3+ content, and at ∼ 42 K when x = 0.4. This is consistent with the previous reports that the spin freezing temperature increases with the increased concentration magnetic ions.[36] In addition, for the sample of GF0.4O, a second splitting of ZFC and FC magnetization is observed to occur at a lower temperature of ∼ 7.2 K.
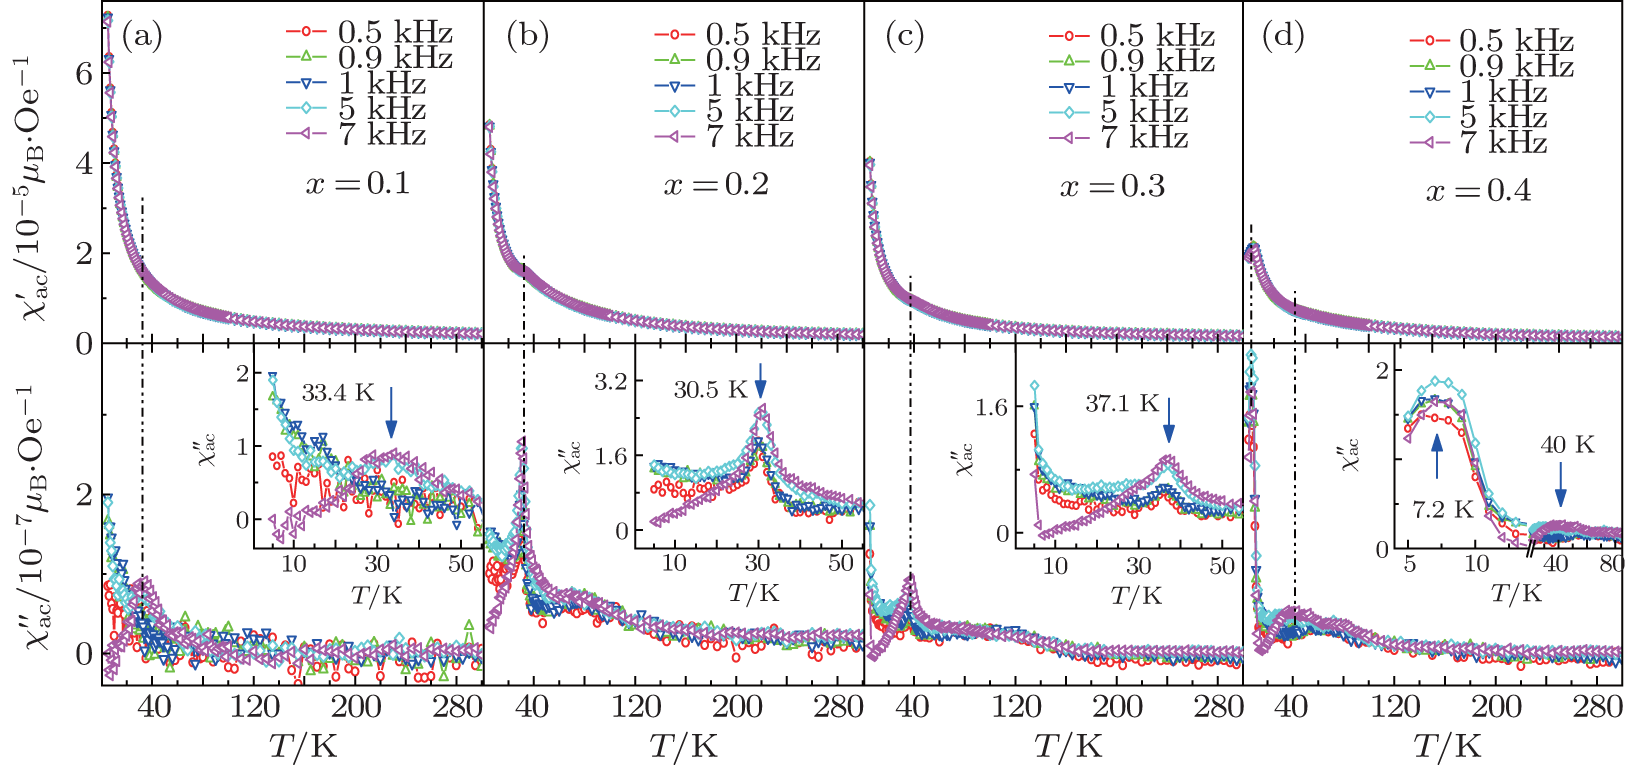
Temperature-dependent AC susceptibility is measured to investigate the dynamics of the magnetization of the spontaneous magnetic behaviors of the Fe3+ -doped α -GFxO. Figure 7 shows the real part  and imaginary part
  of AC susceptibility χ ac measured at the temperatures of 5– 300 K and frequencies of 0.5, 0.9, 1.0, 5, and 7 kHz for α -GFxO (x = 0.1, 0.2, 0.3, 0.4). The real part at 5 K decreases in amplitude with the increase of Fe3+ content (top panels of Figs. 8(a)– 8(d)). Small shoulders of could be distinguished at the temperature when the maxima of occurs, and show very weak frequency dependence. For sample GF0.1O, noticeable anomalies of are observed to occur at a temperature of ∼ 33 K when the frequency is higher than 1 kHz (Fig. 8(a)), though no evident splitting of the ZFC and FC magnetization is observed. As the Fe3+ content increases to x = 0.2, as shown in the inset of bottom panel of Fig. 8(b) for sample GF0.2O, noticeable anomalies occur in at ∼ 30 K, which is close to the spin freezing temperature of the sample α -GF0.2O (Fig. 6). The anomaly in shows a clear frequency dependence in amplitude and a very weak frequency dependence in temperature, which can be attributed to the entrance of spin glass.[37– 39] With the increase of Fe3+ content, the anomaly in measured at 7 kHz is found to decrease in amplitude and shift toward higher temperatures. For the sample GF0.3O, the curves of at all the frequencies turn to increase rapidly at ∼ 8 K with the decrease of temperature (bottom panel of Fig. 8(c)), and presumably the maxima of occur at a temperature below 5 K. This is more evident for the sample GF0.4O (bottom panel of Fig. 8(d)), clear anomalies of and are observed to occur at a lower temperature of ∼ 7.2 K, where the splitting of ZFC and FC magnetization is also observed to occur (Fig. 6). In addition, the anomaly increases in amplitude and shifts slightly to higher temperatures with the increase of frequency. The occurrence of two distinct peaks in as well as two spin freezing temperatures observed in the DC magnetization of GF0.4O indicate the existence of two distinct spin glass states as suggested[40– 43] and also confirm the two phase transition temperatures at ∼ 7.2 K and 40 K.
According to previous work on the anisotropic spin-glasses, .[42, 44– 46] the above-mentioned two spin-glasses transitions observed from paramagnetic state could occur in the presence of random exchange interaction and local uniaxial magnetic anisotropy. On one hand, the α -Ga2O3 is isostructrual with α -Fe2O3, and Ga3+ ions can be unlimitedly substituted by Fe3+ ions with very limited distortion to the crystal structure due to the small difference of the radius of Ga3+ ion and Fe3+ ion. In α -Fe2O3, it is well known that there are two magnetic sublattices with equal moment that interact via an antiferromagnetic coupling, and a small canting of the two sublattices results in weak ferromagnetism between the Morin temperature and the Né el temperature.[47, 48] Thus, it is believed that the incorporated Fe3+ ions on two sublattices are diluted by the nonmagnetic Ga3+ ions and are randomly distributed over the corresponding sublattices. Although they are randomly coupled through the AFM superexchange interactions, these bonds do not make up a periodic structure, and long-range AFM order cannot set in among the moments located in the two sublattices. On the other hand, it was suggested that the easy axis of magnetic anisotropy arises from the magnetic dipole anisotropy and single-ion anisotropy changes during the spin reorientation at the Morin temperature.[47] Such an anisotropy also existed and resulted in a large coercivity in Fe-doped α -Ga2O3.[13] It is shown here that the temperatures associated with spin temperature increase with the increase of Fe3+ ion concentration. We believe that two spin-glasses behavior could occur and be more profound in α -GFxO with the Fe3+ concentration x higher than 0.4, though ferromagnetic ordering was reported to form at x ≈ 0.5.[4, 18] A detailed investigation of the spin dynamics in the Fe3+ -doped α -Ga2O3 (0.4 ≤ x ≤ 0.6) will be discussed.


 , Wen Fu-Sheng, Lv Wei-Ming, Hu Wen-Tao, Liu Zhong-Yuan]