


Synthesis and performance of Zn–Ni–P thin films*
[Soare V.a) , Burada M.a) , Constantin I.a) , Ghita M.a) , Constantin V.b)†  , Miculescu F.
c) , Popescu A. M.b)‡ ]
, Miculescu F.]
|
|

 , Miculescu F.
†Corresponding author. E-mail: popescuamj@yahoo.com
Corresponding author. E-mail: virgilconstantin@yahoo.com
Project support by the Partnership Romanian Research Program (PNCDI2), CORZIFILM Project nr.72-221/2008-2011 and “EU (ERDF) and Romanian Government” that allowed for acquisition of the research infrastructure under POS-CEEO 2.2.1 project INFRANANOCHEM-Nr.19/01.03.2009.
The electroplating of Zn–Ni–P thin film alloys from a sulfate bath containing phosphoric and phosphorous acid was investigated. The bath composition and the deposition parameters were optimized through Hull cell experiments, and the optimum experimental conditions were determined (pH = 2, temperature = 298–313 K, zinc sulfate concentration = 30 g·L−1, EDTA concentration = 15 g·L−1, and current density, = ,1.0–2.0 A·dm−2). The SEM analysis of the coating deposited from the optimum bath revealed fine-grained deposits of the alloy in the presence of EDTA. Optical microscopy analysis indicated an electrodeposited thin film with uniform thickness and good adhesion to the steel substrate. The good adherence of the coatings was also demonstrated by the scratch tests that were performed, with a maximum determined value of 25 N for the critical load. Corrosion resistance tests revealed good protection of the steel substrate by the obtained Zn–Ni–P coatings, with values up to 85.89% for samples with Ni contents higher than 76%. The surface analysis of the thin film samples before and after corrosion was performed by X-ray photoelectron spectroscopy (XPS).
Zinc has a standard reversible potential of − 0.76 V versus the standard hydrogen electrode (SHE), which is lower than that of iron (Fe/Fe2+ = − 0.44 V versus SHE). For this reason, zinc is used in the sacrificial cathodic protection of steel parts against corrosion.[1, 2]
The standard potential difference between Zn and the Fe substrate acts as the driving force for the corrosion of the sacrificial Zn coatings under corrosive conditions. The high value of this difference leads to a rapid dissolution of the zinc coatings. The dissolution rate of the protective coating is considerably reduced by alloying zinc with other elements (Ni, Co, Fe, etc.) that shift the standard electrode potential of the alloy to a value closer to that of the substrate.[3– 6] Among these alloys, Zn– Ni alloys exhibit the best anticorrosive properties, similar to those of cadmium.[7] The electrochemical deposition of Zn– Ni alloys is an anomalous process. Although Ni is nobler than Zn, the co-deposition of these two metals results in obtaining large quantities of Zn in the deposited alloy. An effect of the high Zn concentration is that the alloy dissolution rate is also high under corrosive medium conditions. Various studies and researches were carried for decreasing the anomalous effect of the co-deposition and increasing the Ni content in the alloy, resulting in decreasing the dissolution rate of the anticorrosive alloy coating.[8, 9]
These previous researches were performed mainly in the following directions: using inert species in the deposition bath, inhibiting zinc co-deposition, and developing ternary anticorrosive Zn– Ni– X (X = Cd, Co, P, Si, … ) alloys. Among these, ternary Zn– Ni– P alloys received special consideration since an addition of 1%– 5% P can considerably enhance the corrosion resistance of the Zn– Ni alloys. The deposition of anticorrosive Zn– Ni– P thin films can be performed both by electrochemical deposition and by chemical plating (no current deposition − “ electroless” ).[10– 16]
A variety of testing cells, such as the Hull cell, [17] the rotating Hull cell, [18, 19] and the Haring– Blum cell[20, 21] have been widely employed in the electroplating industry to evaluate the characteristics of the electroplating baths. The Hull cell is used for the optimization of the bath composition and the deposition process parameters such as pH, current density, temperature, additive concentrations, etc.
The goal of this study is the electro-deposition of Zn– Ni– P thin films on low carbon steel substrates, with good corrosion resistance and adherence. The electro-deposition was carried out from acid sulfates solutions with phosphorus and phosphoric acid content. The deposition process was enhanced through the optimization of the bath composition and the operating parameters by Hull cell experiments. Surface morphology analysis techniques (optical microscopy, SEM, XPS), adherence tests, and corrosion studies were used for the characterization of the obtained Zn– Ni– P coatings.
The electrolyte was prepared using Merck analytical reagent grade chemicals and double distilled water. The composition of the electrolyte is shown in Table 1. A Hull cell with a volume of 267 ml was used. A platinum foil was used as the anode in the Hull cell. Mild steel foils of standard Hull cell size (100 mm× 80 mm× 0.6 mm) were used as the cathode. The experiments were carried out without agitation. The pH of the electrolyte solution was adjusted with H2SO4 and/or 20 wt.% NaOH solutions.
| Table 1. Electroplating bath composition. |
The current intensity was calculated with the Hull– Mac Intyre equation

where i is the current density (in units of A· dm− 2); I is the current intensity in the Hull cell circuit (in units of A); and, x is the distance from the high current density end of the cathode plate (in units of cm).
For the Hull cell experiments, the electro-deposition was performed on low carbon steel foils of area 100 mm × 80 mm and thickness 0.6 mm. The steel foils were mechanically polished with emery papers of successively finer grades to obtain smooth surfaces, and degreased by washing with acetone. To remove any adherent oxide layer present on the surfaces, the steel foils were dipped in concentrated H2SO4 solutions at 60 ° C for 1 min and then thoroughly washed with double distilled water. This substrate was introduced in the electroplating bath. After the plating experiments, the foils were rinsed with distilled water.
The surface morphology and the microstructure of the thin films after dying were analyzed using a Philips XL-30-ESEM TMP scanning electron microscope (SEM) equipped with an energy dispersive analysis (EDAX) analyzer. EDAX was used to analyze the elemental distributions in the electrodeposited films. Each sample was measured in seven different locations to confirm uniformity.
The thickness of the film samples was measured using cross-sectional optical analysis with a Zeiss Olympus AxioImager A1m microscope. In order to obtain accurate elemental distributions, EDAX was performed in various points situated along a diagonal of the steel parts.
Surface analyses of the coating samples before and after the corrosion process were performed with X-ray photoelectron spectroscopy (XPS) using a Quantera SXM-Japan equipment. The X-ray source was Al Kα radiation (1486.6 eV), and the energy resolution was estimated to be 0.65 eV by the full width at half maximum (FWHM) of the Au 4f7/2. The acquired peaks in the XPS spectrum were further deconvoluted with a commercial computer program (PHI Multipack version 9.1.0.9.).
For the corrosion characteristics studies, as well as for the optical microscopy and adhesion studies, Zn– Ni– P thin film samples, with a thickness of 15– 20 μ m, were electrodeposited on cathode steel foils (2 cm× 2 cm) in a two electrode set-up cylindrical cell (600 cm3 capacity). The thin films were electrochemically deposited at constant current densities from the optimum electrolyte bath determined by Hull cell experiments. The steel samples for the Hull cell experiments were prepared in a similar manner to the electroplated samples.
After the electrochemical plating, the samples were rinsed with double distilled water and used in experimental corrosion studies in a 3.5 wt.% NaCl solution, without de-aeration, prepared from 99.8% pure chemical reagents supplied by Sigma Aldrich and double distilled water. The salt solution had a pH of 6.483 (measured with IonoLab pH-730, Germany). The corrosion tests were performed using a Princeton Applied Research PAR 273A potentiostat/galvanostat connected to a computer and a three-electrode glass cell. The cell was thermostated and the temperature was maintained constant (± 0.5 ° C) during the experiments. The professional POWERCORR PC software was used for collecting and processing the corrosion data. The coated steel substrate (with a surface of 1 cm2) was used as the working electrode, the auxiliary electrode was a platinum plate (Radiometer electrode, model M-241PT), and the reference electrode was a saturated calomel electrode (SCE, Radiometer-model 451). All of the potentials used in this study are referenced to the SCE potential. In all of the corrosion experiments, the electrochemical polarization was initiated about 30 min after the working electrode was immersed in the test solution, to allow the stabilization of the stationary potential. The working electrode had an exposed area of 1 cm2, and was positioned between the reference and the auxiliary electrodes. The open circuit potential (EOPC) was measured for the samples which were analyzed for at least 30 min. During the open circuit experiments, the time-dependent free currents generated by exposing the sample to the corrosive medium were measured. The polarization resistance (Rp) was measured using potentiodynamic linear polarization at ± 20 mV versus EOCP.[22] To determine the Tafel polarization curves (with high signal), the potential was varied in steps, with a step size of 0.166 mV in a ± 250 mV versus EOCP interval, for 1– 2 h. When plotting the polarization curves, we have taken into account that the prolonged anodic polarization might give rise to changes at the surface roughness, which would imply parallel translation of the Tafel slopes. This effect was eliminated by first plotting the cathodic branches and then the anodic ones.
The adhesion of the Zn– Ni– P thin films electrodeposited on the steel substrates was determined using the scratch test method.[23] In scratch testing, a diamond indenter of standard geometry is drawn on the surface of a coated sample at a constant speed, with a defined normal force over a given distance. The indenter has a standard Rockwell geometry with a 120° angle and a 200 μ m spherical tip. The critical load FNC determined is expressed as the load that corresponds to the failure event. This load is related to the practical adhesion force and the damage resistance of the coating-substrate system. The scratch test parameters are given in Table 2.
| Table 2. Scratch test parameters. |
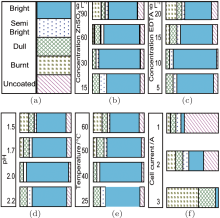
The effects of the deposition bath components and the process parameters on the Hull cell cathode patterns are presented in Fig. 1.
 | Fig. 1. Effect of bath components and process parameters on the Hull cell cathode: (a) main deposition aspects, (b) effect of ZnSO4 concentration, (c) effect of EDTA concentration, (d) effect of pH, (e) effect of temperature, (f) effect of cell current. |
Influence of zinc sulfate (ZnSO4· 7H2O) In order to determine the effect of zinc ions, the zinc sulfate concentration was varied from 15 g· L− 1 to 90 g· L− 1. For a concentration of 30 g· L− 1, which is found to be optimum, a bright coating with a large thickness was deposited. The thin films obtained at zinc sulfate concentrations exceeding 90% exhibited a burnt aspect and had low thicknesses.
Influence of EDTA The concentration of organic (complexing) agent EDTA was varied from 5 g· L− 1 to 20 g· L− 1. At low concentrations, the cathode was coated with a burnt deposit in the high current density area and a dull deposit in the low current density area. At an EDTA concentration of 15 g· L− 1 in the electrolyte, the deposit was bright over a current density range of 0.7– 8 A· dm− 2. With the increase of the EDTA concentration to 20 g· L− 1, no improvement in the deposit was observed (Fig. 1(c)).
Influence of pH To observe the effect of pH, the acidity of the electrolyte solution was varied from 1.5 to 2.5. At low pH, the Hull cathode exhibited a burnt deposit in the high current density area. At a pH of 2, a satisfactory deposit was obtained, with a large bright area. From this observation, the pH of the electrolyte was maintained at 2.0 as an optimum. The Hull cathode patterns are presented in Fig. 1(d).
Effect of temperature To investigate the effect of temperature, the Hull cell experiments were carried out at temperatures of 298– 333 K. At a lower electrolyte temperature, the deposit was bright in the current density range 1.3– 6.0 A· dm− 2. Above 313 K, the bright zone of the deposit was narrowed (Fig. 1(e)). The optimum temperature range was 298– 313 K.
Effect of the cell current The Hull cell experiments were performed at cell currents of 1 A, 2 A, and 3 A for 10 min respectively, using the optimum electrolyte solution and process parameters. It was observed that at a cell current of 1 A, the deposit was bright in the current density range of 1.25– 2.0 A· dm− 2. At a cell current of 2 A, the deposit was bright in the current density range of 0.8– 2.0 A· dm− 2. At a cell current of 3 A, the Hull cell cathode showed a burnt and dull deposit over a large current density range of 2.25– 15 A· dm− 2. This study of the Hull cell current revealed that the electrolyte bath leads to bright deposits in the current density range of 1.0– 2.0 A· dm− 2.
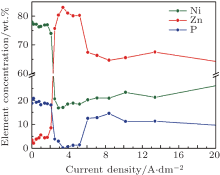
The variation of the element concentrations, determined by EDAX analysis, is presented in Fig. 2 for the electrodeposited Zn– Ni– P coatings on a Hull plate cathode versus the current density (from the high current density end of the plate). At low current densities, the electrochemical deposition of the elements can be considered as normal because the nobler element (Ni) is deposited in a higher quantity. As the current density reaches a certain limit value, the deposition becomes anomalous, since the less noble element (Zn) is deposited preferentially. Beyond the limit value for the current density, the elemental content exhibits a linear evolution.
 | Fig. 2. Variation of the element concentrations in the electrodeposited Zn– Ni– P coatings on a Hull plate versus the current density. |
SEM micrographs showing the surface morphology evolution of the electrodeposited Zn– Ni– P thin films with the current density on the Hull cell cathode are presented in Fig. 3. The surface morphology is homogenous and not porous, with rounded formations. The ZnNiP thin film deposits are very fine at low current densities (0.1– 0.5 A· dm− 2), while by rising the current density (1.0– 3.9 A· dm− 2), the deposition film is revealed with local developments as spheres with a “ cauliflower” aspect of different sizes. An uneven cauliflower aspect appears at current densities of 4.5– 8.4 A· dm− 2 and the structure becomes more irregular, and is almost destroyed at higher current densities (8.4– 13.4 A· dm− 2). An uneven crystal growth is observed, with acicular structure, particular for metals deposited at high current density 20.7 A· dm− 2. The same tendency to destroy the homogeneity of deposits with increasing current density over 1– 1.4 A· dm− 2 is evident in the optical microscopic images of the Zn– Ni– P coatings electrodeposited presented in Fig. 4.
 | Fig. 3. SEM images (magnification × 2000) showing the surface morphology evolution of electrodeposited Zn– Ni– P thin films versus the current density on the Hull cell cathode. |
 | Fig. 4. Optical microscopy analysis of the Zn– Ni– P coatings electrodeposited at various current densities. |
The EDAX spectra contain mainly Zn, Ni, P elements with a few amounts of Fe and O, which demonstrates the purity of the studied thin films. The EDAX analysis shows that the chemical composition of the studied samples is almost the same in different zones. The EDAX spectrum/analysis indicates a Ni-rich alloy (> 76%) for ZNP4 and ZNP5 samples and a medium Ni-alloy incorporation (> 16%) for the other samples (Table 3). As the Zn and Ni contents in the thin films vary, it can be expected that the thin film having a higher amount of Ni possesses a higher corrosion resistance.
| Table 3. EDAX analysis results for the studied ZnNiP thin films. |
As the current density increases over the range of 1– 1.4 A· dm− 2, the homogeneity of the thin films diminishes and the films become less compact. Generally, at lower current densities, the adhesion to the steel substrate is better, as can be observed from Table 5.
| Table 4. Corrosion parameters measured and calculated for the steel substrate and the studied ZnNiP thin films in 3.5 wt.% NaCl solution at 30 ° C. |
| Table 5. The physical-mechanical characterization of the electroless obtained ZnNiP thin films. |
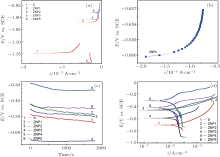
In order to evaluate the appropriate ion concentrations in the bath for obtaining optimal thin Zn– Ni– P films, the corrosion resistance of the studied samples was evaluated. Comparative potentiodynamic polarization studies for uncoated carbon steel and carbon steel coated with Zn– Ni– P alloy of different compositions were carried out to evaluate the corrosion rate in a 3.5 wt.% NaCl solution. Figure 5 shows the open circuit potential (OCP) measurements/linear polarization curves and the potentiodynamic polarization curves in logarithmic scale (Tafel plots) for the studied samples along with those of the uncoated steel substrate in the 3.5 wt.% NaCl aqueous solution at 30 ° C.
 | Fig. 5. Comparative Tafel polarization curves of uncoated steel (S) and ZnNiP sample in 3.5 wt.% NaCl solution at 30 ° C: (a) and (b) linear polarization curves; (c) OCP data; (d) Tafel plots. |
The open circuit potential was evaluated. For a given electrolyte solution, the OCP is dependent on the characteristics of the resulted oxide, such as oxide thickness, composition, conductivity, structure, etc. At the initial time of immersion in the NaCl corrosive solution, the studied alloys present OCP potential values varying from − 0.539 V for uncoated steel (W) sample to − 0.501 V for ZNP2 sample and to − 0.306 V for ZNP4 sample (Table 4). The sample ZNP3 can act as a sacrificial coating (EOCP = − 0.655 V). Most of the rapid evolution of the potential occurs during the first 7– 10 min of immersion, while further potential evolution becomes slower and the OCP does not change significantly, having a slow monotonous shift towards more positive values. The time evolution of OCP indicates that the passive film is thinning and consequently becomes vulnerable toward anion penetration of Cl− ions. Also, we notice slight oscillations of OCP in time, which probably result from chemical interactions between chloride ions and the structured passive film. Linear polarization studies were carried out to estimate the polarization resistances (Rp) for the corrosion of steel with various coatings. The resulting potential versus the current density curves show a linear dependence. The slope of the linear part of these plots yields the polarization resistance listed also in Table 4. The Rp values obtained for the Zn– Ni– P films are also higher as compared to that of the steel substrate (Rp = 3.9114 kΩ · cm2), which means that these samples will have lower corrosion rates than that of the steel substrate. Tafel polarization curves were also employed to evaluate the effect of the Zn– Ni– P coatings on the corrosion resistance of the carbon steel substrate. Figure 5 shows the potentiodynamic polarization curves for the studied samples. Using PowerCorr software, the potentiodynamic polarization curves were plotted and both the corrosion current density (icorr) and the zero current potential (EZCP) were estimated from the Tafel plots using both anode and cathode electrodes.[3, 22] The corrosion parameters were determined on the basis of the potential– current characteristics in the Tafel region (Ecorr± 250 mV) and the vicinity of the corrosion potential (Ecorr± 15 mV) according to the following equations:


where ia and ic correspond to anodic and cathode Tafel lines. The current density icorr was determined either by extrapolating the Tafel lines to Ecorr or using to the Stern– Geary equation[22]

where Rp is the slope of the polarization curve at Ecorr, and β a and β c are the anode and the cathode Tafel slopes. The corresponding Tafel parameters were obtained from the Tafel polarization curves using the PowerCorr software with automatic/manual tuning. The corrosion current was calculated at the intersection of the anodic and the cathode Tafel lines for each sample. By using the determined icorr, the corrosion rate CR was obtained with the following formula:

where EW is the equivalent weight of the sample (in units of g), A is the sample area (in units of cm2), ρ is the density (in units of g· cm− 3), and C is a constant (C = 3.268· 103) if icorr is measured in amperes and the corrosion rate is expressed in millimeters per year (mm· year− 1). If the tuned data are normalized in relation to the sample area, then icorr/At is just replaced by icorr. The Tafel calculation is a complete tool to study the corrosion process on the surface of a metal. In order to determine the degree of corrosion protection, the protection efficiency (PE) was estimated by comparing the corrosion rates of steel uncoated and plated with the thin film, using the equation[24– 26]

The corresponding corrosion parameters for the data in Fig. 5 are presented in Table 4. The Tafel plots indicate that the Zn– Ni– P thin film has better corrosion protective properties than the steel substrate. The sample shows a positive shift in the corrosion potential, which means a lower chemical activity than that of the steel substrate and hence possess better chemical stability in the aggressive environment. The obtained results are in good agreement with the obtained Rp values. An image introspection of the samples after the corrosion process confirms a low corrosion rate for the studied sample, which has a good enough aspect after a short-term corrosion test (48 h). We can conclude that deposits with high Ni content induce barrier properties thereby extending the life of the coating. In other words, the studied thin films have a lower chemical activity than the steel substrate and hence possess better chemical stability in an aggressive environment.
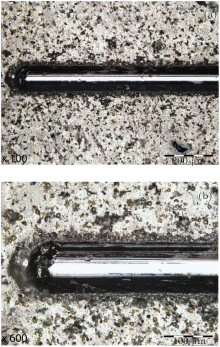
Besides the sacrificial properties predicted by the OCP measurements, another very important physical characteristic of the obtained thin films is their adhesion on the substrate. The adhesion properties of the deposited coatings were verified using the scratch-model approach. The scratch test results are important for determining the effect of the experimental parameters on the optimum adhesion of the thin films. It is reported in the literature that the critical load does not vary with the thickness of the coating.[27] Also, FNC depends on the nature of the film and the substrate but it cannot be directly ascribed to the mechanical properties. From these observations it is concluded that the critical load is mainly determined by the properties of the thin film/substrate interface. The more negative zinc coatings offer a high level of sacrificial protection to the underlying steel and inhibit the hydrogen penetration in the bulk of the alloy. However, this coating has a very short life due to a high rate of galvanic corrosion. The critical load FNC determined by the scratch test method is presented in Table 5, while Figure 6 shows the images of the scratch test for one of the samples. It can be observed from Tables 4 and 5 that the phosphorus content influences the adhesion as it minimizes the permeation of hydrogen into the substrate, which is known to cause embrittlement of metals and alloys. The co-deposition of P with Zn and Ni enhances the hydrogen permeation characteristics of the electrodeposited alloy by modifying the adsorption kinetics, the hydrogen proton recombination, and the rate of the hydrogen evolution reaction.
 | Fig. 6. Optical images of a scratch test for the ZNP4 sample. |
X-ray photoelectron spectrosopy (XPS) analysis was also used to determine the chemical states of the elements present on the surface of the Zn– Ni– P thin film alloys deposited on the steel substrate before and after the corrosion process. Figure 7 shows comparatively the survey XPS spectra for the initial/corroded ZNP3 sample. We have to mention that all of the XPS measurements on the initial studied samples gave similar spectra, which display the characteristic XPS transitions of the detected elements on the surface, Zn, Ni, P as principal elements and C, O, S as contaminants elements. From the calculated results, substantial amounts of C were detected on the surface, which may be attributed to two sources: the surface was contaminated with unavoidable carbon from CO2 and hydrocarbon adsorbed on the outermost layer from ambient atmosphere; the aromatic compound (C6Na3H5O7· 5½ H2O) used in the bath, which may have taken part in the formation of some complexes. Oxygen will always be present on samples exposed to the atmosphere, either due to adventitious contamination, oxidation, or water. On the corroded sample ZNP3, the survey XPS spectrum presented one more peak corresponding to Fe, which means that the ZnNiP coating dissoluted in the corrosive medium but, due to the good corrosion parameters, we can conclude that this sample was acting as a sacrificial coating. The quantities of Fe found in the corroded studied samples prove the better corrosion resistance of sample ZNP4, this result is in good accordance with the electrochemical corrosion data.
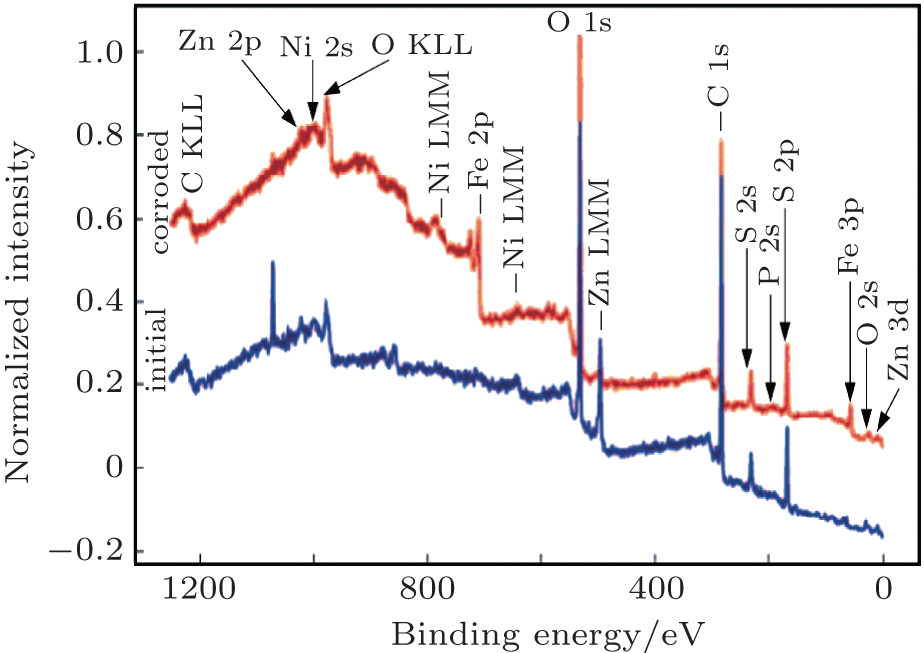 | Fig. 7. XPS survey spectra for the initial and corroded ZnNiP5 sample. |
To further determine the film components, high-resolution XPS spectra of Ni 2p, Zn 2p, Zn LMM, and P 2p regions were recorded (Fig. 8). The deconvoluted peaks were identified by reference to an XPS data base.[28] Although numerous references for the Zn 2p3/2 peak of zinc metal and oxide can be found, it is generally agreed that the use of the modified Auger parameter is preferred for species identification.
 | Fig. 8. High resolution XPS spectra for initial and corroded ZNP3 sample: (a) and (b) Ni 2p; (c) and (d) Zn 2p; (e) and (f) Zn LMM; (g) and (h) P 2p. |
The Zn 2p3/2 and Zn LMM (Auger transition) spectra (Figs. 8(c)– 8(f)) indicate the presence of Zn2+ ion in the initial and the corroded ZNP sample. The Zn 2p3/2 lines for ZnO are found at ∼ 1022.4 eV with Zn LMM at ∼ 497.29 eV in both the initial and the corroded sample.
The Ni 2p spectrum of the initial ZNP3 sample (Fig. 8(a)) consists of photoelectrons originating from at least two different chemical environments and always has a complex shape (mixture of core level and satellite features). The satellite features should not be confused with oxidized nickel peaks. In the initial ZNP3 sample, the peaks at 852.9 eV and 870.17 eV are due to metallic Ni atoms (Ni0 2p3/2, Ni0 2p½ ) in the alloy sample, whereas the higher binding energy peaks at 854.9 eV and 872.4 eV are due to oxidized Ni atoms (Ni2O3 2p3/2, Ni2O3 2p½ ). Both oxidized peaks have satellites at 859.0 eV and 876.0 eV. For the corroded sample (Fig. 8(b)), the Ni 2p spectrum presents only a peak at 853.0 eV corresponding to Ni0 2p3/2 and a peak at 856.1 eV with a satellite at 861.0 eV which is attributed to Ni(OH)2 2p3/2.
The P 2p spectrum of the initial sample (Fig. 8(g)) consists of a doublet from elemental phosphorus (P0) at 129.9 eV and a singlet at 133.74 eV, corresponding to hypophosphite/phosphate or even some organic phosphorous compound (Porganic). As for the corroded sample (Fig. 8(h)), only the peak for organic phosphorous is found and the scatter observed in the spectrum is due to the charging effects observed for these corrosion films.
In fact, we can conclude from the spectra that while Zn and Ni are present in oxidized states (ZnO, Ni2O3), P is in the metallic form in the initial sample. From the XPS measurements, it is clearly that elements Zn and Ni are present in the corroded samples as oxide and hydroxide [ZnO, Ni(OH)2], while the P element is present as an organic compound (corrosion product), which may be due to the presence of the sodium citrate in the bath. We can conclude that during the corrosion process, changes are made only over nickel. In the same time, some Fe is found as Fe2O3 (in different concentrations well correlated with SEM and corrosion data).
This behavior was confirmed by microscopic introspection of the initial and the corroded samples (Fig. 9 for ZNP3). The microscopic images clearly show the changes in shape and color for the corroded samples, proving the appearance of Fe2O3 (the brown-red color) as rust.
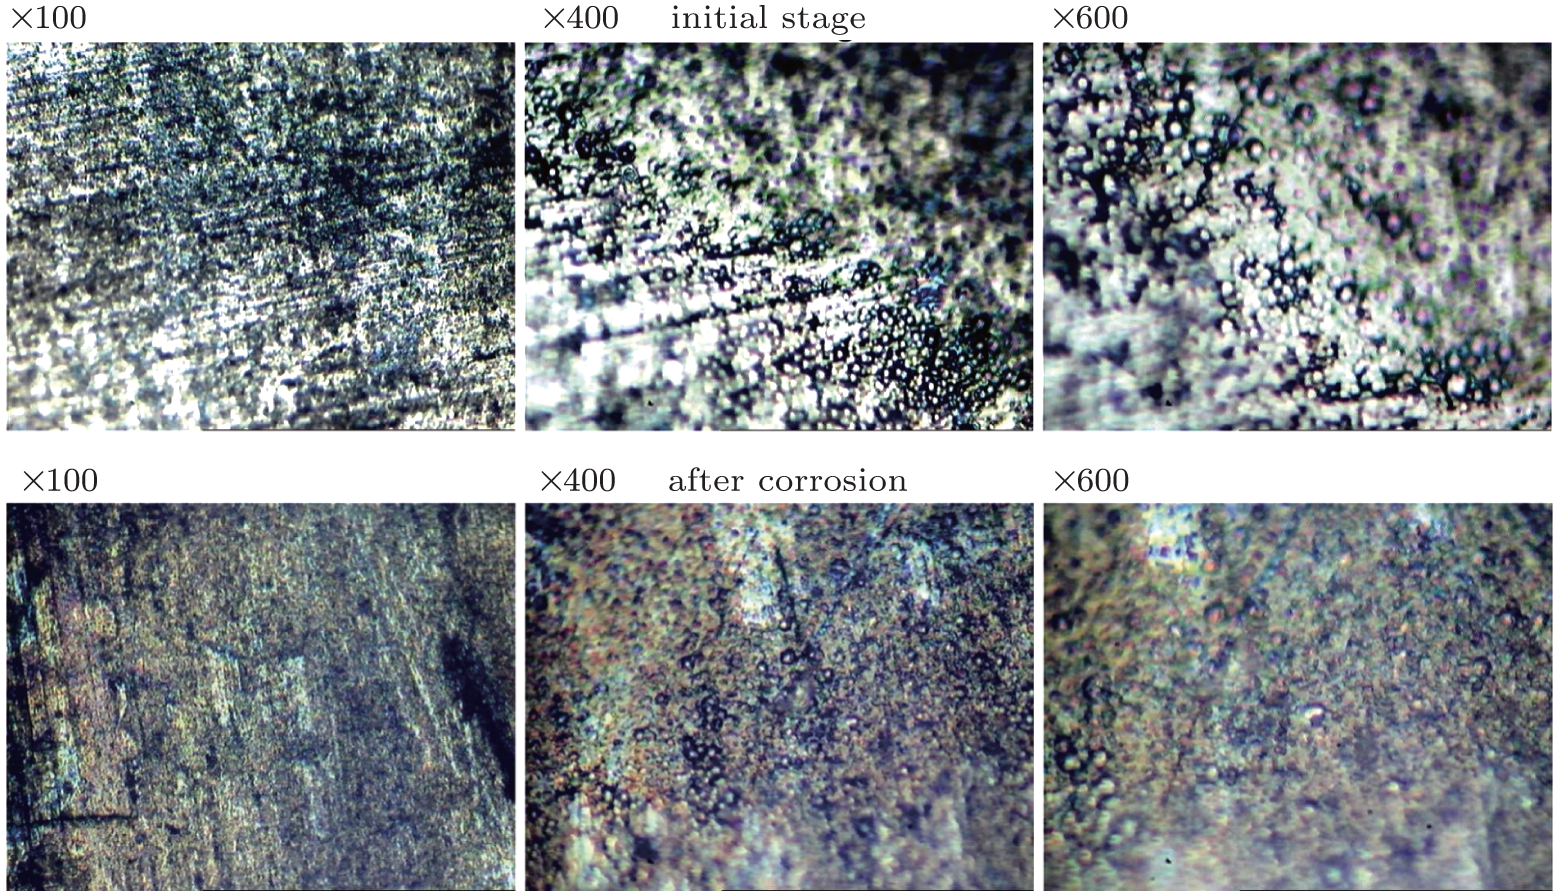 | Fig. 9. Comparative micrographic study on initial/corroded ZNP3 sample. |
We successfully prepared a Zn– Ni– P thin film alloy on a low carbon steel substrate by electro-deposition in a Hull cell with a sulfate-hypophosphite low alkaline bath. The thin films were compact, uniform, with a cauliflower aspect. The microstructure and the composition strongly depended on the current density in the Hull cell. The EDAX results confirmed the formation of Zn– Ni– P coating with medium or high Ni content. The corrosion protection properties of these thin films on steel were studied with a 3.5 wt.% NaCl solution, very good protection efficiencies (63.21%– 85.89%) were obtained for the thin films with 2.5– 0.8 A· dm− 2. Taking into account the corrosion rate and the morphological aspect, we can conclude that the best ZnNiP coatings were those with high Ni contents (> 76%) and obtained at lower current densities (0.8– 1.4 A· dm− 2). XPS measurements proved that if in the initial stage the ZnNiP thin films were covered with oxides (ZnO, Ni2O3), after corrosion the surfaces contain oxide and hydroxide [ZnO, Ni(OH)2], so Ni(OH)2 is the corrosion product.
The authors express their gratitude to Dr P. Osiceanu and Dr E.I. Neacsu for their help in XPS measurements. All of the authors’ contributions are equal.
| 1 |
|
| 2 |
|
| 3 |
|
| 4 |
|
| 5 |
|
| 6 |
|
| 7 |
|
| 8 |
|
| 9 |
|
| 10 |
|
| 11 |
|
| 12 |
|
| 13 |
|
| 14 |
|
| 15 |
|
| 16 |
|
| 17 |
|
| 18 |
|
| 19 |
|
| 20 |
|
| 21 |
|
| 22 |
|
| 23 |
|
| 24 |
|
| 25 |
|
| 26 |
|
| 27 |
|
| 28 |
|