Sensitive absorption measurements of hydrogen sulfide at 1.578 μm using wavelength modulation spectroscopy*
Xia Hua, Dong Feng-Zhong†

, Wu Bian, Zhang Zhi-Rong, Pang Tao, Sun Peng-Shuai, Cui Xiao-Juan, Han Luo, Wang Yu
Anhui Provincial Key Laboratory of Photonic Devices and Materials, Anhui Institute of Optics&Fine Mechanics, Chinese Academy of Sciences, Hefei 230031, China
†Corresponding author. E-mail: fzdong@aiofm.ac.cn
*Project supported by the Special Fund for Basic Research on Scientific Instruments of the Chinese Academy of Sciences (Grant No. YZ201315) and the National Natural Science Foundation of China (Grant Nos. 11204320, 41405034, and 11204319).
1. IntroductionH2S is an important indicative and potentially hazardous gas in oil drilling. The slight rotten egg smell will be found when the concentration is lower than 5 ppmv, while 10 ppmv is the occupational exposure limit in hazardous industrial areas. Furthermore, higher concentration H2S will benumb the sense of smell instantly and threaten the life of people. So it is dangerous to judge H2S existence simply by smell.[1] Hence, sensitive H2S detection is necessary in practical applications.
H2S spectral absorption lines are often disturbed by the presence of water vapor (H2O), carbon dioxide (CO2), and methane (CH4).[1] At the same time, the concentrations of the spectrally interfering molecules usually far outweigh the H2S component. So it is very important to search the appropriate H2S absorption line in precise measurements.
Wavelength modulation spectroscopy with a tunable diode laser has a high sensitivity for gas concentration measurements under low absorption conditions.[2– 4] Tunable diode laser absorption spectroscopy (TDLAS) is being frequently used for measurements of trace gas pollutants in the atmosphere.[5– 8] A single narrow laser line is scanned over an isolated absorption line of the species under investigation to achieve high sensitivity, good selectivity, and a low detection limit. Especially, with the application of multi-pass cells, which extend the effective optical length from a few meters to several thousand meters, the sensitivity is significantly improved. In order to further improve the signal to noise ratio (SNR), the wavelength modulation technology with second harmonic signals is employed to measure the concentration. Various trace gases have been detected successfully by this method.[9]
There is considerable interest in the instrumental development of in situ and real-time H2S concentration measurements for various field applications, especially in the petrochemical industry. In this paper, a 1.578 μ m distributed feedback (DFB) laser is used to detect low concentration H2S. According to the laser linewidth and the tunable wavelength range, the scan amplitude is selected, which determines the second harmonic line width and at the same time avoids the interference by other gases. In addition, the stability of the background signal of the novel multi-pass cell in the measurement system is considered.[10– 12] In the process of measurement, this background will be subtracted and therefore affects the stability of the whole system and the detection sensitivity. Moreover, the linearity of the system is tested with measurements at different H2S concentrations. The response time and the repeatability are also studied. At last, the Allan variance is used to analyze the detected limit and the stability of the measurement system.
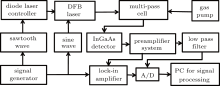
2. Setup of wavelength modulation spectroscopy systemThe wavelength modulation spectroscopy (WMS) technique is used in our TDLAS experimental system, as shown in Fig. 1. The multi-pass cell is of the novel type with a base path length of 246 mm and a total volume of 0.8 L. The total optical path length can be varied from 5.4 m to 108 m with a step of 5.4 m. In the system, a single-mode pigtailed DFB diode laser, which is mounted in a butterfly package with a central emission wavelength of 1.578 μ m, is employed. The wavelength of the laser is controlled by the temperature and an electronic-current controller (TEC), which has an accuracy of 0.01 mA and can vary the laser wavelength with a magnitude of about 0.014 cm− 1/mA. At the same time, the laser wavelength is scanned by a triangular wave of 30 Hz, which linearly sweeps over the wavelength of 1578 nm where H2S has the strongest absorption within the near-infrared region. In addition, a 20 kHz sine wave injects a current to modulate the laser output wavelength. Then the modulated light is transmitted through the multi-pass cell of 56 m effective optical path length and reaches the InGaAs detector. The transmission signals are sent to the preamplifier system, whose bias amplifier enhances the weak absorption signals. The parallel circuits amplify the signal and direct it to a lock-in amplifier for demodulation and to a low pass filter for obtaining the triangular wave after passing through the multi-pass cell. The harmonic signals by demodulation are used to determine the H2S concentration, whereas the magnitude of the triangular signals indicates the optical instability. Both signals are directed to a personal computer (PC) for signal processing via an A/D converter. Each measured spectrum is recorded in a single sweep of the laser with averaging.
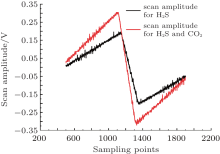
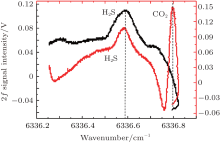
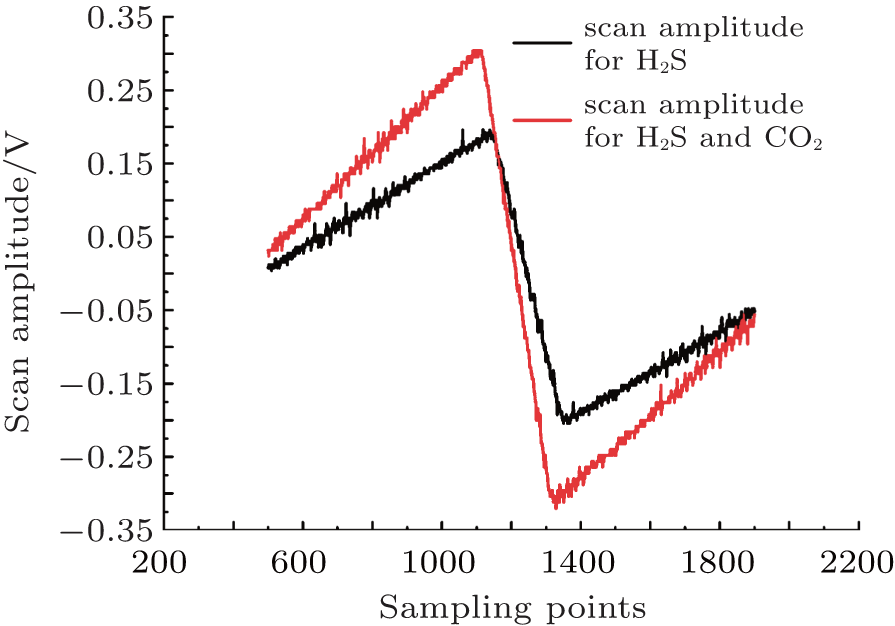
3. H2S concentration measurements and discussion 3.1. Spectral line interferenceSpectral parameters of H2S in the near infrared region are not available in the HITRAN spectroscopic database. Therefore, H2S absorption lines are mainly obtained from references, for example, Chen determined the H2S absorption lines in the range from 1530 nm to 1640 nm by FTIR spectroscopy.[11] However, these H2S absorption lines are usually disturbed by CO2, CH4, and H2O molecular lines. Figure 2 shows CO2 absorption lines near 1578 nm. The order of CO2 absorption strength is 10− 26, and that of H2S absorption strength is 10− 22 in this spectral region. Even so, the CO2 interference from the air in the extraction system needs to be avoided. Figure 3 shows the scan amplitude. When it is larger than 0.4 V, the second harmonic of H2S is influenced by CO2 absorptions, as depicted in Fig. 4. Obviously, if the scan amplitude is too large, a large concentration of CO2 will aberrant the second harmonic signals of H2S. Consequently, either the scanning amplitude should be reduced to avoid the absorption interference, or a low-voltage device should be used to sharpen the absorption lines.
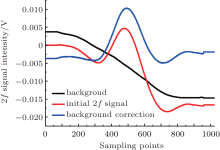
3.2. Stability of background signalsIt is important to subtract the background spectrum in the spectral measurements, which improves the measurement accuracy and the detection limit. In Fig. 5, the background and the initial second harmonic signal are shown. Obviously, the symmetry of the demodulated signal is considerably improved after the background correction.
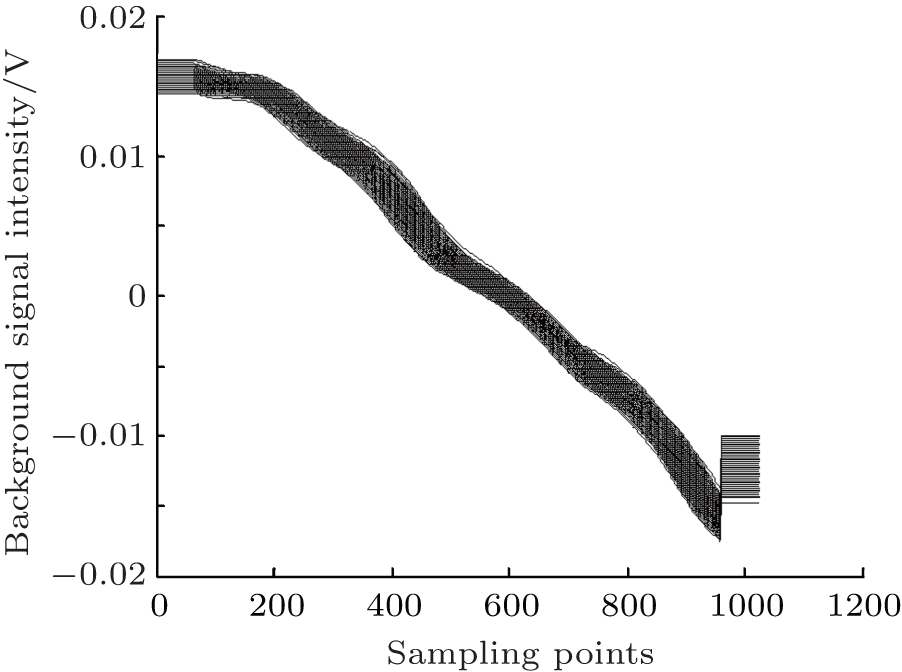
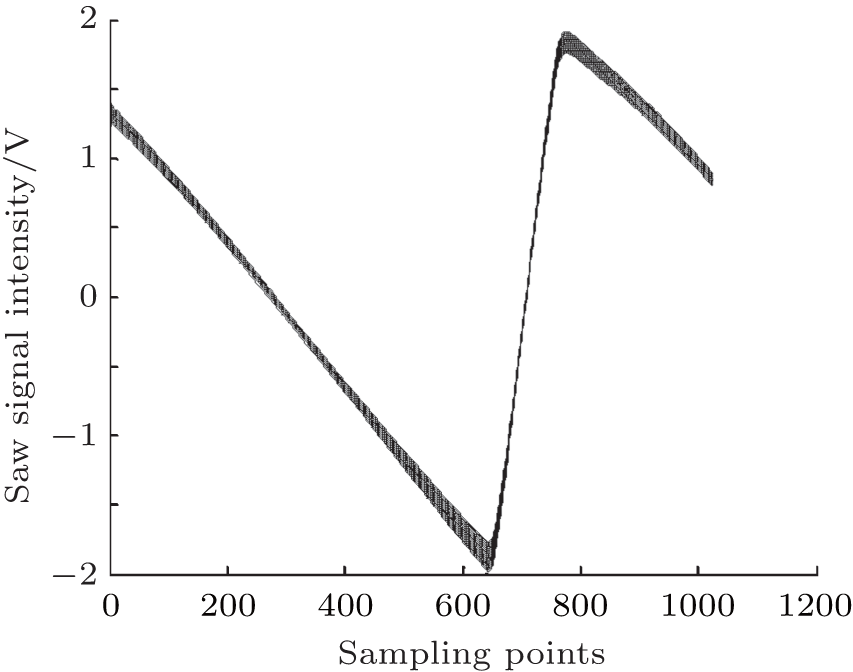
The detection accuracy is affected by the stability of the subtracted background signals. Figure 6 shows one hundred sets of background signals with a sampling interval of 5 min. It is clear that the signal shape of the background has almost no change and distortion; just the direct-current (DC) component has slight fluctuations caused by the light intensity response of the InGaAs detector, as shown in Fig. 7. Here we use the filter amplifier circuit to obtain the triangular wave, whose amplitude indicates the light intensity transmitted from the multi-pass cell. Fortunately, the DC fluctuation does not affect the concentration inversion algorithm, and the alternating-current (AC) component could be corrected by the peak-to-peak value of the triangular wave.
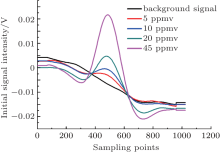
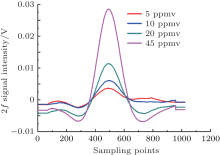
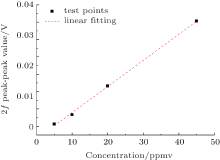
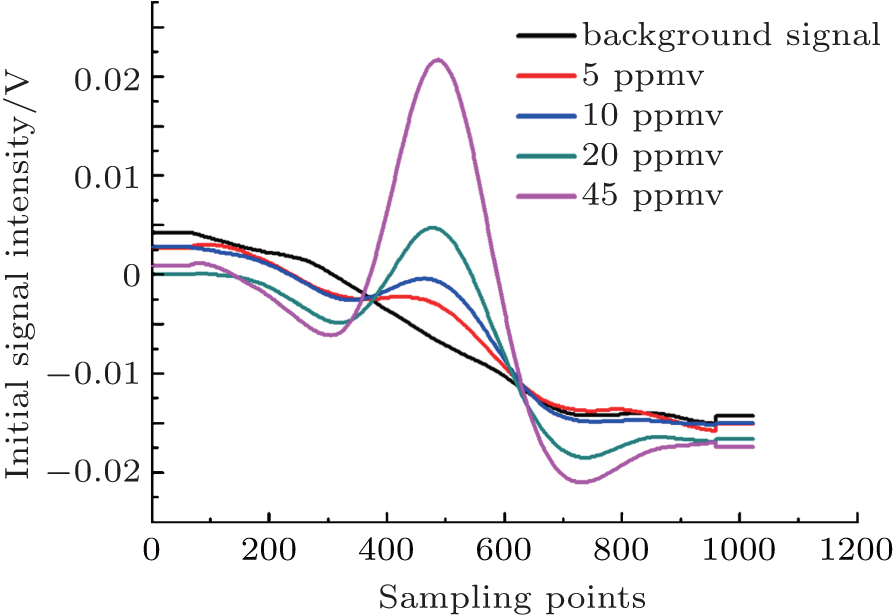
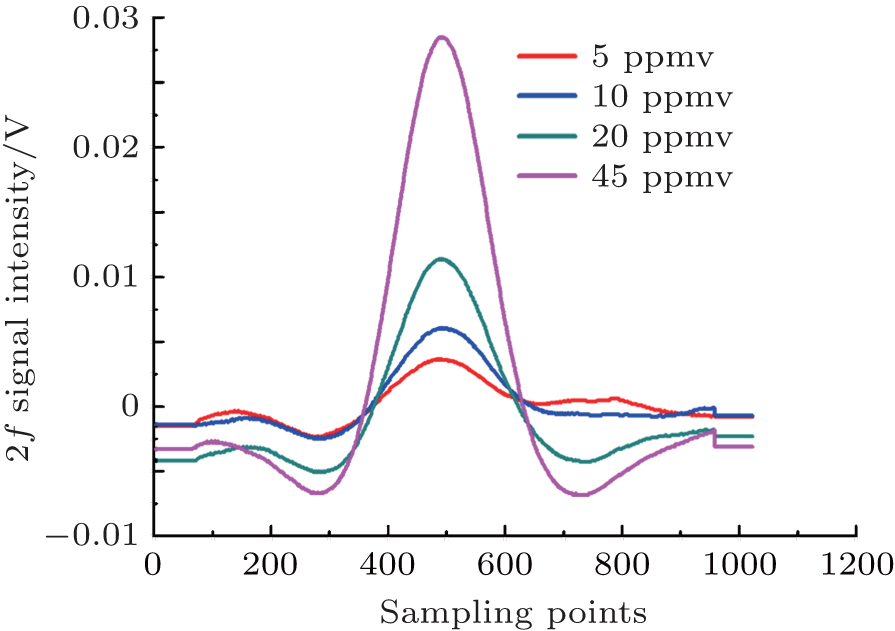
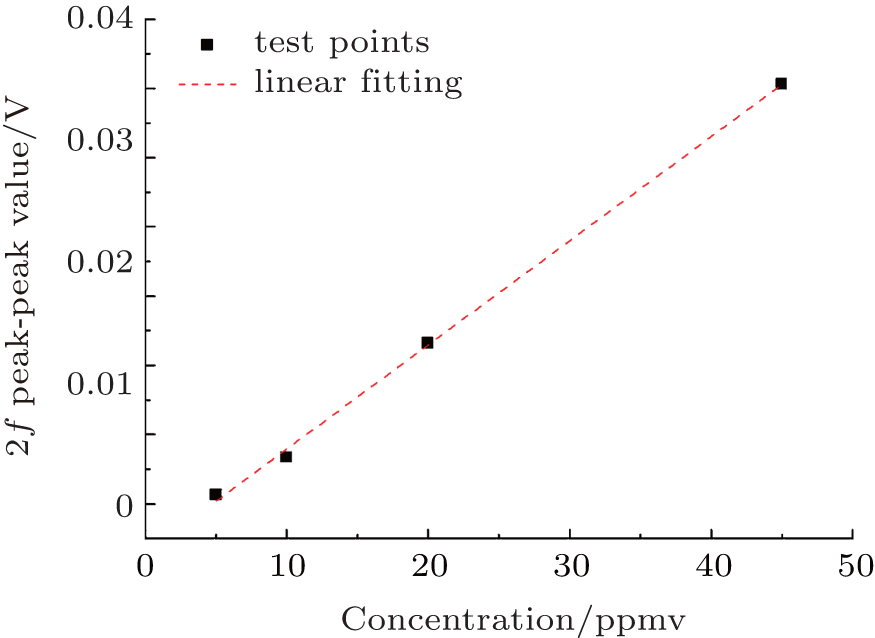
3.3. Linearity and response timeLinearity is one important parameter in measuring instruments. In this TDLAS system, certified gases with H2S concentrations of 5 ppmv, 10 ppmv, 20 ppmv, and 45 ppmv are tested successively to check the linearity. Figure 8 displays the initial second harmonic signals for different concentrations, and the corresponding background corrected signals are depicted in Fig. 9. Furthermore, the concentrations and the peak-to-peak values are linearly fitted in Fig. 10. The results show that the system has a good linearity with 0.998 fitting coefficients, which is a precondition for accuracy measurement.
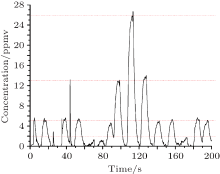
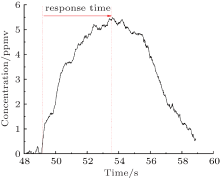
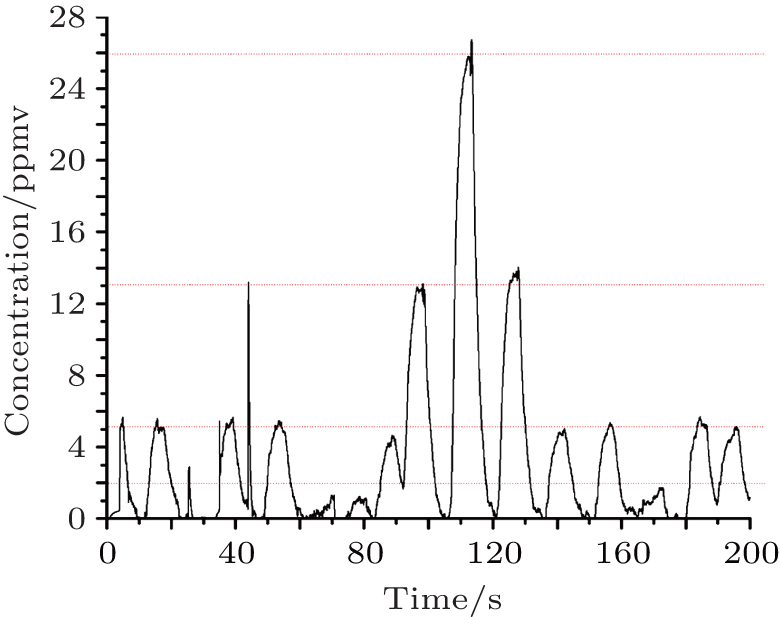
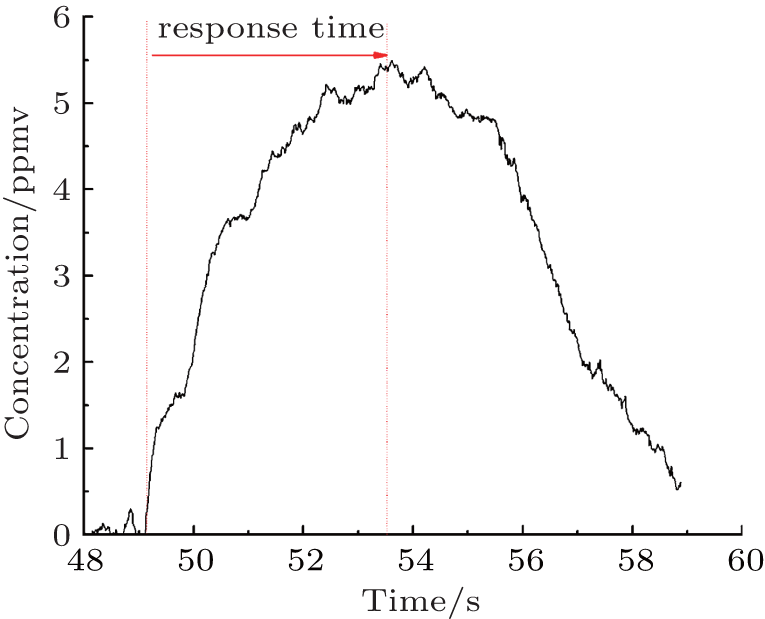
The repeatability and the response time are additional important parameters. In the extraction system, a 1-L gasbag is used to get the different H2S standard gases into the multi-pass cell successively. As shown in Fig. 11, the repeatability is good. The response time depends on both the volume of the multi-pass cell and the speed of releasing the airbag. In Fig. 12, the response for filling a 5 ppmv H2S standard gas mixture into the 0.8 L cell with an evacuation flow rate of 3 L/min is plotted. In reality, the ventilation volume is triple the cell volume. Obviously, the response is accurate and fast. In the system, the data sampling rate is 90 Hz, so the response time is about 4 s.
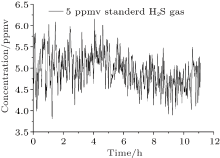
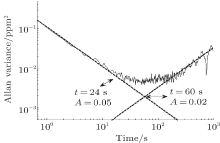
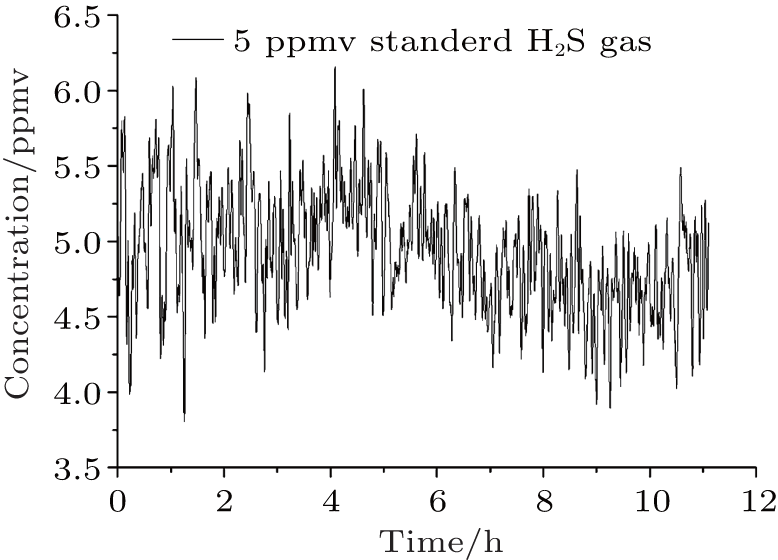
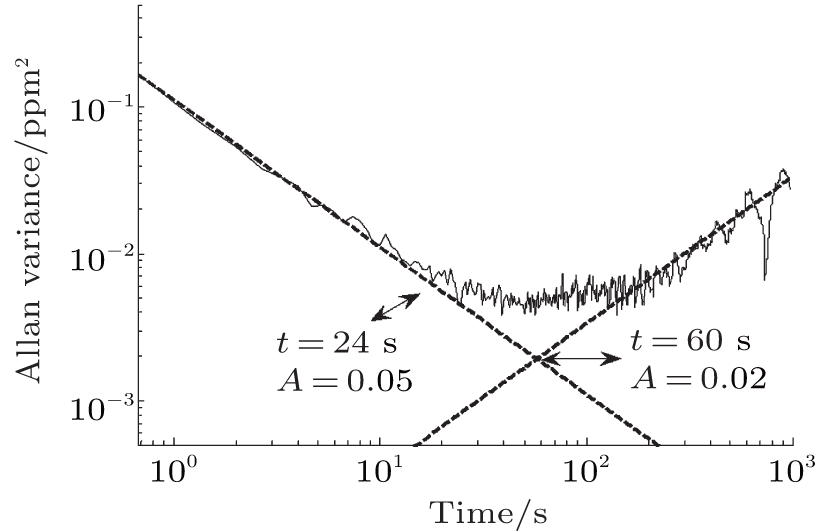
3.4. System stability and detection limitThe Allan variance is usually used to analyse the temporal stability of the instrument performance. Here we measure a 5 ppmv H2S standard gas mixture for a long time of 11 h, as shown in Fig. 13. The resulting fluctuations are less than 1 ppmv. Moreover, the Allan variance for the data recorded in Fig. 14 indicates a detection limit of 240 ppbv with an integration time of 24 s for eliminating the white noise. When the time is increased to 60 s, the detection limit reduces to 140 ppbv for removing the 1/f noise.
4. ConclusionTunable diode laser absorption spectroscopy with wavelength modulation for H2S detection at 1.578 μ m has been presented. Under room temperature and ambient pressure conditions, a number of experiments have been performed with this system. The experimental results indicate that the arrangement has good linearity, stability, and repeatability, accompanied by a quick response and a low detection limit. The TDLAS system for H2S detection has the feasibility of real-time online monitoring in many applications.


