
Compton profile of molecular hydrogen*
[Zhao Xiao-Lia), b) , Yang Kec)†  , Xu Long-Quan
a), b) , Ma Yong-Pengc) , Yan Shuaic) , Ni Dong-Donga), b) , Kang Xua), b) , Liu Ya-Weia), b) , Zhu Lin-Fana), b)‡ ]
, Xu Long-Quan]
|
|

 , Xu Long-Quan
†Corresponding author. E-mail: yangke@sinap.ac.cn
‡Corresponding author. E-mail: lfzhu@ustc.edu.cn
*Project supported by the National Natural Science Foundation of China (Grant Nos. U1332204, 11274291, and 11104309), the National Basic Research Program of China (Grant No. 2010CB923301), and the Fundamental Research Funds for the Central Universities, China. The experiment was carried out in a beam time approved by Shanghai Synchrotron Radiation Facility (SSRF), China (Proposal Nos. 11sr0210, 12sr0009, and 13SRBL15U15487).
The Compton profile of molecular hydrogen has been determined at an incident photon energy of 20 keV based on the third generation synchrotron radiation, and the statistical accuracy of 0.2% is achieved at p z = 0. Different theoretical methods, i.e., the density functional method, and the Hartree–Fock method, were used to calculate the Compton profiles of hydrogen with different basis sets, and the theoretical calculations are in agreement with the experimental observation in the whole p z region. Compared with the HF calculation, the DFT-B3LYP ones are in better agreement with the present experiment, which indicates the electron correlation effect is very important to describe the wavefunction in the ground state of hydrogen.
The dynamic parameters of atoms or molecules with high accuracy, i.e., the benchmark data, are of crucial importance to test the theoretical modes, calculational codes, as well as the wave functions of the target.[1] Among of them, the Compton profile is paid special attention since it represents the electron density distribution in momentum space and can be used to evaluate the electron wavefunctions prepared by different theoretical methods.[2, 3] However, the benchmark data of a high-precision Compton profile of atoms or molecules are very difficult to measure. The accuracy of the measured Compton profile, to a great extent, depends on the advance of the experimental technique. For example, the previous Compton profile of N2[4– 6] was measured by γ -ray and the Ge (Li) detector, and its uncertainty is 1% at pz = 0, which is not enough to evaluate the CI calculations as pointed out by Thakkar and Tatewaki.[7] Therefore, with the advance of the theory, the above-mentioned experimental accuracy is not high enough and the experimental data of the Compton profile in the early days are not suitable for serving as the benchmark data.[3]
Before 1950, Compton scattering of some condensed matters was studied with the traditional x-ray machine, and there are only very few investigations[8, 9] about the Compton scattering of atoms or molecules in the gas phase, in which Compton scattering spectra rather than Compton profiles were measured due to the very low photon flux of the traditional x-ray machine and the very low target’ s density of gas. In the 1950s, the advent of the rotating anode x-ray tube and fine focus x-ray tube enhanced the brightness of x-ray greatly, [10] which provided the possibility of measuring the Compton profiles of atoms or molecules in the gas phase. Gradually, Compton profiles of some lighter atoms and molecules, such as He, Ne, Ar, Kr, H2, N2, O2 and a number of alkane molecules, were measured by the x-ray tube and LiF analyzing crystal[11– 14] or γ -ray source and Li-drifted-germanium detector, [4– 6, 15] and an experimental accuracy 1% at pz = 0 was obtained. Entering the 1990s, with the development of the third generation synchrotron radiation light source, the flux of the incident hard x-ray has been enhanced by several orders of magnitude and the energy resolution has improved greater than before, [1, 16– 20] which provides the possibility of high-precision Compton profile measurement. Very recently, Sakurai and his coworkers measured the Compton profiles of He, Ar, Xe, and N2[2, 3] at the third generation synchrotron radiation of SPring-8, and an unprecedented accuracy, i.e., the experimental uncertainty of 0.1% at pz = 0, has been achieved in these studies.
The above survey shows that there is no study about the Compton profile of H2 by synchrotron radiation. In this work, we present a joint experimental and theoretical investigation of the Compton profile of hydrogen in the gas phase. In Section 2, the theoretical background and calculation details of the Compton profile are introduced. In Section 3, the experimental method is described in detail. In Section 4, the present experimental result is compared with the theoretical calculations and the previous experimental results. Then a brief summary is given.
According to the impulse approximation (IA) in which the binding energy EB of the electron in the target is much less than its recoil energy ER, [21] the differential cross section of Compton scattering can be described by (atomic units are used in the whole paper)

where the Thompson cross section (d σ /dΩ )Th is equal to 

Here, pz can be understood (in IA) as the component of the electron momentum of the initial state in the direction of photon momentum transfer

The Compton profile J(pz) can be given by the following equation:[11, 21]


where n(p) is the probability of the electrons having momentum p, which is the magnitude of the electron momentum p. ψ j(p) is the one-electron wave function in momentum space for the j-th electron. For an atom, the integration in Eq. (5) is known as the spherically averaged electron density distribution in momentum space, i.e., electron momentum profile, [22] and the sum is extended to all occupied electron orbitals. As for a randomly oriented molecule, n(p) in Eqs. (4) and (5) should be replaced by the orientation averaged momentum distribution
According to Eqs. (4) and (5), the Compton profile of an atom or a molecule can be calculated when its wavefunction in the ground state is prepared by the GAUSSIAN 03 program.[23] For H2, the H– H bond length is optimized firstly. The optimized bond length of 0.07428 nm is in good agreement with the measured value of 0.0742 nm.[24] Based on the optimized molecular structure, the orbital wavefunction in position space can be calculated by Hartree– Fock method with aug-cc-pVTZ basis set or density functional method (DFT-B3LYP) with increasing-sized basis sets of 6-311G, 6-311+ + G, 6-311G**, 6-311+ + G**, and aug-cc-pVTZ. For DFT calculations, B3LYP hybrid functional is employed that refers to Becke’ s three parameters hybrid functional using Lee– Yang– Parr correlation functional.[25, 26] For the basis sets, 6-311+ + G means 6-311G added a s diffuse function, 6-311G** means 6-311G added a p polarization function and 6-311+ + G** means 6-311G added both a s diffuse function and a p polarization function. After Fourier transform, the orbital wavefunction in momentum space can be obtained and then for each orbital, its electronic momentum density can be calculated according to Eq. (5). Finally, the Compton profile can be calculated by integrating the momentum distribution probability of the target electrons by Eq. (4). Furthermore, we also calculated the Compton profile of He, which would be used to determine our experimental energy resolution, which will be discussed in Section 3. For He, we choose the density functional method with an aug-cc-pVTZ basis set to calculate its Compton profile.
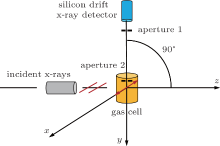
The present measurement was carried out at the BL15U1 beamline of Shanghai’ s Synchrotron Radiation Facility. The experimental setup is shown in Fig. 1. The incident photon energy is 20 keV with an energy spread of 3 eV achieved by a Si(111) monochromator. The scattered photon is detected by a silicon drift x-ray detector (SDD) at a scattering angle of 90° . The diameters of apertures 1 and 2 are both 1 mm while the distance between them is 33 mm, which limits a visual angle of 3.5° that results in a momentum resolution of 0.1 a.u.. The SDD gas cell as well as the region between them are surrounded by a lead leather with a 0.5-mm thickness to shield the stray photons. 20 atm of He gas and H2 gas were sealed in two same-size gas cells by Kapton windows, and then the gas cells were put on the experimental platform for the measurement in turn. The two gases were bought from the Nanjing Shangyuan Industrial Gas Company with the nominal purity of 99.999%, and no further purification was made. All measurements were carried out at room temperature.
 | Fig. 1. Schematic diagram of the Compton scattering spectrometer. The direction of the incident photon is along the z axis and its polarization direction is along the x axis. |
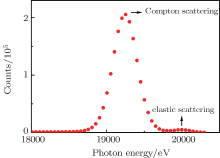
Figure 2 shows a raw x-ray scattering spectrum of H2 with the elastic scattering and the Compton scattering assigned. In order to eliminate the background from the scattering by Kapton windows and the wall of the gas cell, the measured spectra with the vaccumed empty gas cell were subtracted. The weak elastic scattering was also deducted by fitting it with a Gaussian function. Then the high-energy side of Compton scattering is used to determine the Compton profile of H2 since the contribution of the background of the low-energy side is slightly larger than that of the high-energy side and the elastic scattering is very weak for this light molecule. Then relative Compton profile J(pz) was determined according to Eqs. (1) and (2).
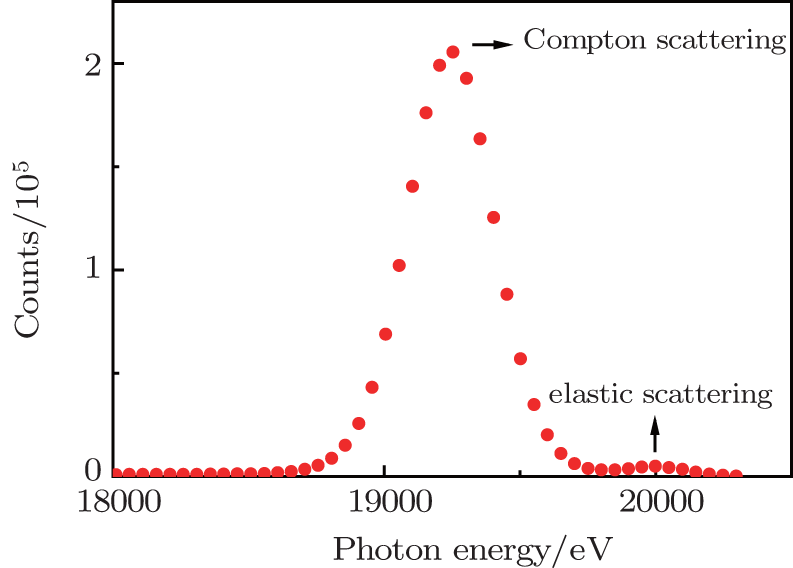 | Fig. 2. A Compton scattering spectrum measured at 90° for H2. |
It should be pointed out that the experimental Compton profile is unavoidably influenced by the experimental momentum resolution, which mainly comes from the energy resolution of the spectrometer and the definite acceptance angle of the detector. In other words, the experimental Compton profile is the one of the true Compton profiles convolved by the experimental momentum resolution. So when we compare the experimental Compton profile with the theoretical calculations, the theoretical ones should be convolved with the experimental momentum resolution. As mentioned above, the momentum resolution caused by the detector's visual angle is 0.1 a.u., which is used to convolve the theoretical Compton profile firstly. Furthermore, the momentum resolution originating from the experimental energy resolution was determined by fitting the experimental Compton scattering spectrum of He with the theoretical calculation convolved by a normative Gaussian function, whose full width at half maximum (FWHM) changes linearly along with the photon energy considering the energy resolution of the SDD being linearly photon energy dependence. The theoretical Compton profile of He was calculated by B3LYP/aug-cc-pVTZ mentioned in Section 2 and it is accurate enough for such a simple atom. The momentum resolution due to the energy resolution is about 1.5 a.u. which is much larger than that due to the detector’ s visual angle. The relative Compton profile of H2 was normalized to the theoretical Compton profile obtained by convolving the calculation by B3LYP/aug-cc-pVTZ with the experimental resolution.
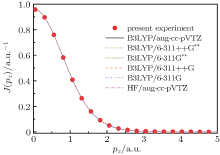
Figure 3 shows the present experimental Compton profile of H2 along with the calculations with the HF/aug-cc-pVTZ, B3LYP/6-311G, B3LYP/6-311+ + G, B3LYP/6-311G**, B3LYP/6-311+ + G**, and B3LYP/aug-cc-pVTZ. It can be seen from Fig. 3 that the present experimental Compton profile agrees with our calculations very well in the whole range at a first glance. In order to show the detailed deviations of the theoretical calculations from the experimental one, the differences between them, which are called the deviation profile, are calculated according to

Here Jexp(pz) is the experimental profile, Jcal(pz) is the calculated profile and Jcal(pz = 0) is the value of Jcal(pz) at pz = 0. The calculated Δ J(pz) is shown in Fig. 4. Generally speaking, the HF calculation deviates from the experimental results mostly, although it is still very small. It can also be noticed that the differences among the B3LYP calculations cannot be resolved. In order to elucidate the differences quantitatively, we calculated the summations of the residual square of H2 between our experimental Compton profile and the six calculations, which are listed in Table 1. The calculations by B3LYP give a smaller value than that by HF, and are more consistent with the experiment. This indicates that the electron correlation effect is considered more sufficiently in DFT-B3LYP method. As for the B3LYP calculations using different basis sets, we can see that the five calculations give a similar accuracy as the size of basis sets increases, so the polarization function and the diffuse function do not work for improving the accuracy of wavefunctions of H2 in the ground state. Furthermore, it suggests that the calculation with the largest basis set of aug-cc-pVTZ is accurate enough for the description of the ground state wavefunction of H2. The Compton profile of H2 was also investigated previously. The recent theoretical calculation of Hu et al.[27] is in good agreement with the present calculations.
 | Fig. 3. Compton profiles for H2. The calculations are convolved with the experimental resolution. |
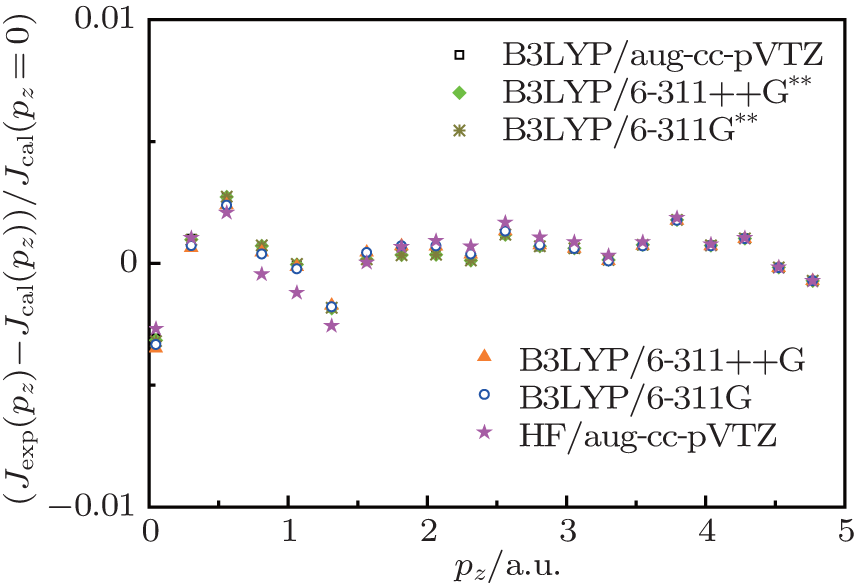 | Fig. 4. The differences between the experimental Compton profiles Jexp(pz) and the theoretical profiles Jcal(pz), are shown for H2. |
| Table 1. Summation of residual square of H2 between our experimental Compton profile and the six calculations. |
As for the previous experimental measurements, the results of Eisenberger, [11] in which a Mo-target x-ray tube was used together with a LiF analyzing crystal, are in agreement with the present calculation by B3LYP/aug-cc-pVTZ in the large momentum region. But around pz = 0, Eisenberger’ s result is lower than the present theoretical calculation by about 3.7%, which is larger than the difference between this experimental result and the theoretical one of this work.
In summary, based on the third generation synchrotron radiation light source, the Compton profile of molecular H2 was measured with an incident photon energy of 20 keV, and the statistical accuracy of 0.2% is achieved. The DFT and HF methods have also been used to calculate the Compton profiles of hydrogen. The B3LYP calculations are closer to the present accurate measurement compared with the HF calculation, which indicates that the electron correlation effect is important to describe the ground state of H2. The good agreement of the present experimental result with the DFT calculations in different basis sets indicates that adding the polarization function or the diffuse function is not important for H2.
| 1 |
|
| 2 |
|
| 3 |
|
| 4 |
|
| 5 |
|
| 6 |
|
| 7 |
|
| 8 |
|
| 9 |
|
| 10 |
|
| 11 |
|
| 12 |
|
| 13 |
|
| 14 |
|
| 15 |
|
| 16 |
|
| 17 |
|
| 18 |
|
| 19 |
|
| 20 |
|
| 21 |
|
| 22 |
|
| 23 |
|
| 24 |
|
| 25 |
|
| 26 |
|
| 27 |
|