
Changing characteristics and spatial differentiation of spring precipitation in Southwest China during 1961–2012*
[Liu Hong-Lana)†  , Zhang Qiang
b) , Zhang Jun-Guoc) , Hu Wen-Chaod) , Guo Jun-Qine) , Wang Shengf) ]
, Zhang Qiang|
|


Corresponding author. E-mail: gszylhl@126.com
Project supported by the National Basic Research Program of China (Grant No. 2013CB430200 (2013CB430206)) and the Sixth Program Ten Talented People of the Meteorological Bureau of Gansu Province, China.
In this study, we analyze spring precipitation from 92 meteorological stations spanning between 1961 and 2012 to understand temporal–spatial variability and change of spring precipitation over Southwest China. Various analysis methods are used for different purposes, including empirical orthogonal function (EOF) analysis and rotated EOF (REOF) for analyzing spatial structure change of precipitation anomaly, and the Mann–Kendall testing method to determine whether there were abrupt changes during the analyzed time span. We find that the first spatial mode of the precipitation has a domain uniform structure; the second is dominated by a spatial dipole; and the third contains five variability centers. The 2000s is the decade with the largest amount of precipitation while the 1990s is the decade with the smallest amount of precipitation. The year-to-year difference of that region is large: the amount of the largest precipitation year doubles that of the smallest precipitation year. We also find that spring precipitation in Southwest China experienced a few abrupt changes: a sudden increase at 1966, a sudden decrease at 1979, and a sudden increase at 1995. We speculate that the spring precipitation will increase gradually in the next two decades.
China is one of the most vulnerable countries in the world to natural disasters: the annual loss mounts to 3%– 6% of the gross domestic product caused by weather/climate disasters.[1] The frequent occurrences of drought have been threatening food production, social security, thereby creating tremendous pressure and challenges to the socio-economic conditions and environment-ecology problems. Southwest China (97° 21′ – 110° 12′ E, 21° 08′ – 34° 19′ N) is located in Eastern Asia, and includes the Sichuan Province, Chongqing City, Yunnan Province, and Guizhou Province, spreading over 1.12 million square kilometers. The region contains the western Sichuan Plateau, Sichuan basin, Yungui Plateau, Henduan Montain, etc, and is orographically complicated and features diverse climates. The yearly mean precipitation in that region ranges from 600 mm to 1200 mm, decreasing from its southeastern part to its northwestern part, largely depending on the orographic distribution that affects the penetration of the warm and wet southeasterly.
Partly associated with global climate change, China has experienced numerous regional weather/climate extreme events since the 1980s, especially frequent severe drought in its southern regions.[2] For example, the 2003 summer– autumn drought occurred in the Southeast, South, and part of Southwest China; [3] the 2005/2006 autumn– winter– spring drought in the southern part of South China, and 2005’ s was the most severe spring drought in the Yunnan province for the last half century; 2006’ s record setting summer drought in Sichuan Province and Chongqing City; [4, 5] the 2007/2008 winter– spring– summer drought and 2009’ s large scale autumn– winter– spring drought in most of Southwest China. These droughts brought extreme difficulties to agriculture, industry, and people’ s lives.[6– 8] He et al.[9] reported characteristics of extreme drought climate change in Southwest China over nearly 50 years; Zheng et al.[10] analyzed the spring abnormal circulation of extreme drought years in Yunnan; Li et al.[11] reported the vapor transport of drought and flood in the summer in Southwest China; Xu et al.[12] studied the asymmetric relation between winter North Atlantic Oscillation and the precipitation in Southwest China; Li et al.[13] reported spatial and temporal evolution characteristics of summer precipitation in the east of Southwest China; Zhang et al.[14] analyzed the main mode of precipitation in dry or wet season in Southwest China. Understanding the climate variability of Southwest China and developing and utilizing climatic resources, especially the precipitation variability in the spring season (March to May) when summer harvesting plants (rice, tobacco, corn) experience their critical growing stages, are likely to bring tremendous benefits. These reasons motivate us to study the climate variability and change in Southwest China, which could potentially project the vital skill of speculating the future climate variability and changes of that region.[15, 16]
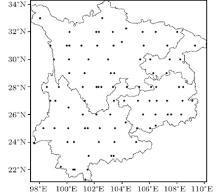
Southwest China mentioned in this study refers to the territory of China, as enclosed by a rectangle from 97° 21′ E to 110° 12′ E, from 21° 08′ N to 34° 19′ N, as shown in Fig. 1. This part of China includes the Sichuan Province, Chongqing City, Yunnan Province, and Guizhou Province. The data analyzed include spring (from March to May) precipitation from 92 meteorological stations (with their spatial locations marked in Fig. 1) in the period 1961– 2012, 500-hPa level geopotential height from NCEP/NCAR reanalysis with a resolution of 2.5° × 2.5° .
 | Fig. 1. Locations of meteorological stations (dots) providing precipitation data. |
The empirical orthogonal function (EOF) analysis and rotated EOF (REOF) are used to determine the basic characteristics of the spring precipitation in Southwest China as well as its spatiotemporal structures.[17] The Mann– Kendall testing method is used to determine the temporal locations of abrupt changes of spring precipitation, [17] with a priori set a = 0.05 significance level. The trend is determined using the fifth-order running trend, and its statistical significance is also tested using a non-parametric Mann– Kendall method. The periodicity information of the spring precipitation is obtained using spectrum analysis.[17] A t-testing is used to test the statistical significance of abrupt changes. Finally, the mean generation function method is used to construct a short-term climate prediction model for the spring precipitation in Southwest China.[17]
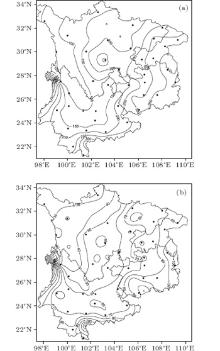
Southwest China has a wide spread of spring precipitation from 54.8 mm to 581.0 mm, with a mean value of 213.5 mm. Spring precipitations range from 6.9% to 33.6% of the annual total for different regions, and a mean value is 20.4%. Figure 2 shows the plots of the mean and the standard deviations of precipitations over the whole Southwest China region. It is evident that the southeastern part has abundant rainfall in spring while the northwestern part has much less rainfall. The dry center is located at Batang County (98° 58′ E, 28° 46′ N) of western Sichuan Province, and the spring precipitation is only 54.8 mm. The largest spring precipitation occurs in the neighboring regions of Gongshan Derung ang Nu Autonomous County (98° 40′ E, 27° 45′ N) of Yunnan Province, and its value is over 580 mm. A secondary local maximum center is located at Tongren County (109° 11′ E, 27° 43’ N) of Guizhou Province, and its value is 402.3 mm. The large ratio (> 10) between the values of maximum and minimum precipitation indicates the nonuniformity of the precipitation distribution over Southwest China. The standard deviation of the precipitation has a similar spatial structure of the precipitation itself, and its maximum is located at Gongshan Derung ang Nu Autonomous County (98° 40′ E, 27° 45′ N) of Yunnan Province (184.1 mm), and a minimum at Batang County (98° 58′ E, 28° 46′ N) of Sichuan Province (24.8 mm). In general, the southern and eastern parts of Southwest China are abundant rainfall areas; the remaining parts of Southwest China are lower rainfall areas. The eastern wet tongue (maximum precipitation region) extends northwestward, passing through the neighborhood of E’ mei Montain (103° 20′ E, 29° 31′ N), to the Xiaojin County (102° 21′ E, 31° 00′ N) of the Aba Tibetan Autonomous Region of Sichuan Province. Such a spatial structure implies that the precipitation of Southwest China may be highly affected by the water vapor transportation driven by the Southeastern surrounding the Pacific Subtropical High, and thereby strengthening (weakening) precipitation over that region in the years of strong (weak) water vapor convergence and transportation.
 | Fig. 2. Long-term mean spring precipitation (a) and its standard deviation (b) in Southwest China (in mm). |
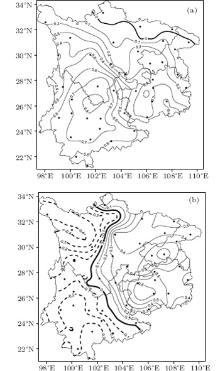
Table 1 presents the variance contribution from the first eight eigenvectors (empirical orthogonal functions). It is shown that the convergence of the sum of eigenvectors for the precipitation in Southwest China is relatively slow. The accumulated variance contribution from the first two eigenvectors is 33.5%, the first four 47.9%, and the first eight 63.2%. The first two eigenvectors are presented in Fig. 3. The first eigenvector (EOF) has positive values all over the domain, with a maximum value at Huili County ((102° 15′ E, 26° 39′ N) of Southern Sichuan. The result implies that Southwest China may be considered as one natural climatological regime for the trend of the spring precipitation over Southwest China, with its representative station being Huili County (102° 15′ E, 26° 39′ N) of Sichuan Province, which has a value of 0.82. The second eigenvector is dominated by a dipole, with zero-line tilting northwest-southeastward and crossing E’ Mei Mountain (103° 20′ E, 29° 31′ N), Xichang region (102° 16′ E, 27° 54′ N) of Sichuan Province, and Luxi County (103° 146′ E, 24° 32′ N) of Yunnan Province. To the east of the zero line, the representative station is the Anshun region (105° 54′ E, 26° 15′ N) of Yunnan Province with a value of 0.70; and to the west, the representative station is Ganzi Tibetan Autonomous prefecture (100° 00′ E, 31° 37′ N) of Sichuan Province with a value of − 0.41, implying that the trend of Southwest China spring precipitation has a component in contrast to the changes in the east and west parts of the Southwest China.
| Table 1. Different EOF variance contributions of spring precipitation in Southwest China. |
 | Fig. 3. The first (a) and second (b) characteristic vectors of spring precipitation in Southwest China. |
After rotating the first eight vectors to maximize the explained variance and summing the first five rotated eigenvectors (with a total explained variance of 52.5%), five distinctive natural climatological regimes are obtained: western Sichuan Plateau, Sichuan Basin, Hengduan Mountain region, Yunnan Plateau, and eastern Guizhou Hilly Area.
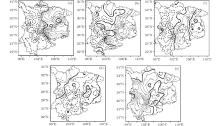
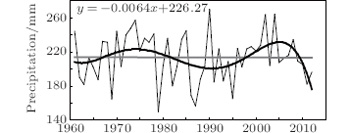
To quantify the variation of spring precipitation in Southwest China, we calculate the percentages of positive anomaly and negative anomaly. There appeared a positive anomaly in the data of a 25-year temporal span, and a negative anomaly was observed in the data of a 25-year temporal span. The interannual variability of spring precipitation is large, e.g., the fluctuation in 1990 reached a maximum value of 270.3 mm while the fluctuation in 1979 was as small as 149.8 mm. The maximum interannual fluctuation almost doubles that of the minimum. From Fig. 4, it can be identified that the fluctuating spring precipitation in Southwest China has decreased slowly in the last 52 years. Further analysis of mean anomalies over different decades (with respect to the mean in the period of 1981– 2010 over the whole Southwest China) is presented in Fig. 5. In the 1960s, the positive anomalies were located in eastern Sichuan Province, Guizhou Province, and most part of Chongqing City, while negative anomalies dominated other areas. The most evident increase of precipitation appeared in the Fengjie region (109° 32′ E, 31° 01′ N) of northeast Chongqing City: the positive anomaly reached 27%. In contrast, in the central area of Yunnan the negative anomaly was 38%. In the 1970s, Chongqing City, Guizhou Province, northern Sichuan Province, and eastern Yunnan Province each were dominated by a positive anomaly, other areas were each dominated by a negative anomaly. The increase of spring precipitation was most evident in eastern Yunnan Province and southwestern Guizhou Province: the positive anomaly reached 28%. In contrast, the central Yunnan Province (in the vicinity of Dali City) had the most evident decrease of precipitation: the negative anomaly was 25%. In the 1980s, eastern and western parts of Southwest China each had a negative anomaly and other areas each had a positive anomaly. The increase of spring precipitation was most evident in the Zhaotong region (103° 43′ E, 27° 21′ N)– Yibin region (104° 34′ E, 28° 42′ N) of northeastern Yunnan Province: the positive anomalies range from 15% to 20%. In contrast, the decrease of spring precipitation occurred mostly in the western Sichuan Province and central Yunnan Province: the negative anomaly reached 28%. In the 1990s, the northwest part of Southwest China, southeastern and northwestern parts of Yunnan province, and northeastern part of Chongqing City each were dominated by a positive anomaly, and other areas each were dominated by a negative anomaly. The most evident increase of positive spring precipitation occurred in the Shangri-La region (99° 42′ E, 27° 50′ N) of northwest Yunnan Province: the positive anomaly was 18%. In contrast, the precipitation decrease was most evident in the southern Yunnan Province: the negative anomaly was 23%. In the 2000s, northwestern Sichuan Province, northwestern Yunnan Province, and the border region between Yunnan Province and Guizhou Province and its extension to the Suining region (105° 33′ E, 30° 30′ N) of Sichuan Province each were dominated by a positive anomaly and other areas each were dominated by a negative anomaly. The precipitation increase is most evident in the central Yunnan Province: its positive anomaly reached 37%. In contrast, the northeastern and northwestern areas of Yunnan Province had the most evident decrease of spring precipitation: the negative anomaly was 10%.
 | Fig. 4. Variations of spring precipitation with time in Southwest China. |
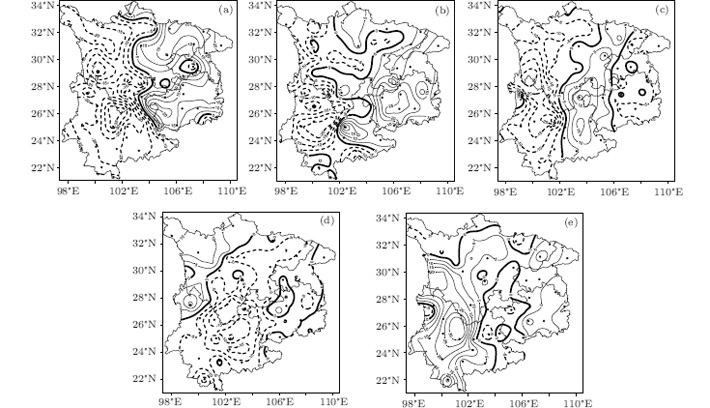 | Fig. 5. Percentages of spring precipitation anomaly in Southwest China in the (a) 1960s, (b) 1970s, (c) 1980s, (d) 1990s, and (e) 2000s. |
In summary, the 2000s was the decade of the largest quantity of spring precipitations in the last half century in Southwest China. The 1960s were dominated by above normal spring precipitation in the northeastern part and below normal spring precipitation in the southwestern part. In the 1970s, the eastern part had above normal precipitation, and the western part below normal precipitation. The 1980s featured below normal precipitation in both the eastern and western parts but above normal in the central parts. The 1990s featured above normal precipitation in the northwestern part and below normal elsewhere.
Linear fitting to the spring precipitation anomaly in Southwest China shows a slow steady decrease of spring precipitation, with a slope of − 0.01. From Fig. 4, it is identified that the spring precipitations in the periods of 1967– 1983 and 1998– 2009 were above normal; whereas those in the periods of 1961– 1966 and 1984– 1997 were below normal. The above normal spring precipitation in the first decade of the 21st century shows that the spring precipitation has increased.
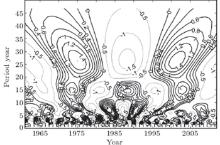
Morlet wavelet analysis of spring precipitation in Southwest China has been characterized by multiscale variability.[17] The dominant timescales of variability are 15 years and 25 years. The 15-year variability is evident through the whole temporal domain of analysis, i.e., 1961– 2012; it has a below-above-below-above-below-above-below normal pattern, the spring precipitations in the time periods of 1961– 1969, 1978– 1984, 1993– 1999, 2007– 2012 were below normal. The spring precipitation in 2012 was close to normal, implying an above normal precipitation in the coming years. Between these periods, the spring precipitation was above normal. The 25-year cycle appears to be most dominant, with a below-above-below-above-below normal pattern. For that cycle, the time periods of 1961– 1969, 1983– 1994, and after 2009 featured below normal spring precipitation. Between these periods, the spring precipitation corresponding to this cycle was below normal. The variability of timescales shorter than 15-years does not show any regular cycle, for the variability of each of the shorter timescales is very noisy.
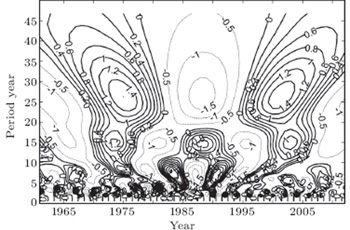 | Fig. 6. Wavelet analysis of spring precipitation in Southwest China. |
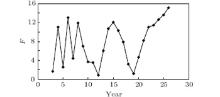
Spectral analysis of the spatial standard deviation of spring precipitation in Southwest China shows peaks of 6-year, 8-year, and 15-year in the spectral diagram, which is presented in Fig. 7.
 | Fig. 7. Spectrum analysis of the spatial standard deviation (F) of spring precipitation in Southwest China. |
The Mann– Kendall test method and moving t-test method are used to detect the abrupt changes of spring precipitation in Southwest China.
To determine whether the spring precipitation in Southwest China has experienced abrupt changes, we use the Mann– Kendall testing method to analyze area averaged precipitation series.[17] The Mann– Kendall testing method is a currently widely used non-parametric method. It does not assume any a priori distribution of sample and is not sensitive to a small number of abnormal extremes. It can be applied to both categorized data and series with intuitively simple calculations. One of the advantages of this method is its capability of determining the locations of mean or slope changes; and therefore, is a method that can detect abrupt changes. Figure 8 presents the detecting results, showing that the spring precipitation started to increase at the mid 1960s and was maintained until 1980. From 1980, the spring precipitation began to decrease. From the mid 1990s, the spring precipitation began to increase again. These changes appear to be abrupt, and 1966, 1979, and 1995 are considered to be the temporal locations with the abrupt changes. All these changes are statistically significant with a considerable level of a = 0.05 (u0.05 = ± 1.96).
 | Fig. 8. Abrupt changes of spring precipitation in Southwest China, obtained from (a) the Mann– Kendall test and (b) the moving t-test, respectively. |
The moving t-test method is used to detect the abrupt changes of spring precipitation from 1961 to 2012. Here assume that n = 52, two sub-sequence lengths n1 = n2 = 10, the significant level α = 0.05, and t0.05 = ± 2.10, then the sequence of the t statistic will be calculated and mapped together with t0.05 = ± 2.10 (Fig. 8(b)). From the graph, it can be seen that the t statistic is more than the level of significance 0.05 twice from the 1970s. One is positive (in 1978), and the other is negative (in 1995). This indicates that there have been two abrupt changes of spring precipitation in Southwest China in the past 52 years. It experienced a change from more to less in the 1970s, and a change from less to more in the 1990s.
Spring is an interim season with large precipitation variability and few prediction skills. It contains both the signatures of winter circulation and summer circulation. The interplay of these two types of circulation makes spring circulation have dramatic changes. For this reason, analyzing the abnormal circulation in spring is critical to understand the structure and evolution of spring precipitation.[18– 20]
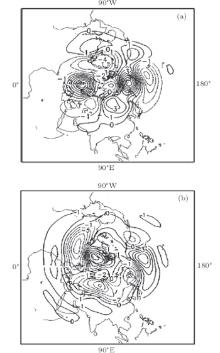
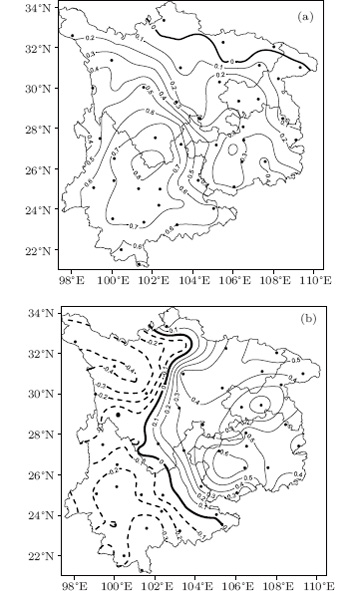
The analysis of the relationship between precipitation and geopotential height can help to reveal how the synoptic system affects spring precipitation in Southwest China. As shown by the composite 500-hPa level geopotential maps in Fig. 9, in which figure 9(a) shows the rainy spring scenario and figure 9(b) displays the droughty spring scenario, the negative height anomaly in Eurasia extends from the Ural Mountains to the Mediterranean. Most Asian regions north of 38° N have a positive height anomaly. Lake Baikal features the center of 3 dagpm. A negative anomaly extends to the south, and a negative center extends from the east Bay of Bengal to the Indochina Peninsula. These features constitute a pattern that is west-low and east-high in high latitude Eurasia and north-high and south-low in Asia. The corresponding surface pressure field (not shown here) displays a vast region with a positive surface pressure anomaly (east to 90° E with its center located in the vicinity of Lake Baikal and Mongolian). For the droughty years, in contrast, the 500-hPa level geopotential map (Fig. 9(a) shows the rainy spring scenario and figure 9(b) displays the droughty spring scenario) features a positive anomaly in the polar region, a wide spread negative anomaly region covering mid- and high-latitude areas in the Atlantic, Europe, and Asia, with a central anomaly lower than 5 dagpm, and a positive anomaly center over Europe and Asia regions south to 40° N. The surface map shows a negative anomaly region covering most of Asia south to Lake Baikal, with its center located at northwest China.
These analyses show that there are major differences in the circulation pattern between rainy spring year and droughty spring year. For the rainy spring year, geopotential height anomaly features a pattern that is west-low and east-high in mid- and high-latitude areas of Eurasia, a north– south dipole in Asia with a positive anomaly to the north of 38° N and a negative anomaly to the south. Corresponding to these patterns, the mid-latitude area has an easterly anomaly and a weakened westerly zone, and the major circulation has a strong meridional component in eastern Asia, which is favorable for the cold surge to frequently move southward. For the droughty spring year, the geopotential height anomaly has a more zonal pattern, with positive centers located in the polar region and south to 40° N and a negative anomaly in between. This pattern of geopotential height anomaly corresponds to a westerly anomaly that enhances the westerly jets. Under such a kind of circulation, Siberia High is relative weak and the cold surge can hardly move to Southwest China. It is clear that in the rainy spring year, anomalous cyclonic circulation extends from the Indochina Peninsula to Southwest China, and Southwest China has an easterly anomaly. In the droughty year, the Bay of Bengal, Indochina Peninsula, and South China Sea feature anomalous anticyclonic circulation, a weakened southern trough, and a westerly or northerly anomaly.
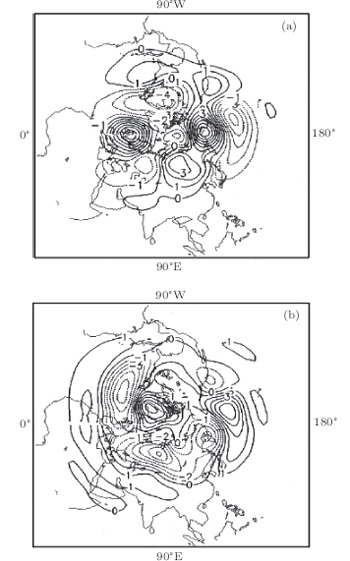 | Fig. 9. 500-hPa geopotential height anomaly distribution of spring in the rainy year (a) and droughty year (b) in Southwest China |
The coupled climate model projection of future spring precipitation in western China by Zhang et al.[21] predicts an increasing precipitation in the next eight decades. This increasing trend starts with little change in the first decade, and will have about 15% precipitation increase in the later years of the 80 year projection. By 2050, the largest precipitation area will have been in Southwest China, with an annual precipitation increase being over 200 mm.
In this study, we use a mean generating function to construct a spring precipitation model for Southwest China. Following the study by Wei et al., [17] for a given time series of n samples

the mean generating function is defined as

where i = 1, 2, … , l; l = 1, 2, … , m; nl = int(n/l); m = int(n/2) is the maximum possible period.
The cyclic extrapolation of

where t = 1, 2, … , N+ q; q is the prediction span. In this way, one obtains M periodic series of length N + q. Using these time series as predictors for a multivariable regression model, we obtain the prediction value of n+ q location, i.e.,

In Eq. (4), the coefficient is obtained using a least-square method.
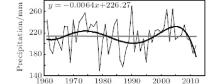
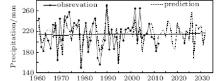
We use the 1961– 2002 period data to determine the model parameters. The model is then used to make retrospective predictions of spring precipitation for an independent period 2003– 2012. As shown in Fig. 10, the model can fit the model training data with a 78.6% accuracy, and predict independent verification period with a 80.0% accuracy. The model error is large in the 1960s and the fitting accuracy has improved since the 1970s.
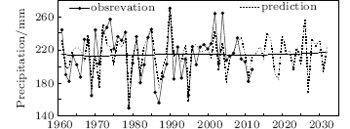 | Fig. 10. Projection of future spring precipitation in Southwest China (in mm). |
The future spring precipitation in Southwest China is predicted to have a slow steady increase. This result implies that the future increase of precipitation, as predicted by Zhang et al., [21] is season-dependent; and main contribution to the increase of future precipitation in Southwest China comes mainly from the increased precipitations in summer, autumn, and winter seasons, but not in the spring season.
(i) The spring precipitation in Southwest China is extremely nonuniform. The driest area is located at Batang of western Sichuan Province: the spring precipitation is only 54.8 mm. The largest spring precipitation occurs in the neighboring regions of Gongshan of Yunnan Province: its value is over 580 mm. Southern and eastern parts of that region are abundant in precipitation while other areas are dry. The first EOF has the same sign values all over the domain; the second EOF is dominated by a dipole, implying the presence of two natural climatological regimes; and the third EOF implies five distinctive natural climatological regimes: Western Sichuan Plateau, Sichuan Basin, Hengduan Mountain region, Yunnan Plateau, and eastern Guizhou Hilly Area.
(ii) The spring precipitation in Southwest China has a strong interannual and decadal variability. The largest interannual fluctuation occurred in 1990 with a value of 270.3 mm while the smallest fluctuation was in 1979 with a value of 149.8 mm. The maximum interannual fluctuation almost doubles that of the minimum. Cyclic changes appear to exist on different timescales, with a dominant pattern of below-above-below-above-below-above-below normal precipitation. Spectrum analysis shows that the large amplitude cycles include those of 6-year, 8-year, and 15-year periods.
(iii) From a decadal perspective, the 2000s is the decade of the largest quantity of precipitation while the 1990s is the decade of the smallest quantity of precipitation. There were three abrupt changes of spring precipitation from 1961 to 2012. 1966 was the year that had an abrupt increase; 1979 had an abrupt decrease; and the 1995 had an abrupt increase again. All these abrupt changes have a statistical significance of the a = 0.05 (u0.05 = ± 1.96) level.
(iv) There are major differences in the circulation pattern between an abundant precipitation year and a dry year. In the abundant precipitation year, 500-hPa geopotential height anomaly features a west-low east-high pattern in mid- and high-latitude areas in Eurasia and a pattern of north-positive south-negative with respect to 38° N in Asia. In the dry year, 500-hPa geopotential height anomaly features only one north-negative south-positive pattern in both Europe and Asia, with a weakened southern trough. The spring precipitation in Southwest China will slowly increase in the next two decades.
(v) There remain other factors that affect the spring precipitation in Southwest China which need to be investigated. What are the roles they play? Which factor is the key factor? Numerical simulations with sensitivity experiments may help to obtain the answers. These are our future works.
| 1 |
|
| 2 |
|
| 3 |
|
| 4 |
|
| 5 |
|
| 6 |
|
| 7 |
|
| 8 |
|
| 9 |
|
| 10 |
|
| 11 |
|
| 12 |
|
| 13 |
|
| 14 |
|
| 15 |
|
| 16 |
|
| 17 |
|
| 18 |
|
| 19 |
|
| 20 |
|
| 21 |
|