Controlling cooperativity of a metastable open system coupled weakly to a noisy environment
Teslenko Victor I.a)†  , Kapitanchuk Oleksiy L.
a)‡ , Yang Zhaob)§
, Kapitanchuk Oleksiy L., Yang Zhao 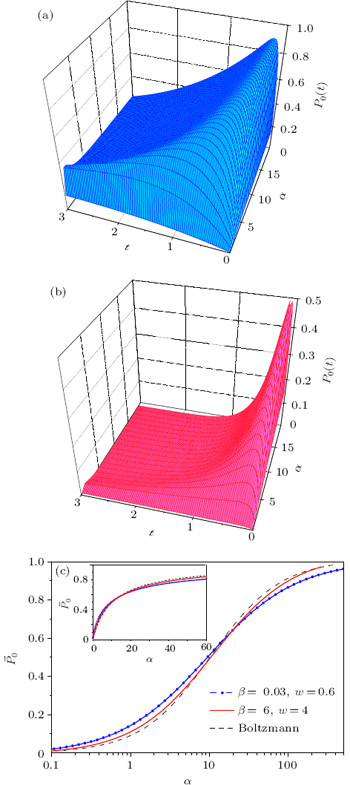
Controlling cooperativity of a metastable open system coupled weakly to a noisy environment |
|
Teslenko Victor I.
, Kapitanchuk Oleksiy L., Yang Zhao |
| 3D plots of output level population P 0( t ) versus time and running parameter α for the two sets of tuned parameters β and w (all in inverse time units): (a) β = 6; w = 4 (in red) and (b) β = 0.03; w = 0.6 (in blue); and (c) the corresponding curve fittings of population peaks with using the linear (inset) or log scales of α (solid red and blue lines, respectively) in comparison with the Boltzmann curve (dashed lines). |
| |