Temperature effect on the electronic structure of Nb:SrTiO3 (100) surface*
[Zhang Shuang-Honga), b) , Wang Jia-Oub)†  , Qian Hai-Jie
b) , Wu Ruib) , Zhang Nianb) , Lei Taob) , Liu Chenb) , Kurash Ibrahim]
, Qian Hai-Jie|
|

 , Qian Hai-Jie
Corresponding author. E-mail: wangjo@ihep.ac.cn
Project supported by the Funds from the Chinese Academy of Sciences (Grant No. 1G2009312311750101) and the National Natural Science Foundation of China (Grant No. 11375228).
The effect of temperature on the electronic structure of Nb-doped SrTiO3 (100) surface is investigated by high-resolution synchrotron radiation photoemission spectroscopy. According to the x-ray photoemission spectroscopy (XPS) results, at an annealing temperature of less than 700 °C, the adsorbed carbon and hydroxyl on the STO surface could be removed, to expose the fresh intrinsic surface with a constant ratio of Ti/O. It is obvious that the STO would be doped by Ca+ impurities of bulks and O vacancies in the surface after annealing at 920 °C for one hour.
SrTiO3 (STO) is an oxide with a typical perovskite structure, and the electronic structure of the STO surface has attracted much attention.[1] STO also has many excellent applications, such as surface catalysis, water photolysis, and blue-light emission.[2– 5] In stoichiometric form, STO is an optically transparent insulator with a high dielectric constant (high k). Its intrinsic properties can be finely tuned and extrinsic ones can be introduced through different kinds of dopings with other elements.[6] Furthermore, its lattice structure forms high-quality interfaces with many other complex oxides, [7– 9] such as high Tc superconducting YBaCuO thin films, [10, 11] magnetic La0.67Ca0.33MnO3− δ , CaSrRuO3 thin films, [12, 13] and LaCoO3/STO heterostructures.[14] Based on the above reasons, the recent research in STO has focused on the applications of surface and interface in areas ranging from nano-electronics to photonics.[15, 16] Especially, STO interfaces with other oxides display a series of interesting phenomena, for example, the most widely studied LaAlO3/STO interface shows a two-dimensional electron gas (2DEG).[17] However, it is still necessary and important to clarify the surface electronic structure of STO and prepare high-quality surfaces to further understand these properties of STO-based devices.
The preparation of the STO surface can be divided into two methods, i.e., wet chemical etching and ultrahigh vacuum (UHV) annealing; there is no best preparation method that is universally acknowledged.[18– 20] Polli et al.[21] investigated a wet chemical etching on the surface of the STO substrate with a BHF solution to produce a homogeneous surface morphology. However, this processing method is somewhat complicated, which is prone to introducing impurities into the surface.[21– 23] In our work, we use UHV annealing for STO treatment, which is simple, direct, rapid, and pure.[24– 27] However, annealing at high temperatures leads to Ca impurities, O vacancies, and other defects.[28] Quite a few researches of surface treatment of STO have been carried out by surface morphology.[19, 29– 31] In this paper, we study the surface electronic structure and chemical state during the annealing in the UHV process by in situ photoelectron spectroscopy.
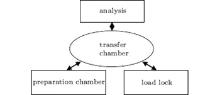
The in situ x-ray photoelectron spectroscopy and ultraviolet photoelectron spectroscopy (UPS) measurements are performed at beam line 4B9B of the Beijing Synchrotron Radiation Facility (BSRF). Synchrotron radiation light which is monochromated by four high-resolution gratings and equipped with a hemispherical energy analyzer has photon energy in a range from 10 eV to 1100 eV. The united instrument is composed of four functional chambers as shown in Fig. 1. The background vacuum is 5× 10− 10 Torr (1 Torr = 1.33322× 10² Pa) in all of the chambers.
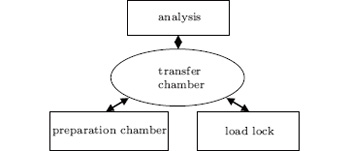 | Fig. 1. All UHV chambers used in our experiment. |
The commercial STO is 0.7-wt% Nb-doped with (100) orientation, which can avoid any charging effects during the spectral measurements.
All the samples in the atmosphere are repeatedly cleaned, first in acetone for 10 minutes with ultrasonic agitation and then in ethanol for 10 minutes. The total exposure time to air is just 10 minutes. In this paper, all STO samples are transferred from the loadlock chamber to the preparation chamber and annealed in UHV at different temperatures (see Table 1). The temperatures are measured with an infrared thermometer. After annealing, the STO samples are transferred into the in situ analysis chamber. Some STO samples are annealed in UHV for 1 hour at temperatures from 350 ° C to 920 ° C. We obtain a series of XPS data, including full-range spectra, the C 1s, O 1s, Ti 2p, Sr 3d, and the valence band spectra (VB) at room temperature. All these core level spectra are calibrated by the Au 4f peaks.[32]
| Table 1. All processing conditions of STO samples. |
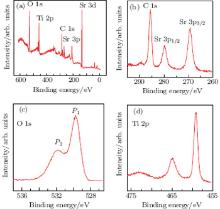
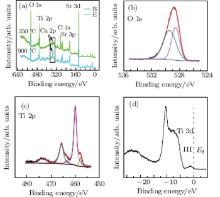
The XPS spectra of non-annealed STO are shown in Fig. 2. The characteristic peaks are shown in Table 2.
 | Fig. 2. (a) XPS spectrum collected from a pristine STO (100), and the chosen photo-energy is 720 eV. The XPS spectra from the C 1s (b), O 1s (c), Ti 2p (d) regions are collected at the pristine STO sample with the same photo-energy (hν = 720 eV). |
| Table 2. Average core level binding energies (BEs) of the O 1s, Ti 2p, Sr 3p, Sr 3d, and C 1s peaks collected from the non-annealed STO sample. |
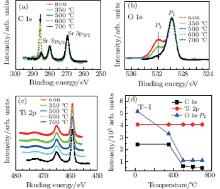
The pristine STO samples are annealed in UHV from 350 ° C to 700 ° C, respectively in Fig. 3. When the sample is annealed at 350 ° C, the C 1s peak (285.6 eV) intensity has no change. However, we observe that the P2 part of oxygen peaks in Fig. 3(b) is dramatically reduced, which is attributed to hydroxyl species absorbed on the surface.[38] With the temperature increasing to 500 ° C, the C 1s intensity enormously decreases, and the P2 part of O 1s also decreases, which implies that the hydroxyl bonded with carbon contaminants of the surface. We observe that the C 1s peak moved toward a lower binding energy (285.6 eV → 284.8 eV) after annealing at 500 ° C, which is caused by the evolution of the chemical group from C– OH to C– C.[39] When the temperature increases to 700 ° C, there are few C– C groups, which means that the surface adsorption of pollutants are completely cleaned, [40] which is also indicated by the evolutions of C 1s and O 1s– P2 peak intensity in Fig. 3(d).
 | Fig. 3. The XPS spectra of C 1s (a), O 1s (b), Ti 2p (c), and (d) variations of all three peak intensities with temperature. All peak intensities are normalized to unity. |
The Ti 2p core level spectra do not show significant variation, suggesting that the Ti– O layer is chemically stable and all the Ti ions exist in the oxidation state of the Ti4+ during the whole treatment (Figs. 3(c) and 3(d)).
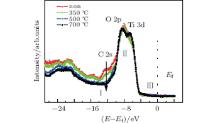
The valence band spectrum with a photo-energy of 75 eV is used, which is more sensitive to the surface chemical component. Figure 4 includes all of the valence band spectra for the pristine and annealed samples. The part I (about − 12 eV) is the C 2s peak, whose intensity gradually decreases with the annealing temperature increasing. When the annealing temperature reaches 350 ° C, the C 2s peak intensity has a small reduction. At an annealing temperature of 500 ° C, the C 2s peak intensity is greatly reduced and disappears at 700 ° C. This phenomenon is consistent with the XPS results. Part II (from − 7 eV to − 5 eV) belongs to bonding states between O 2p and Ti 3d states, and we also find them to change with the annealing temperature increasing. After the sample surface is annealed at less than 500 ° C, the valence band is mixed with that of contaminants, which is mainly derived from C 2s and O 2p coming from hydroxyl.[41] With the annealing temperature increasing, the surface contaminants disappear gradually, and the fresh sample surface is exposed, so that the Ti 3d and O 2p hybrid peaks in STO become more and more distinct.[42] At around 2 eV below the Ef (part III, ∼ − 2 eV), the prominent feature of the Ti 3d state is not found, which indicates that the STO sample annealed at 700 ° C for 1 h has no oxygen defects in the surface.[28]
 | Fig. 4. Valence bands of the pristine, 350 ° C, 500 ° C, and 700 ° C UHV-annealed STO samples. Peak intensities are normalized to unity. The photo-energy is 75 eV. |
When the sample is annealed at 920 ° C for 1 hour, XPS and UPS show important differences in electronic structure from that annealed below 700 ° C. As shown in Fig. 5(a), Ca 2p (BE = 349.06 eV, 352.56 eV) peaks exclusively appear at the elevated annealing temperature. It is obvious that the sample surface is doped by calcium Nb-doping STO (100) single crystals.[43] The previous reports indicate that calcium impurities come from two avenues, i.e., from post-polishing or polishing cleaning solutions and from crystal growth. The high-temperature annealing would cause calcium to diffuse from the bulk to the surface.[21] Figure 5(a) suggests that calcium should come from the segregation from the bulk during the heat treatment.[43, 44] The O 1s peak in Fig. 5(b) exhibits significant broadening, which may be from the oxides of the calcium of the STO surface.[38]
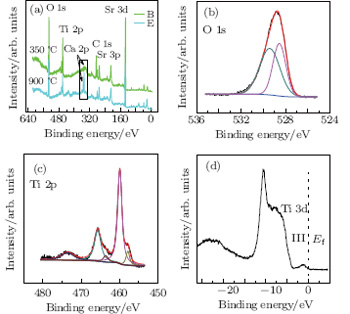 | Fig. 5. XPS spectra (a) collected from STO surfaces at 350 ° C and 920 ° C. The O 1s (b), Ti 2p (c), and valence band (the photo-energy is 75 eV) (d), spectra are from the STO surface after annealing at 920 ° C. |
Figure 5(c) shows the Ti 2p XPS spectrum, which includes some additional peaks. The small shoulder structures could be fitted to BE = 457.85 eV and 463.59 eV peaks. The other peaks were also observed in Ti 2p XPS of Ti3O5 that co-exist with Ti4+ and Ti3+ , [45] which implies that too many oxygen vacancies in the Ti– O layer surface make Ti4+ decrease to Ti3+ .[46, 47] Figure 5(d) shows the valence band spectrum for the annealed temperature at 920 ° C. According to Ref. [48], a small peak near Fermi energy, part III (∼ − 2 eV) is generally considered as the Ti 3d state due to O vacancies.
In a word, it has been observed that high-temperature annealing in UHV brings the calcium segregation from the bulk to the surface, and many oxygen vacancies in the Ti– O layer reduce Ti4+ to Ti3+ . That is, a high annealing temperature, for example, 920 ° C, can cause the irreversible damage in STO substrates.
The electronic structures of Nb doping STO surface through annealing in UHV at different temperatures are studied by synchrotron radiation photoelectron spectroscopy. It is confirmed that the annealing process could remove the surface impurities such as carbon and hydroxyl, and Ti– O layers remain stable when the temperature is less than 700 ° C. For the annealing at 700 ° C, we can obtain a fresh and clean STO sample surface with no O vacancies. With temperature increasing to 920 ° C, the calcium segregates from the bulk to the surface and lots of O defects appear. In conclusion, excessive heating conditions imply irreversible damage in the STO surface.[42, 49]
| 1 |
|
| 2 |
|
| 3 |
|
| 4 |
|
| 5 |
|
| 6 |
|
| 7 |
|
| 8 |
|
| 9 |
|
| 10 |
|
| 11 |
|
| 12 |
|
| 13 |
|
| 14 |
|
| 15 |
|
| 16 |
|
| 17 |
|
| 18 |
|
| 19 |
|
| 20 |
|
| 21 |
|
| 22 |
|
| 23 |
|
| 24 |
|
| 25 |
|
| 26 |
|
| 27 |
|
| 28 |
|
| 29 |
|
| 30 |
|
| 31 |
|
| 32 |
|
| 33 |
|
| 34 |
|
| 35 |
|
| 36 |
|
| 37 |
|
| 38 |
|
| 39 |
|
| 40 |
|
| 41 |
|
| 42 |
|
| 43 |
|
| 44 |
|
| 45 |
|
| 46 |
|
| 47 |
|
| 48 |
|
| 49 |
|