
Characterization of plasma current quench during disruption in EAST tokamak*
[Chen Da-Longa) , Granetz Robertc) , Shen Biaoa) , Yang Feia) , Qian Jin-Pinga)†  , Xiao Bing-Jia
a), b) ]
, Xiao Bing-Jia|
|


Corresponding author. E-mail: jpqian@ipp.ac.cn
Project supported by the National Magnetic Confinement Fusion Science Program of China (Grant Nos. 2014GB103000 and 2013GB102000) and the National Natural Science Foundation of China (Grant No. 11205199 and 11205192).
A preliminary analysis of plasma current quenching is presented in this paper based on the disruption database. It demonstrates that 26.8% of discharges have been disrupted in the last 2012 campaign, in addition, the plasma disruptive rate grows with the increase of plasma current. The best-fit linear and instantaneous plasma current quench rate is extracted from the recent EAST disruptions, showing that an 80%–30% interval of the maximum plasma current is well fit for the EAST device. The lowest area-normalized current quench time is 3.33 ms/m2 with the estimated plasma electron temperature being 7.3 eV,∼9.5 eV. In the disruption case the maximum eddy current goes up to 400 kA, and a fraction of currents are respectively driven on the upper and lower outer plate with nearly 100 MPa–200 MPa stress in the leg.
The effect of disruption not only terminates the high powerful discharges but also can cause severe damage to some components inside the vacuum vessel through electron-mechanical forces acting on the in-vessel component and thermal loading on the first wall. A major disruption usually proceeds in three phases. The first phase is the thermal quench on a time scale of less than 1 ms. This can be easily seen from the rapid collapse of electron temperature obtained from the measurement of the soft x-ray emission. The second phase is the current quench normally on a time scale of up to 10 ms. This phase shows the rapid decay of plasma current, owing to the fact that too many impurities are injected into the discharge and the plasma becomes more resistive, followed by a heavy halo current and eddy current generated in the in-vessel component. In the end, a fraction of plasma current sometimes is converted into runaway electron beams because of the instantaneous decay of the plasma current. The detailed presentation can be seen in the ITER disruption database (IDDB).[1, 2]
Analysis of plasma current quench (CQ) known as CQ time is very important for ITER in-vessel component design and disruption mitigation duration.[3] In experiments the plasma CQ rate normally uses a linear fit waveform instead of an exponential fit, and the linear decay definition is different from device to device.[1] As for the EAST tokamak, [4] an 80%– 30% interval of the maximum plasma current seems to be a much better fit for the CQ period. This is because after the quench, the plasma current measurement includes a significant quantity of induced eddy current flowing in conducting structures inside the vacuum vessel. These eddy currents decay on a different timescale from the plasma current. Therefore, in the determination of the CQ time, the data after the quench should be excluded. Therefore, with this unique definition on EAST the minimum CQ time is calculated to be 3.2 ms. For a better comparison of the CQ time in disparate devices, the typical CQ time is normalized by the plasma cross-sectional area (denoted as S). Based on some conventional tokamak (ASDEX-U, ALCATOR C-MOD, DIII-D, JET, and JT-60U) results, the lowest tCQ/S for ITER is 1.67 ms/m2.[5, 6] In the EAST disruption database, this limit boundary is 3.33 ms/m2, much slower than that of the ITER design. As noted in Ref. [7], the eddy current interacting with the poloidal field results in a large J × B force on the structure component. Data demonstrate that the maximum eddy current reaches 400 kA with the − dIp/dt ∼ 160 MA/s, simultaneously a fraction of eddy current is driven on the outer divertor plate.
In this article, the disruption database is presented in Section 2. The analyses of current quench and eddy current are given in Section 3. Finally some conclusions are drawn from the present study in Section 4.
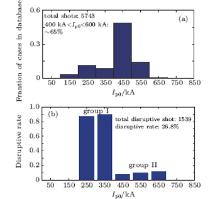
In the experiment campaign of 2012, graphite tiles in the low heat load area of the main chamber wall were replaced by molybdenum, while divertor components kept the graphite tile as the first wall.[8, 9] For measuring the plasma current, three Rogowski coils were located in the in-vessel. Besides, two Rogowski coils located in the out-vessel were for measuring the eddy currents in the vacuum vessel.[10, 11] In this paper, the database analysed just includes the discharges in the 2012 campaign with the total number of shots being 5743, which are shown in Fig. 1(a), plasma currents typically are between 400 kA and 600 kA, and the highest plasma current is 652 kA at discharge #42328.
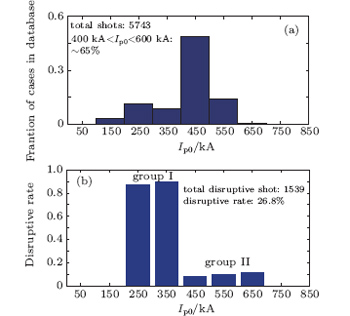 | Fig. 1. (a) Distributions of plasma currents for all discharges. (b) Distributions of plasma currents in the disruption database. The data collected above are from the 2012 EAST experiment campaign. |
In the data collected above, the limited conditions for the disruption case should be adjusted by the criteria that are shown in Table 1. In this table it should be noted that (i) τ discharge is the duration time of the discharge, the length of pulse must be more than 600 ms; (ii) τ CQ is the CQ time, which means that the CQ time should be less than 50 ms, typically this value is in 10 ms; (iii) Ip, final is the minimum plasma current within 15 ms after the discharge has disrupted, this criterion is for rejecting a minor disruption, such as some small crashes in the discharge; (iv) Ip0 is the plasma current before CQ; (v) Ip, max is the maximum plasma current; (vi) this criterion is for rejecting shots that disrupt late in current ramp down. Therefore, under these limited conditions, the disruption data are successfully obtained and shown in Fig. 1(b), from which it is easily seen that 26.8% of discharges are disrupted. The interesting thing is that the disruptive rate in group I (200 kA < Ip0 < 400 kA) is much higher than that in group II: this is because group I occurs in the beginning of the campaign: at that time the first wall was not clean enough for discharge, so many impurities were injected into the plasma volume, and after many clean shots, the discharge became normal. In group II it is easily seen that the plasma disruptive rate grows with the increase of plasma current. In the next experimental campaign, the heating powers of EAST will be 1-MW ECRH, 12-MW ICRF, 4-MW-NBI, [12] and 10-MW LHCD respectively. As the heating power increases, the plasma current goes up to 1 MA, so disruption analysis becomes more and more important for device safety.
| Table 1. Criteria for disruption on EAST. |
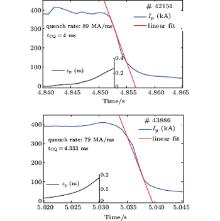
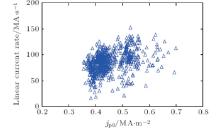
Current quenching usually follows thermal quenching. As the plasma facing component is severely eroded by thermal loading, many impurities are injected into the plasma volume, and plasma becomes much more resistive. Typically, disruption can be divided into two types: major disruption and vertical displacement event disruption.[13] For the current waveforms of these two types, the linear quench rate (80%– 30% maximum plasma current) is a good fit as seen in Fig. 2, and normally the linear fit method varies from device to device (80%– 20% current for ASDEX-U and Alcator-C-Mod; 90%– 10% for DIII-D, TFTR, and J-TEXT; 100%– 40% for JET, maximum dIp/dt for JT-60U).[1, 2, 14] However, on EAST the plasma current typically decays slowly in the end at 30% current, which is possibly because much eddy current threads through the Rogowski coil, which is located behind the first wall as seen in Fig. 2. This scenario is suitable for both major disruption and VDE disruption. Therefore, the current quench rate data are obtained by using this linear fit, a scatter plot of the quench rate against the pre-disruption current density is shown in Fig. 3. The 80%– 30% quench rate is used to estimate the current quench time (τ CQ) as seen in the next subsection.
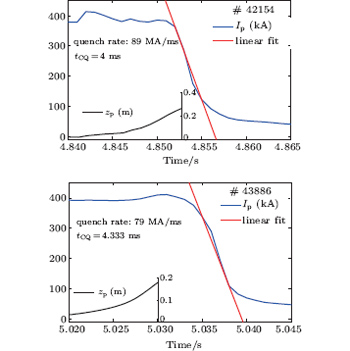 | Fig. 2. The Ipt and Zcentroid waveforms for two types of disruptions (#42154, #43886) with both using 80%– 30% linear fit. |
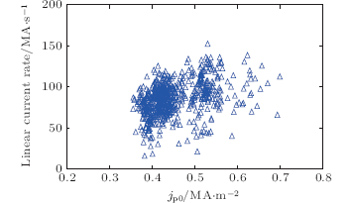 | Fig. 3. Linear quench rate versus pre-disruption plasma current density. |
As discussed above, the τ CQ is defined as

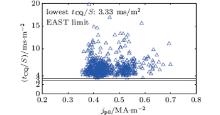
where τ 30 and τ 80 are respectively the times for the plasma current to decay. As seen in Fig. 4, the minimum τ CQ is 3.2 ms; most quench times concentrate in a range from 4 ms to 6 ms. The quench time data collected are used to estimate the lowest τ CQ for ITER, theoretically τ CQ = μ 0a2/η p where a is the plasma minor radius and η p is the resistivity of the core plasma. So for better comparing the devices with each other, the quench times should be normalized by their corresponding areas, as shown in Fig. 5, the lowest τ CQ/S on EAST is 3.33 ms/m2. Listed in Table 2 are the plasma parameters and the results from the database for CQ analysis on EAST.[15]
 | Fig. 4. Distribution of current quench time. Most of CQ times are between 4 ms to 6 ms, the minimum CQ time is 3.2 ms at shot No. #42045. |
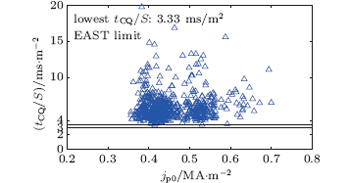 | Fig. 5. Plot of density of pre-disruption plasma current versus normalized quench time, S is pre-disruption plasma cross-sectional area. The limit τ CQ/S for EAST is 3.33 ms/m2, much lower than the ITER limit. |
| Table 2. Plasma parameters and analysis results for current quench database. |
To estimate the electron temperature of the plasma in quench time, the plasma is considered as a simple series circuit consisting of L and Rp, with τ CQ = L/R, where L is the plasma self-inductance, R is the plasma resistance, which is the characteristic time of Ip decay. Taking R as 2π Rpη p/S, then τ CQ/S can be defined as

Here, τ CQ/S can be easily obtained from the database, and plasma self-inductance L[16] can be given by L = μ 0Rp(ln(8Rp/ap) − 2 + li/2), where ap is the plasma minor radius and li is the plasma internal inductance. Taking shot #42045 for example, the value of L is calculated to be 5.077 μ H with ap ∼ 0.451 m, Rp ∼ 1.844 m, and li ∼ 1.407. The simplest form of the plasma resistivity parallel to the magnetic field, as evaluated by Spitizer, [17] is

where lnΛ is assumed to be 10 for the temperature below 50 eV, [18]Zeff is estimated to be 4 ∼ 6, η pal = 0.1316 × 10⁻³ Ω · m, finally Te can be written as

where 1 eV = 104 K, therefore the plasma temperature can be estimated to be in the range between 7.3 eV and 9.5 eV. Typically when τ CQ/S ≦ 10 ms/m2, the Te is estimated to be below 20 eV.
Except for the average quench rate discussed above, the fastest instantaneous quench rate is also very important to access the maximum eddy current. Normally a linear quench rate illustrates a global toroidal current decay, dIp/dtmax seems to be related to the maximum eddy current, which can be seen in Fig. 6(a), for the slower quench rate, the fastest instantaneous quench rate is usually several times larger than the linear quench rate. It indicates that even in the slow quench case, the maximum eddy current can be very high. However, in the higher quench rates (such as QR(80– 30) that exceeds 100 MA/s), there is little difference between dIp/dtmax and QR(80– 30), in other words as for the faster quench rate disruptive case, using the linear fit definition and the maximum current decay definition are both reliable.
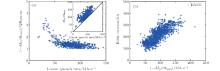
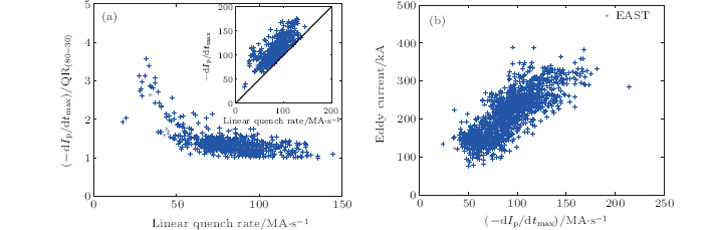 | Fig. 6. (a) Ratio of dIp/dtmax to the linear quench rate against the linear quench rate, with the inset showing the dIp/dtmax versus the linear quench rate and (b) eddy current versus – dIp/dtmax. |
Figure 6(b) shows the plot of the eddy current versus dIp/dtmax, it is clearly seen that the eddy current is consistent with dIp/dtmax, even a lower quench rate can drive a 100-kA eddy current, as the up divertor and the down divertor of EAST are fixed to in-vessel by stainless steel supports on two sides, and a fraction of eddy current flows along the plate through the supports.
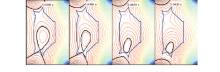
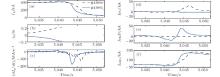
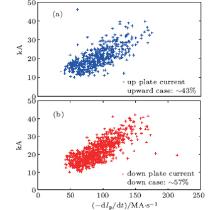
In this EAST campaign (2012), the plasma volume usually moves toward the outer-plate and then is disrupted. This can be seen from the reconstruction of the plasma boundary in Fig. 7, which is reconstructed by using the filament code. In the VDE period when plasma keeps on shrinking and finally touches the outer-plate, then a fraction of the halo current and eddy current are driven in the plate and finally measured by Rogowski coils, [19] which can be seen in Fig. 8. Discharge #43884 is one of the plasma up-going cases, when plasma moves upward, and a fraction of current is measured in the upper plate (seen in Fig. 8(d)), but little current can be seen in the down plate (seen in Fig. 8(e)). The same as the down-going case (#43864), when plasma moves downward, a large current is seen in the down plate. Figure 9 shows the distributions of plate current in the upward case (Fig. 9(a)) and downward case (Fig. 9(b)) respectively. They both increase with – dIp/dt increasing and the maximum plate currents exceed 40 kA. As the plate is designed to be up-down symmetric, eddy currents driven on up and down plates are almost equal. The maximum force density produced by the eddy current is 100 MPa∼ 200 MPa, so it is very important to design the in-vessel supports.
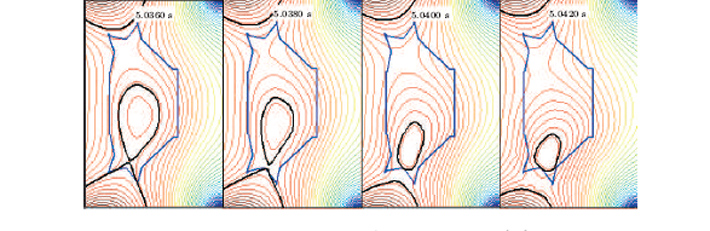 | Fig. 7. Evolutions of magnetic flux reconstructions for discharge #43864. |
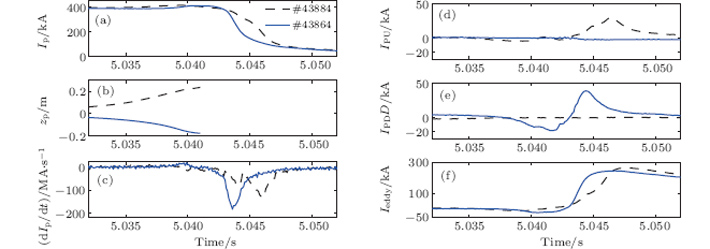 | Fig. 8. Waveforms of (a) Ip, (b) the plasma vertical positions, (c) dIp/dt traces, (d) current driven in the upper plate, (e) current driven in the lower plate, and (f) eddy current collected by the out-vessel Rogowski coil for the plasma up-going case (shot #43884, dotted lines) and the plasma down-going case (shot #43864, solid lines). |
 | Fig. 9. Values of current driven on up and down out plates against dIp/dtmax. |
In this paper, the characterization of plasma current quenching during disruption in the EAST tokamak is presented. A disruption database is successfully created, nearly 27% discharges are disrupted, and the disruptive rate increases with the augment of plasma current. Therefore, the analysis of disruption is an unavoidable problem for device safety.
This database preserves a physical basis for upgrading the device in the future. Based on the disruption database, waveforms of plasma current can be better fit by using QR(80– 30) of maximum plasma current, this unique fitting is a good fitting for the cases of a quick current quench period and a slow period. With this linear fitting, the limit boundary of τ CQ/S is 3.2 ms, the area-normalized quench time is 3.33 ms/m2 with a cross-sectional area ∼ 0.96 m2 and plasma electron temperature is estimated to be 7.3 eV ∼ 9.5 eV.
Besides, the highest eddy current driven in the in-vessel reaches 400 kA, with – dIp/dt ∼ 170 MA/s. As the plasma volume always drifts toward going out of the plate, a fraction of current is easily driven in the plate, and then flows toroidally through supports. The maximum force density produced by the eddy current goes up to 100 PMa ∼ 200 MPa, so disruption forecasting[20] and mitigation[21] should be implemented in EAST experiments.
| 1 |
|
| 2 |
|
| 3 |
|
| 4 |
|
| 5 |
|
| 6 |
|
| 7 |
|
| 8 |
|
| 9 |
|
| 10 |
|
| 11 |
|
| 12 |
|
| 13 |
|
| 14 |
|
| 15 |
|
| 16 |
|
| 17 |
|
| 18 |
|
| 19 |
|
| 20 |
|
| 21 |
|