Huang Zhi-Hui†, Yan Long-Wen, Tomita Yukihiro, Feng Zhen, Cheng Jun, Hong Wen-Yu, Pan Yu-Dong, Yang Qing-Wei, Duan Xu-Ru, HL-2A Team. Experimental and modeling researches of dust particles in the HL-2A tokamak* . Chinese Physics B, 2014, 24(2): 025204
Permissions
Experimental and modeling researches of dust particles in the HL-2A tokamak*
Huang Zhi-Hui†, Yan Long-Wen, Tomita Yukihiro, Feng Zhen, Cheng Jun, Hong Wen-Yu, Pan Yu-Dong, Yang Qing-Wei, Duan Xu-Ru, HL-2A Team
Southwestern Institute of Physics, P.O. Box 432, Chengdu 610041, China
Project supported by the National Magnetic Confinement Fusion Science Program of China (Grant Nos. 2014GB107000 and 2013GB112008), the National Natural Science Foundation of China (Grant Nos. 11320101005, 11175060, 11375054, and 11075046), and the China–Korean Joint Foundation (Grant No. 2012DFG02230).
Abstract
The investigation of dust particle characteristics in fusion devices has become more and more imperative. In the HL-2A tokamak, the morphologies and compositions of dust particles are analyzed by using scanning electron microscopy (SEM) and energy dispersive x-ray spectroscopy (EDX) with mapping. The results indicate that the sizes of dust particles are in a range from 1 μm to 1 mm. Surprisingly, stainless steel spheres with a diameter of 2.5 μm–30 μm are obtained. The production mechanisms of dust particles include flaking, disintegration, agglomeration, and arcing. In addition, dynamic characteristics of the flaking dust particles are observed by a CMOS fast framing camera and simulated by a computer program. Both of the results display that the ion friction force is dominant in the toroidal direction, while the centrifugal force is crucial in the radial direction. Therefore, the visible dust particles are accelerated toriodally by the ion friction force and migrated radially by the centrifugal force. The averaged velocity of the grain is on the order of ∼ 100 m/s. These results provide an additional supplement for one of critical plasma-wall interaction (PWI) issues in the framework of the International Thermonuclear Experimental Reactor (ITER) programme.
Keyword:
52.40.Hf; 52.70.Kz; 52.55.Fa; dust particles; dust particle characteristics; fast framing camera
Dust particles in magnetically confined fusion devices are mainly produced by the energetic plasma-wall interaction (PWI).[1] Although dust grains do not cause major problems nowadays, they are considered to be a serious issue in future fusion devices, such as ITER, where the longer pulse duration and higher plasma stored energy will produce a large quantity of dust particles, resulting in the deterioration of operational performance, damage of optical diagnostics or even safety issues of the machine due to chemical activities, radioactivities, and explosive risks.
The characteristics of dust particles, such as the sizes, mass, chemical ingredients, and structures, are key factors when taking account of their influences on safety and plasma performance. The property and quantity of the grains depend on their pre-history, i.e., the length of operation time starting from its last cleaning, type of discharge, operational duration, etc. The postmortem on the analysis of dust samples, which are collected from various locations of plasma-facing components (PFCs), can provide characteristic information about the dust particles, including their size distribution, mass amount, chemical composition, morphology, etc. Therefore, dust collection during a vent event is executed as a standard procedure in many fusion devices, such as DIII-D, [2] JET, [3] TEXTOR, [4] Tore Supra, [5] ASDEX Upgrade, [6] and HL-2A.[7] The analysis results indicate that the dust particles cover a range of particle dimensions from a few nanometers to millimetres, and they are generally deposited at the locations without direct plasma contact. Moreover, the size distribution of the dust particles presents a power-law distribution, consistent with the assessment by the laser scattering technique in the plasma volume.[8] Mass values estimated by dust collection are 31 g, 16.2 g, and 90 g– 120 g in Tore Supra, LHD, and DIII-D, respectively. Composition of dust particles is composed usually of a mixed material, being relevant to exposed PFCs and the method of wall conditioning. Dust morphology consists of an irregular shape and a regular structure, the latter includes stratified, granular, spherical structures, etc. Meanwhile, morphological characteristics are directly associated with the generation mechanism of dust particles, which involves the growth of reactive species in edge plasma, nucleation of vaporized materials, blistering, disintegration of co-deposited layers, arcing, explosive ejection, and brittle destruction of surface imperfections. Nevertheless, the findings of the postmortem on the analysis are quite limited, and the generation mechanism of dust particles and the dust conversion ratio, Cd = (dust production)/(gross material erosion), are still poorly understood.
At present, an effective method to investigate the dust particle dynamics in fusion plasmas includes dynamic modelling and experimental observation with fast framing cameras. Camera images can provide very valuable information about dust dynamics, which is able to track the trajectory of individual dust particle, to estimate the averaged speed and to count the number of dust events during plasma operation, etc. Camera observation is carried out as a routine procedure in many fusion devices. The experimental results show that the dust particles move preferentially in toroidal direction (along with the current direction) with an average speed up to a few hundred meters per second, and the grains at inner and outer divertor legs often migrate in opposite toroidal directions. Moreover, dust observation with two (or more) cameras allows us to reconstruct three-dimensional (3D) trajectory, [9] which also helps us to benchmark theoretical models, as described in DUSTT code.[10]
The aim of this paper is to present experimental and modeling results of dust particle dynamics. The remaining parts are organized as follows. The experimental setup is described in Section 2. The experimental results are elucidated in Section 3. In Section 4 the dynamic simulation of a flaking dust particle is carried out. The last section is devoted to discussion and conclusion.
2. Experimental setup
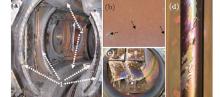
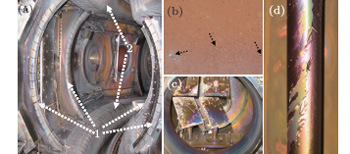
Experimental investigation of dust particles has been carried out in the HL-2A tokamak, [11] which has a major radius R = 1.65 m and minor radius a = 0.4 m. The vacuum vessel with a plasma faced area of 46 m2 is made of stainless steel AISI 304L. Figure 1(a) shows in-vessel components of HL-2A, which are numbered as No. 1– 2. The inner and outer poloidal limiters marked with No. 1 are protected by graphite tiles. The upper and lower divertors are numbered as No. 2, the baffle plate is protected by a carbon fiber composite (CFC), and the target plate is made of copper. Other PFCs are the floor of HL-2A shown in Fig. 1(b), mirrors of ECRH are displayed in Fig. 1(c) and an electrode of the glow discharge is exhibited in Fig. 1(d).
Fig. 1. (a) In-vessel components of HL-2A, PFCs viewed in the toroidal direction are indicated as No. 1: inner and outer poloidal limiters, and No. 2: lower and upper divertors; (b) the floor of the machine; (c) mirrors of ECRH; (d) an electrode of glow discharge.
Dust particles are collected in HL-2A by carbon adhesive tapes and filtered vacuum cleaning, and the facilities of filtered vacuum cleaning consist of a filter header, a plastic tube and a mechanical pump. The filter header is composed of a Sartoius polypropylene housing and a piece of Whatman Nuclepore membrane that has a diameter of 47 mm and a pore size of 0.1 μ m. This filter header is connected to the vacuum pump via a 5-m-long plastic tube. After two consecutive experimental campaigns, groups of twenty dust particle samples are collected from the deposition zones of HL-2A shown in Fig. 1, including eight samples from the floor of the machine, one sample from a mirror of ECRH, four from poloidal limiters, and two from the reflected mirror of the laser interferometer, two from the dome of the divertor, and four from the electrode of the glow discharge. Morphology and composition analyses of these dust particle samples are characterized by a scanning electron microscopy (SEM) and an energy dispersive x-ray spectroscopy (EDX) with mapping.
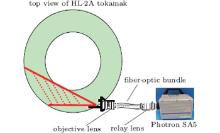
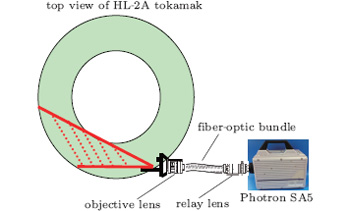
One of the earliest observations of dust particles via the emitted visible light was carried out by Goodall in the DITE tokamak.[12] A fast framing camera system as shown in Fig. 2 is installed in the HL-2A, and this figure displays the top view of the HL-2A and the sketch of this camera system. The components of this system are composed of a Nikon objective lens, the SCHOTT wound fibre bundle IG 163, the relay lens IG 1650, and the Photron fastcam SA5. The coherent, flexible fibre optic bundle IG 163 is 2.74-m long with a format size of 8 mm× 10 mm and an element size of 10 μ m. The camera SA5 is capable of taking 7500 frames per second (fps) with a mega pixel resolution and one million frames per second at a reduced resolution operation. Moreover, this system is located at a mid-plane window along the tangential direction. The objective lens focuses the light onto the front face of the bundle, then the light coming out of the back of the fiber-optic bundle passes through the relay lens and finally is focused onto the camera detector. The spatial resolution of this system is calibrated as ∼ 1.5 mm/pixel, while a target is mounted at 1.2 m away from the objective lens. The camera during dust observation typically performs 512× 512 pixels at a frame rate of 1.0× 10⁴ fps– 2.5× 10⁴ fps.
Fig. 2. Top view of HL-2A tokamak and the sketch of a fast framing camera system, including an objective lens, SCHOTT wound fiber bundles, a relay lens and a Photron SA5.
3. Experimental results
3.1. Microscopic characterization of dust particles
3.1.1. Flaking of redeposited layer
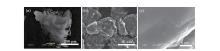
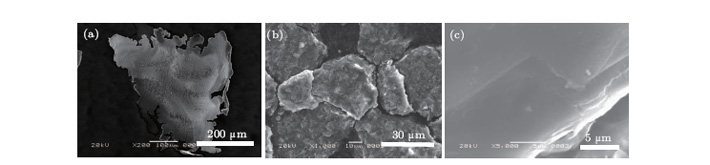
As particles and heat fluxes deposit on the PFCs, the surface layers of PFCs in HL-2A are eroded due to physical sputtering, chemical erosion, evaporation at high temperature, etc., resulting in the gross erosion of the surfaces. Then eroded species are followed by the short-range or long-range migration, the re-deposition of hydrogenated carbonaceous species (CHyDz), and the formation of the co-deposited layers in the areas without direct plasma contact. The thickness of a net redeposited layer depends on the balance between re-deposition and re-erosion by the hydrogen and oxygen impurity fluxes. Such layers often have a stratified structure, and the thickness of the flakes gradually increases during cycles of plasma operation. These flakes are generally brittle and weakly adherent to the underlying surface. They can easily flake and peel-off from the substrate if a critical thickness is reached. This implies that the redeposited layer disintegrates into small pieces due to internal mechanical and thermal stresses. The dust flakes shown in Fig. 3(a) are collected from the bottom of the ECRH port. This film has an irregular shape, and its composition is mainly carbon, but small quantities of silicon and oxygen are also found. Moreover, thicker deposited layers can be formed for a longer duration. Figure 3(b) displays a carbon-rich layer with a deep thickness, and this layer even cracks due to internal stresses. The image in Fig. 3(c) shows the structure of flakes removed from the deposition zone. One can see that the deposit has basically a layered structure. This indicates that the film grew layer-by-layer during consecutive discharges. It is also seen that the deposit is composed of flakes which easily split and separate. This is a disintegration process of the layers. It is noted that the detachment and splitting of the flakes occur especially when the tile limiter is taken from the machine and exposed to air. The flake is frequently observed in many fusion devices, such as the TEXTOR tokamak.[13]
Fig. 3. Morphological analyses of dust particles. (a) Dust particles flaked from re-deposited films; (b) dust cracking from re-deposited layers; (c) stratified structures due to the re-deposited process.
Films deposited from a low-energy flux scenario suffer less stresses, so they may reach a deeper thickness before falling. The film would crack and disintegrate into smaller pieces if its thickness exceeds a critical value. This type of co-deposit usually has a bigger mass and an irregular structure. Figures 4(a)– 4(c) display three pieces of deposit collected from the floor of HL-2A. Figure 4(a) indicates that this co-deposit with the shape of a jade scepter is 400-μ m long and 50-μ m wide. The main chemical component is carbon, but small quantities of silicon, boron, and iron are also analyzed. A silicon-rich stick has a size of 200 μ m× 100 μ m as displayed in Fig. 4(b). It is clearly seen that the upper surface of this block exhibits fiber grooves, implying that this particle originates from the baffle plate of CFC tiles. The deep thickness of the silicon stick is because the siliconization is performed as a primary method of wall conditioning. Figure 4(c) shows that a dust block is 200-μ m long and 100-μ m wide. This kind of dust particle plausibly disintegrates and releases from a redeposited coating on PFCs.
Fig. 4. Disintegration of thick re-deposits with irregular structures, (a) the shape of a jade scepter with a length of 400 μ m and a width of 50 μ m; (b) a dust stick with a length of ∼ 400 μ m; (c) a dust block with a size of ∼ 200 μ m × 100 μ m.
3.1.2. Agglomeration from supersaturated vapor
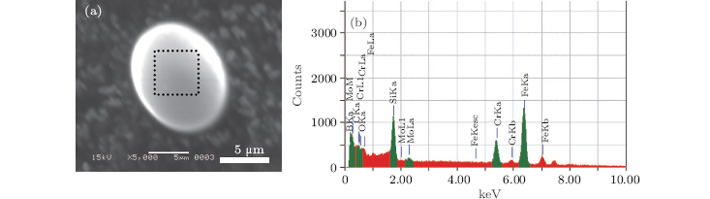
As experimental evidence in other fusion devices, [14] agglomeration from supersaturated vapor often takes place in a particular plasma region. The agglomeration can occur when the carbon density exceeds 1%, deuterium plasma temperature and density are ∼ 10 eV and ∼ 1012 cm-3− 1013 cm− 3, respectively, and this process is maintained in enough duration. Dust agglomeration is often round but has a very complex interior structure. The poloidal limiters in HL-2A are directly exposed or closer to plasmas during discharges, strong plasma-surfacing interaction produces a number of eroded atoms or molecules by evaporation and sublimations, so this process provides enough impurity density for dust agglomeration. Figures 5(a) and 5(b) show an SEM image of dust agglomeration from supersaturated vapor and its EDX spectrum, respectively. The weight percentage of each element is Fe 38.2%, B 29.3%, C 18.1%, Cr 9.3%, Si 3.6%, Mo 1.0%, and O 0.5%.
Fig. 5. An SEM image of dust agglomeration from supersaturated vapor (a) and its EDX spectrum (b). The weight percentage of each element is Fe 38.2%, B 29.3%, C 18.1%, Cr 9.3%, Si 3.6%, Mo 1.0%, O 0.5%, respectively.
3.1.3. Stainless steel spheres
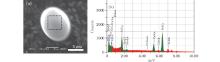
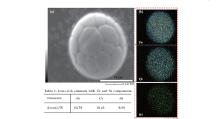
What is surprising to us is that we observe a certain number of metallic spheres in the HL-2A tokamak, which are found at the floor of the machine and the bottom of the ECRH port. The diameters of the spheres are in the range 2.5 μ m– 30 μ m. The SEM image and EDX mapping for one of the metallic spheres are shown in Figs. 6(a) and 6(b), respectively. We can clearly see a texture on its surface, and the texture is evidence for a domain structure with different phases.
Fig. 6. The SEM image (a) and EDX mapping (b) of a stainless steel sphere. The size of the sphere is approximately 15 μ m. The sphere has iron-rich components as shown in Table 1, which are in good consistence with those of the stainless steel AISI 304L (Cr: 18%– 20%, Ni: 8%– 12%).
It has a size of about 15 μ m and iron-rich elements with some Cr and Ni components as shown in Table 1, which are in good consistence with those of stainless steel AISI 304L (Cr: 18%– 20%, Ni: 8%– 12%). The formation mechanism of almost perfect spheres is not very clear yet. When the metallic materials of PFCs are evaporated initially by transient events, such as arcing, edge localized mode (ELM), [15, 16] vertical displacement event (VDE), and even disruption, the eroded material forms an oversaturated vapor phase adjacent to its origin and coagulates into a metal sphere. Another probability is that the surface mobility of the metal atoms on the graphite limiter surface increases when the limiter obtains the heat power from the thermal load of the plasma, the metal atoms coagulate and form small spheres. They are released from the limiter by plasma– surface interactions and fall onto the floor. The formation mechanism finally refers to arcing, which may cause the erosion of metallic PFCs and produce droplets. Arcing frequently occurs during the phases of the plasma startup and disruptions. As direct evidence, the first wall of the HL-2A tokamak has been damaged by the synergetic effects of runaway electrons and disruption induced by a vertical displacement event (VDE) and arcing.[17]
The postmortem of the analysis of dust particle samples reveals that the sizes are in a range from 1 μ m to 1 mm, the majority of dust particles are located at the floor of the machine, and their compositions are mainly carbon, with small quantities of other elements, e.g., Si, B, Fe, Ni, Cr, and O, which are also observed. Morphologies of dust grains are irregular, stratified, granular structures, and metallic spherical shapes. The production mechanisms of dust particles include agglomeration, flaking, disintegration, etc, among which flaking is dominant.
3.1.4. Dust observations with fast-frame camera
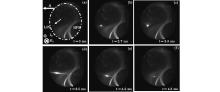
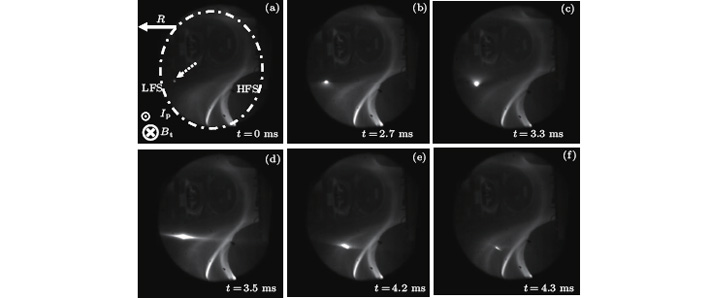
In fact, dust generation rates during normal operation are small. The images in Figs. 7(a)– 7(f) display the temporal sequence for illustrating the behaviors of a dust particle during a steady state discharge. The plasma parameters of shot 19379 are magnetic field Bt = 1.4 T, plasma current Ip = 200 kA, and line-averaged density ne = 2.0 × 10¹⁹ m− 3. The dust particle is recorded on 43 consecutive images at a frame rate of 1 × 10⁴ fps without any filter, but only six images have been selected in this paper. Figure 7(a) shows the visible dust particle originating from the first wall at the low field side (LFS). The formation process of the dust particle is to flake from the first wall with a certain initial velocity due to poor thermal adherence. The ejected grain is instantly heated up to a few thousands of Kelvin while the dust particle is directly exposed to plasma, so the thermal radiation from the grain and the line emission from the ablation cloud lead to dust visibility. Figures 7(b)– 7(e) display that the visible ablation cloud migrates along the current direction, which is parallel to the direction of ion flow, indicating that the ion drag force serves as a dominant force in the toroidal direction. Meanwhile, the grain presents a clear movement toward the plasma boundary. This process suggests that the dust is subjected to radial forces while it moves toroidally. This radial force primarily stems from the centrifugal force. The ablation cloud disappears finally as exhibited in Fig. 7(f). The observed track duration is 4.3 ms, the travelling distance is estimated to be 0.5 m, so the averaged speed of this particle is approximately ∼ 116 m/s.
Fig. 7. Temporal sequence observed by a fast-frame camera to show the dynamic behavior of a dust particle. Panels (a)– (f) display six representative images recorded at six different time slices (0– 4.3 ms). At first, the ejected dust grain becomes visible at the low field side due to thermal and line radiation (a). Then it is accelerated and migrated along the current direction, i.e., parallel to the direction of ion drift flow ((b)– (e)). The grain vanishes eventually (f).
4. Dynamic simulation of the flaking dust particle
Based on the above experimental results, the trajectory and averaged velocity of the dust particle are simulated. We mainly consider spherical carbon dust particle with radius Rd = 0.1 mm, which originally flakes from the first wall of the HL-2A tokamak with only radial velocity Vd, R ∼ 20 m/s. Since the dust particle charging time is much faster (∼ 10− 9 s) than its dynamic time (∼ 10− 3 s), the equilibrium negatively charged dust particle is used.[18] Moreover, the background plasma and equilibrium configuration parameters in the SOL/divertor region are provided by the B2-EIRENE code, [20] and the parameter profiles of core plasma fit the experimental data. The dynamics of the dust particle in the plasma is governed by a set of coupled differential equations for the evolutions of the radius r and υ velocity. These equations of motion are presented as follows:
where the total force Fd includes the ion friction force Fifr, centrifugal force , Lorentz force FLz = qVd × B, gravity Fg = mdg, and Coriolis force Fco.
Here, the electrostatic force is negligibly small because of the weak electric field in the charge– neutral plasma. The ion friction force can be further divided into the force due to ion absorption, Fiab, and the force due to Coulomb scattering of plasma ions, Fisc. According to the orbit motion limited (OML) theory, [19] both are expressed as follows:
The quantities ni, Ti, and Te are the ion density, ion temperature, and electron temperature, respectively. The parameters η iab and η isc are the coefficients of the Fiab and Fisc, respectively, each of which is a function of the plasma temperature ratio Ti/Te and the normalized relative speed of the dust particle (u = | Vi − υ d| /υ th, i), where Vi, Vd, Vth, i are the ion flow velocity, the dust particle velocity, and the ion thermal speed, respectively.
here, χ i(u, Ti/Te) ≡ ZiZde2/4π ɛ 0RdTi, and Zi is the charge state of ions, and Zd is the charge state of the dust particle.
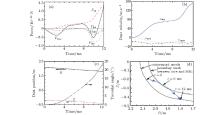
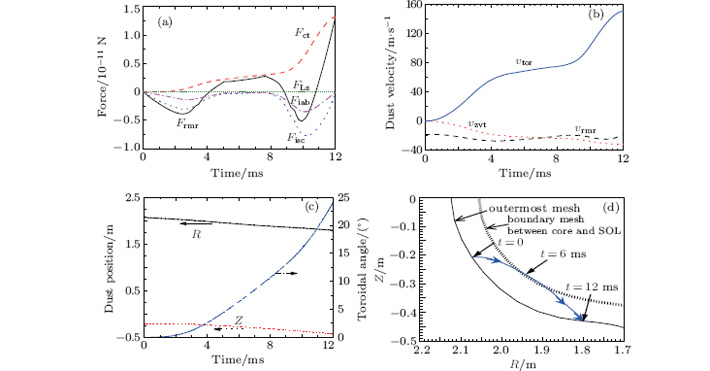
Figure 8 shows the simulation results of the dust particle dynamics originating from the first wall. The radial component of the forces acting on the dust particle is shown in Fig. 8(a), where Fct, Fisc, Fiab, FLz, and Frmr are the centrifugal force, ion scattering force, ion absorption force, Lorentz force, and total force, respectively. The results show that the ion friction force is dominant, and the centrifugal force is crucial, too. The dust particle velocities along the major radius, the vertical and toroidal directions are denoted as υ rmr, υ zvt, and υ tor, respectively; their time evolutions are shown in Fig. 8(b). The change of the toriodal velocity is remarkable and its averaged velocity is on the order of ∼ 100 m/s. The simulation results reveal that the ion friction force dominates along the toroidal direction, but the centrifugal force is crucial in the radial direction. Shown in Figs. 8(c) and 8(d) are the time evolution of dust particle position and the projection of the dust particle track on the R– Z plane, respectively, indicating that the dust particle generated from the first wall of the LFS first moves inward due to the initial kinetic energy, and then it is accelerated toroidally due to the ion friction force during the movement. The dust particle arrives at the plasma boundary at t = 6 ms and then moves outward due to the centrifugal force. Finally it is re-deposited on the first wall at t = 12 ms. The duration of the dust particle given by the computer model is longer than by camera observation (∼ 4.3 ms). The main reason is that the dust particle at its early acceleration phase cannot be observed by the fast camera due to the existing visibility threshold.[21] However, the trajectory and averaged velocity of the dust particle are in good agreement with the observation results in Fig. 7.
Fig. 8. Dynamics process of the flake dust particle originating from the first wall of the LFS on HL-2A. (a) The radial components of the forces acting on the dust particle; (b) the time evolutions of dust particle velocities, (c) dust particle positions in the three directions, and (d) the projection of the dust particle track on the R– Z plane, respectively.
5. Conclusion and discussion
Morphologies and compositions of dust particles are analyzed with SEM and EDX methods in the HL-2A tokamak. The results indicate that the sizes of dust particles are in the range from 1 μ m to 1 mm. The dust particles mainly consist of a carbon element, and small quantities of other elements, such as Si, B, Fe, Ni, Cr, and O. Morphologies of dust particles include irregular, stratified, granular structure, and metallic spherical shape, which reveals that the production mechanism of the dust particles is flaking, disintegration, and agglomeration. What is surprising to us is that stainless steel spheres with diameters in the range of 2.5 μ m– 30 μ m are observed. The formation mechanism is probably arcing, and similar results with tungsten-dominated spheroids and molten metal droplets were also obtained in ASDEX upgrade.[22] In order to identify the production mechanism of the spherical metallic dust particle, further analysis using new methods is necessary in future.
Visible dust particles are also observed by a fast framing camera system. The results manifest that dust particles are generally confined well in a steady state discharge. The grains are accelerated toriodally by the ion friction force and migrated radially by the centrifugal force. The average speed of the dust particle is on the order of ∼ 100 m/s. The trajectory and average velocity of the carbon dust particle are simulated by a computer program, and the obtained results are in reasonable agreement with the results by the camera observation. However, the effect of dust ablation during dust transport on plasma performance is quite important, which is left as one of the future research subjects.
Acknowledgment
The authors express sincere gratitude to Prof. Y. H. Xu for his valuable support and helpful discussions, and they also wish to thank Dr. N. Ashikawa at NIFS for her useful suggestions and assistance during dust particle analysis and observations.
PanY D and SchneiderR2007J. Nucl. Mater. 363–365407[Cited within:1][JCR: 1.211]
21
SmirnovR D, PigarovA Yu, RosenbergM, KrasheninnikovS I and MendisD A2009Plasma Phys. Control Fusion51055017DOI:10.1088/0741-3335/51/5/055017[Cited within:1][JCR: 2.369]
... [1] Although dust grains do not cause major problems nowadays, they are considered to be a serious issue in future fusion devices, such as ITER, where the longer pulse duration and higher plasma stored energy will produce a large quantity of dust particles, resulting in the deterioration of operational performance, damage of optical diagnostics or even safety issues of the machine due to chemical activities, radioactivities, and explosive risks ...
1
2013
1.211
0.0
... Therefore, dust collection during a vent event is executed as a standard procedure in many fusion devices, such as DIII-D,[2] JET,[3] TEXTOR,[4] Tore Supra,[5] ASDEX Upgrade,[6] and HL-2A ...
1
2013
1.211
0.0
... Therefore, dust collection during a vent event is executed as a standard procedure in many fusion devices, such as DIII-D,[2] JET,[3] TEXTOR,[4] Tore Supra,[5] ASDEX Upgrade,[6] and HL-2A ...
1
2013
1.211
0.0
... Therefore, dust collection during a vent event is executed as a standard procedure in many fusion devices, such as DIII-D,[2] JET,[3] TEXTOR,[4] Tore Supra,[5] ASDEX Upgrade,[6] and HL-2A ...
1
2001
1.211
0.0
... Therefore, dust collection during a vent event is executed as a standard procedure in many fusion devices, such as DIII-D,[2] JET,[3] TEXTOR,[4] Tore Supra,[5] ASDEX Upgrade,[6] and HL-2A ...
1
1999
0.0
0.0
... Therefore, dust collection during a vent event is executed as a standard procedure in many fusion devices, such as DIII-D,[2] JET,[3] TEXTOR,[4] Tore Supra,[5] ASDEX Upgrade,[6] and HL-2A ...
1
2011
0.0
0.3421
... [7] The analysis results indicate that the dust particles cover a range of particle dimensions from a few nanometers to millimetres, and they are generally deposited at the locations without direct plasma contact ...
1
2006
2.369
0.0
... [8] Mass values estimated by dust collection are 31#cod#x00A0 ...
1
2009
2.369
0.0
... Moreover, dust observation with two (or more) cameras allows us to reconstruct three-dimensional (3D) trajectory,[9] which also helps us to benchmark theoretical models, as described in DUSTT code ...
1
2007
2.369
0.0
... [10] ...
1
2011
2.734
0.0
... Experimental setupExperimental investigation of dust particles has been carried out in the HL-2A tokamak,[11] which has a major radius R #cod#x003D ...
1
1982
1.211
0.0
... [12] A fast framing camera system as shown in Fig ...
1
2003
0.0
0.0
... [13] ...
1
2000
2.376
0.0
... Agglomeration from supersaturated vaporAs experimental evidence in other fusion devices,[14] agglomeration from supersaturated vapor often takes place in a particular plasma region ...
1
2011
1.148
1.2429
... When the metallic materials of PFCs are evaporated initially by transient events, such as arcing, edge localized mode (ELM),[15,16] vertical displacement event (VDE), and even disruption, the eroded material forms an oversaturated vapor phase adjacent to its origin and coagulates into a metal sphere ...
Effects of an ultra-strong magnetic field on electron capture rates for Co-55 are analyzed in the nuclear shell model and under the Landau energy levels quantized approximation in the ultra-strong magnetic field, and the electron capture rates on 10 abundant iron group nuclei at the surface of a magnetar are given. The results show that electron capture rates on Co-55 are increased greatly in the ultra-strong magnetic field, by about 3 orders of magnitude generally. These conclusions play an important role in future study of the evolution of magnetars.
Du Jun 1 ;Li Ping-Ping 1 ;Luo Xia 1,2 ;
Effects of ultra-strong magnetic field on electron capture rates for 55 Co are analyzed in the nuclear shell model and under the Landau energy levels quantized approximation in the ultra-strong magnetic field, and the electron capture rates on 10 abundant iron group nuclei at the surface of magnetar are given. The results show that electron capture rates on 55 Co are increased greatly in the ultra-strong magnetic field, by about 3 orders of magnitude generally. These conclusions play an important role in future studying the evolution of magnetar.
... When the metallic materials of PFCs are evaporated initially by transient events, such as arcing, edge localized mode (ELM),[15,16] vertical displacement event (VDE), and even disruption, the eroded material forms an oversaturated vapor phase adjacent to its origin and coagulates into a metal sphere ...
The plasma facing component in HL-2A has been damaged seriously after disruption, and for this reason its operation is suspended for maintenance. The experimental phenomena and plasma configurations, calculated by the current filament code (CF-code) using the plasma parameters measured by diagnostics and the signals of the magnetic probes, confirm that the first wall is damaged by the synergetic effects of runaway electrons and disruption induced by a vertical displacement event (VDE). When the plasma column is displaced upward/downward, the strong runaway electrons normally hit the baffle plate of the MP3 or MP1 coil in the upper and lower divertor during the disruption, causing the baffle plates to be holed and wrinkled by the energetic runaway current, and water (for cooling or heating the baffle plates) to leak into the vacuum vessel. Another disastrous consequence is that bellows underlying the baffle plate and outside the coil of MP3 for connecting two segments of the jacket casing pipe are punctured by arcing. The arc may be part of the halo current that forms a complete circuit. The experimental phenomena are indirect but compelling evidence for the existence of a halo current during the disruption and VDE, though the halo current has not been measured by the diagnostics in the HL-2A tokamak.
The plasma facing component in HL-2A has been damaged seriously after disruption, and for this reason its operation is suspended for maintenance. The experimental phenomena and plasma configurations, calculated by the current filament code (CF-code) using the plasma parameters measured by diagnostics and the signals of the magnetic probes, confirm that the first wall is damaged by the synergetic effects of runaway electrons and disruption induced by a vertical displacement event (VDE). When the plasma column is displaced upward/downward, the strong runaway electrons normally hit the baffle plate of the MP3 or MP1 coil in the upper and lower divertor during the disruption, causing the baffle plates to be holed and wrinkled by the energetic runaway current, and water (for cooling or heating the baffle plates) to leak into the vacuum vessel. Another disastrous consequence is that bellows underlying the baffle plate and outside the coil of MP3 for connecting two segments of the jacket casing pipe are punctured by arcing. The arc may be part of the halo current that forms a complete circuit. The experimental phenomena are indirect but compelling evidence for the existence of a halo current during the disruption and VDE, though the halo current has not been measured by the diagnostics in the HL-2A tokamak.
Fundamental characteristics of charging of a dust particle and its dynamics in SOL/divertor plasma in tokamaks are studied. According to the OML (orbit motion limited) theory, the charging process is extremely faster, with a charging time of nanoseconds, than the dynamics process of the dust particle in SOL/divertor plasma, with a characteristic time of milliseconds, which means that the local charge state can be taken as the equilibrium charge state. It was clarified that the equilibrium charge Zd,eq can be determined in the form of Zd,eq / Rd Te, which is a function of both the normalized relative speed of plasma ion flow with respect to the velocity of the dust particle and the plasma temperature ratio. After the investigation of dominant forces acting on dust particles, the friction forces due to the plasma ion absorption and ion Coulomb scattering are found of the same order for the case of low relative speed. The critical radius of a dust particle, for which the gravity is larger than the friction forces due to plasma ions, is obtained.
1 National Institute for Fusion Science, 322-6 Oroshi-cho, Toki 509-5292 Japan2 Southwestern Institute of Physics, Chengdu 610041, Sichuan, China
Fundamental characteristics of charging of a dust particle and its dynamics in SOL/divertor plasma in tokamaks are studied. According to the OML (orbit motion limited) theory, the charging process is extremely faster, with a charging time of nanoseconds, than the dynamics process of the dust particle in SOL/divertor plasma, with a characteristic time of milliseconds, which means that the local charge state can be taken as the equilibrium charge state. It was clarified that the equilibrium charge Zd,eq can be determined in the form of Zd,eq / Rd Te, which is a function of both the normalized relative speed of plasma ion flow with respect to the velocity of the dust particle and the plasma temperature ratio. After the investigation of dominant forces acting on dust particles, the friction forces due to the plasma ion absorption and ion Coulomb scattering are found of the same order for the case of low relative speed. The critical radius of a dust particle, for which the gravity is larger than the friction forces due to plasma ions, is obtained.
... [18] Moreover, the background plasma and equilibrium configuration parameters in the SOL/divertor region are provided by the B2-EIRENE code,[20] and the parameter profiles of core plasma fit the experimental data ...
1
1992
0.0
0.0
... According to the orbit motion limited (OML) theory,[19] both are expressed as follows: ...
1
2007
1.211
0.0
... [18] Moreover, the background plasma and equilibrium configuration parameters in the SOL/divertor region are provided by the B2-EIRENE code,[20] and the parameter profiles of core plasma fit the experimental data ...
1
2009
2.369
0.0
... [21] However, the trajectory and averaged velocity of the dust particle are in good agreement with the observation results in Fig ...
1
2009
1.211
0.0
... [22] In order to identify the production mechanism of the spherical metallic dust particle, further analysis using new methods is necessary in future ...
Experimental and modeling researches of dust particles in the HL-2A tokamak*
[Huang Zhi-Hui†, Yan Long-Wen, Tomita Yukihiro, Feng Zhen, Cheng Jun, Hong Wen-Yu, Pan Yu-Dong, Yang Qing-Wei, Duan Xu-Ru, HL-2A Team]


 , Yan Long-Wen, Tomita Yukihiro, Feng Zhen, Cheng Jun, Hong Wen-Yu, Pan Yu-Dong, Yang Qing-Wei, Duan Xu-Ru, HL-2A Team]