
Pulse decomposition-based analysis of PAT/TAT error caused by negative lobes in limited-view conditions*
[Liu Liang-Binga), b) , Tao Chaoa)†  , Liu Xiao-Jun
a)‡ , Li Xian-Lib) , Zhang Hai-Taob) ]
, Liu Xiao-Jun, Li Xian-Li|
|


Corresponding author. E-mail: taochao@nju.edu.cn
Corresponding author. E-mail: liuxiaojun@nju.edu.cn
Project supported by the National Basic Research Program of China (Grant No. 2012CB921504), the National Natural Science Foundation of China (Grant Nos. 11274167, 11274171, 61201450, 61201495, and 61302175), and the Chongqing Science and Technology Commission of China (Grant Nos. 2012jjA40058 and 2012jjA40006).
Pulse decomposition has been proven to be efficient to analyze complicated signals and it is introduced into the photo-acoustic and thermo-acoustic tomography to eliminate reconstruction distortions caused by negative lobes. During image reconstruction, negative lobes bring errors in the estimation of acoustic pulse amplitude, which is closely related to the distribution of absorption coefficient. The negative lobe error degrades imaging quality seriously in limited-view conditions because it cannot be offset so well as in full-view conditions. Therefore, a pulse decomposition formula is provided with detailed deduction to eliminate the negative lobe error and is incorporated into the popular delay-and-sum method for better reconstructing the image without additional complicated computation. Numerical experiments show that the pulse decomposition improves the image quality obviously in the limited-view conditions, such as separating adjacent absorbers, discovering a small absorber despite disturbance from a big absorber nearby, etc.
Pulse decomposition refers to dividing a synthesized wave into a set of constituent pulses, [1– 4] and then makes a complex phenomenon understood more easily.[1, 5, 6] For example, a segment of a typical electrocardiogram (ECG) wave can be decomposed into a sum of several constituent Gaussian pulses with various amplitudes, sharpness, and time positions, which respectively represent working conditions of primary systole, kidney, and ilium, etc.[1, 5]
Pulse decomposition has been successfully used in not only ECG signal analysis, [4, 5] but also the study of gamma-ray burst time profiles, [7] image processing, [2, 3] topographic mapping by airborne lasers, [6] etc. It has proved to have practical potential to draw a clear distinction of contributions made by plenty of constituent pulses, which is also necessary in image reconstruction of photoacoustic tomography (PAT)[8– 12] and thermoacoustic tomography (TAT).[13– 16]
PAT/TAT imaging is an emerging imaging technology in biomedicine, physically combining the functional contrast of optical imaging with the high resolution of ultrasonography. In photoacoustic (PA) and thermoacoustic (TA) pulses, negative lobes are the second half of the derivative of the illumination pulse.[17] Sometimes, because of wave superposition, negative lobes of an acoustic pulse emanated from a big absorber may entirely suppress a pulse emanated from a small absorber nearby. This kind of energy neutralization in a certain propagation direction has not received much attention, because the errors in calculation of the acoustic pulse amplitude caused by it are offset by each other in full-view conditions.
However, in limited-view conditions, energy neutralization caused by negative lobes cannot be offset and then degrade the imaging quality seriously. Actually, limited-view conditions[14, 16, 18– 20] occur quite frequently because of practical constraints due to the imaging hardware, scanning geometry, or ionizing radiation exposure. Aiming at this problem, some image reconstruction techniques such as the total variation (TV) method, [16, 18– 20] involved in the compress sensing (CS) theory, are adopted successfully by minimizing TV of reconstructed images iteratively because the image intensity does not change dramatically in most PAT applications. Similarly, we adopt the idea of pulse decomposition as a signal processing tool to divide the acoustic waves into a set of acoustic pulses, and then the negative lobe errors will be eliminated fundamentally in principle.
In this paper, we will give a pulse decomposition formula for acoustic waves with its mathematical deduction, and then combine it with the DAS algorithm to reconstruct the PAT and TAT image.
Furthermore, numerical experiments in limited-view conditions are conducted to measure improvement of the new method quantitatively, such as separating a pair of adjacent circles, discovering a small circle despite disturbance from a big circle nearby, etc.
In response to energy absorption, the acoustic pressure, p(r, t), at position r, and time t in an acoustically homogeneous liquid-like medium obeys the following equation (with ignoring thermal diffusion and kinematic viscosity):

where H(r, t) is the heat energy deposited per unit time per unit volume, Cp is the specific heat, and β is the isobaric volume expansion coefficient. In general, the solution to Eq. (1) in the time domain can be described by
Obviously, the heating function is the product of a spatial absorption coefficient, A(r), and a temporal heating function, Ie(t). Thus, H(r, t) = A(r)Ie(r), and A(r) is closely related to p(r, t). As a result, there is a simplified formula of the delay-and-sum (DAS) reconstruction algorithm for PAT/TAT

where r(i) is the position of the i-th detector, t(r, i) = | r– r(i)| /c + t̃ /4, and t̃ is the pulse duration of Ie(t).
Next, the following equation shows a deep insight into p(r0, t0), a point value at time t0, recorded by a detector at position r0:
where 

where 
According to the above equations, we can find the following points: (i) (ii) Take 2D imaging for example. (iii) t(r, i) in Eq. (3) represents the time of the peak value in Ie(t) arriving at the i-th detector as shown by tj (j ∈ [1, 3]) in Fig. 1(b). Moreover, p(r(i), t(r, i)) acts as an index of the pulse amplitude, and is assumed to be approximately proportional to A(r), or indeed (iv) Ie(t) represents the heating pulse, and the second half part of dIe(t)/dt is negative, as shown by G in Fig. 1(c). Therefore, the negative lobes of acoustic pulses may bring errors in pulse amplitude estimation.


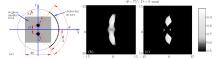
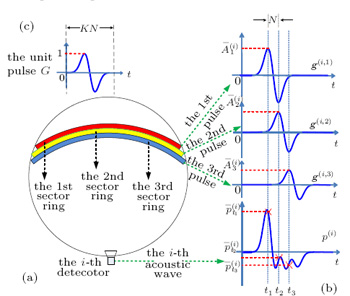 | Fig. 1. (a) All absorbers in the circular region under test are distributed into three sector rings centred at the i-th detector. (b) Absorbers in the j-th sector ring each emanate an acoustic pulse g(i, j), and tj is the peak time of g(i, j), p(i) is the i-th acoustic wave recorded by the i-th detector, and indeed  |
To demonstrate errors in pulse amplitude estimation caused by negative lobes, the measurement geometry shown in Fig. 1 is taken for example. All absorber elements are distributed in three sector rings centred at the i-th detector. Acoustic pulses emanated from all absorbers in the j-th sector ring are completely synchronizing signals and able to be combined into a pulse, g(i, j), when the thickness of every sector ring is equal and small enough. Also, the amplitude 

However, p(i) is a synthetic wave and
For this reason, pulse decomposition is introduced to provide
The basic idea of pulse decomposition to estimate the positive peak value of an acoustic pulse,

where 
As indicated in Eq. (6), each point of p(i), in some sense, is determined by all acoustic pulses. Differences among acoustic pulses lie in the amplitude
Next, we will give out the pulse decomposition formula and its deduction, based on known N, G, and p(i). (i) Let where K = (τ p/(Nts))round is the nearest integer greater than or equal to the ratio between N and the length of the vibrating part of G, τ p is the duration of a laser pulse or an electromagnetic wave pulse, ts is the sampling interval, and the subscript “ round” means taking the round number. Substituting them into Eq. (6) gives (ii) According to the definition of K, vibration of an acoustic pulse lasts no more than (K− 1) pulses. Thus, a point value in p′ (i) is actually determined jointly by K pulses emanated from K sector rings, and equation (6) can be rewritten as where x, y, z are natural numbers. (iii) According to the order of x in which Gx appears in the sum value (iv) Let x = N(k– 1)+ n, where n ∈ [1, N]. This is because the amount of Gx in Eq. (8) is K, and x ≤ KN. (v) Let z = mN+ n, where m is an integer and m ≥ K. This is because y does not change when z increases from (mN+ 1) to (mN+ N) in Eq. (8). (vi) According to Eq. (9), we can obtain y = m+ 2– k after giving the exact form of x and z as shown above, and then where ñ is the positive peak time of G, and is helpful to improve the performance of the pulse decomposition formula when the signal-to-noise ratio (SNR) is low. (vii) According to Eqs. (6) and (7), equation (10) can be rewritten as where j = m+ 1– K, and 


Equation (11) is the formula for dividing an acoustic wave, p(i), into a set of acoustic pulses, g(i, j), and then obtaining the pulse amplitude 
After dividing an acoustic wave into a set of acoustic pulses,
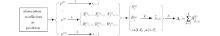
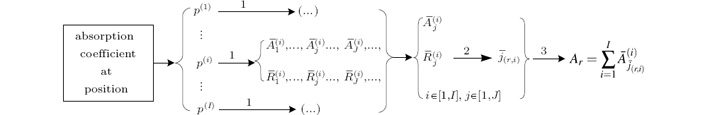 | Fig. 2. To measure the absorption coefficient at position r, the new method is composed of three main steps. Step 1: according to Eq. (8), all I acoustic waves are decomposed easily and respectively to obtain the sector ring coefficient   |
a) In step 1, according to the analysis of the i-th acoustic wave, we can obtain where b) In step 2, c) According to Eq. (3), just like the basic idea of the DAS algorithm, [21] step 3 is to calculate the summation of 


Without changing the DAS algorithm too much, the new reconstruction method can provide a better image in limited-view conditions because of the more accurate estimation of
Next, numerical experiments in two dimensions are carried out to prove the new method. A Windows Workstation with an Intel Core i7-2600 3.40 GHz processor having 16 GB memory is used in all computations carried out in this work. For comparison, the weighted DAS method[21] is employed with the computation equation as 

where J1 is the Bessel function, 
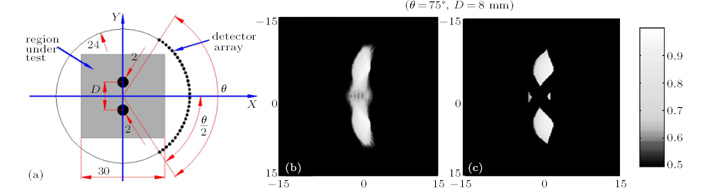
The density ρ = 1000 kg/m3, c = 1500 m/s, and the laser pulse width is 5× 10− 8 s. Detectors are placed in an arc with the center at (0, 0) mm, visual angle θ , and the radius 24 mm. The region under test is a square with the center at (0, 0) mm and 30 mm length on a side, and divided into 200 × 200 grids. So the thickness of a sector ring is 0.15 mm. By the way, the thickness should be much less than the size of absorbers, and then it can be adjusted according to the trade off between image fineness and computation cost, which means that increasing the thickness will reduce the computing time but blur the edges of absorbers in the reconstructed image.
There are two kinds of absorbers in the region under test. One kind is a pair of adjacent circles as shown in Fig. 3(a), to measure the performance of reconstruction methods of separating the adjacent absorbers. The circles center at (0, D/2) mm and (0, − D/2) mm respectively, whose radii are both 2 mm. The other kind is a pair of big-small circles as shown in Fig. 4(a), to measure the performance of the reconstruction method of discovering a small absorber with a big one nearby. The big one centers at (7, 0) mm and its radius is 5 mm. The small one centers at (− 5, 0) mm and its radius is Rsmall.
For the generation of acoustic waves, the sound field is analyzed by the integration method as shown in Eq. (5) and calculated by the differential element method[17, 24] as shown in Eq. (6) through using the COMSOL software. When θ = 75° and D = 8
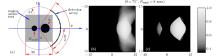
When θ = 75° and Rsmall = 5 mm, the reconstructed images of big-small circles by the DAS method and the new one are shown in Figs. 4(b) and 4(c), and the total computational time for them are 2.6632 s and 2.8511 s respectively. Limited-view conditions make the image of the small absorber almost disappear in the DAS image because of the much higher intensity of the big absorber image, which is still obvious in the image reconstructed by the new method. It shows that pulse decomposition is useful to discover acoustic waves emanated from a small absorber, which is often suppressed by negative lobes of acoustic waves that have emanated from a big absorber.
 | Fig. 3. (a) Measurement geometry for a pair of adjacent circles; the reconstructed images by (b) the weighted DAS algorithm, and (c) the new method. |
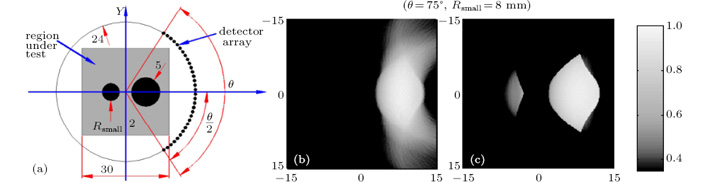 | Fig. 4. (a) Measurement geometry for a pair of big-small circles; the reconstructed images by (b) the weighted DAS algorithm, and (c) the new method. |
Next, parametrical experiments are conducted to statistically test the performance of the new method, by sweeping θ of 30° , 35° , 40° , 45° , 50° , 55° , 60° , 65° , and 70° , D of 1, 2, 3, 4, 5, 6, 7, 8, 9, and 10 mm, and Rsmall of 0.5, 1.0, 1.5, 2.0, 2.5, 3.0, 3.5, 4.0, 4.5, and 5.0 mm. Furthermore, a histogram intersection method[26] is adopted to measure the similarity between the true geometry image and the reconstructed images provided by the DAS and the new method respectively. The histogram intersection is defined as follows:

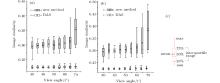
where a color histogram of image F is an L-dimensional vector, Hl(F), in which each element represents the frequency of color l in image F. Additionally, for convenience of data display, the box chart is used to describe the performance of an image reconstructed method with constant θ and varying D or Rsmall. Statistical parameters corresponding to different parts of a box chart are shown in Fig. 5(c).
We can find the following points. (I) The histogram intersection method is efficient to quantify the image similarity, which shows expected dependence on the view angle. With the increase of θ , the mean values of image similarities increase statistically, no matter whether the reconstruction method is DAS or the new one, the measurement geometry is the adjacent circles or the big-small ones. (II) For the case of the adjacent circles, the mean similarities of the DAS method and the new method vary in the ranges of [0.224 0.226] and [0.295 0.352] respectively. So the new method is about 31% – 58% higher in performance to make two adjacent absorbers separable than the DAS. (III) For the case of the big-small circles, the mean similarities of the DAS method and the new method vary in ranges of [0.224 0.228] and [0.293 0.382] respectively. So the new method is about 31% – 68% higher in performance to discover a small absorber with a big absorber nearby than the DAS.
 | Fig. 5. As an index of imaging quality of the new method (grey boxes) and DAS (empty boxes), similarities between the true geometry image and the reconstructed image, respectively, for the cases of (a) adjacent circles and (b) big-small circles with varying view angles; (c) statistical parameters included in a box chart. |
The negative lobe is introduced by the second half of the time derivative of illumination pulses, and represents the shrinkage of absorbers after heat expansion. In conditions of limit-view, it brings obvious errors in estimation of the positive peak values of acoustic pulses, and is one of the main causes of reconstruction distortions. The TV method proves to be a powerful image reconstruction tool in removing background noise, making the image more smooth and preserving edges. Similarly, the idea of pulse decomposition proves to be an effective signal processing tool in analyzing the complicated signals by dividing them into a set of simple pulses. As expected, it shows a good ability to eliminate the negative lobe error and estimate the positive peak values. In this paper, the pulse decomposition formula for PA/TA waves is provided through the detailed deduction, which then forms a new reconstruction method. Numerical experiments prove statically the advantages of the new method over the DAS method, for example, enhancing the imaging quality in conditions of limit-view by more than 30% for the cases of adjacent absorbers and big-small ones.
| 1 |
|
| 2 |
|
| 3 |
|
| 4 |
|
| 5 |
|
| 6 |
|
| 7 |
|
| 8 |
|
| 9 |
|
| 10 |
|
| 11 |
|
| 12 |
|
| 13 |
|
| 14 |
|
| 15 |
|
| 16 |
|
| 17 |
|
| 18 |
|
| 19 |
|
| 20 |
|
| 21 |
|
| 22 |
|
| 23 |
|
| 24 |
|
| 25 |
|
| 26 |
|