Zhang Chuan-Chao, Zhang Li-Juan, Liao Wei, Yan Zhong-Hua, Chen Jing, Jiang Yi-Lan, Wang Hai-Jun, Luan Xiao-Yu, Ye Ya-Yun, Zheng Wan-Guo, Yuan Xiao-Dong. ATR-FTIR spectroscopic studies on density changes of fused silica induced by localized CO2 laser treatment . Chinese Physics B, 2014, 24(2): 024220
Permissions
ATR-FTIR spectroscopic studies on density changes of fused silica induced by localized CO2 laser treatment
Zhang Chuan-Chaoa), Zhang Li-Juana), Liao Weia), Yan Zhong-Huab), Chen Jinga)†, Jiang Yi-Lana), Wang Hai-Juna), Luan Xiao-Yua), Ye Ya-Yuna)‡, Zheng Wan-Guoa), Yuan Xiao-Donga)
Research Center of Laser Fusion, China Academy of Engineering Physics, Mianyang 621900, China
School of Physical Electronics, University of Electronic Science and Technology of China, Chengdu 610054, China
The surface density changes of the central region of the sites treated by using the CO2 laser-based non-evaporative damage mitigation for fused silica are investigated by attenuated total reflectance-Fourier transform infrared spectroscopy (ATR-FTIR). The ATR-FTIR peak shifts of the treated sites of fused silica are monitored to determine the changes of the corresponding density. For the quenching treated sites, the surface density is increased by (0.24 ± 0.01)% compared with the initial density but the laser annealing by the exposure of a power ramp down after damage mitigation effectively suppresses the structural changes of treated sites, which could reduce the increase of the corresponding density to (0.08 ± 0.01)%. The results provide sufficient evidence that the laser annealing by a power ramp down after damage mitigation has a positive effect on the control of the structural change induced by CO2 laser-based damage mitigation.
Fused silica is universally used to make large aperture optics, such as windows, lenses, gratings, and debris shields, in high-power UV laser systems. One of the major concerns encountered for these high-cost fused silica optics is laser-induced surface damage under the exposure of high-fluence UV laser.[1– 6] For the high-power UV laser facilities, such as the National Ignition Facility (NIF) in USA, [7] the Laser Mega Joule in France, [8] and the SGIII laser facility in China, [9, 10] the routine operation is above the damage growth threshold of fused silica optics. Once the surface damages are initiated under the high-fluence UV laser irradiation, they will grow exponentially with subsequent laser shots, and will result in excessive light scattering and beam modulation, and they will finally lead to a shortening of the lifetime of fused silica optics.[11] Surface damage of the fused silica optics intensively restricts the maximum output fluence of the high-power UV laser facilities, and abilities to mitigate the laser damage and enhance the damage growth threshold are necessary for the routine operation of these facilities.
A variety of techniques have been developed to mitigate the growth of surface damage and the most effective technique is the CO2 laser processing technique to locally melt or evaporate the damage[12] There are two kinds of CO2 laser mitigation protocols, i.e., evaporative protocol and no-evaporative protocol.[8, 13– 16] Compared with the evaporative mitigation protocol, the non-evaporative mitigation protocol has the advantage of minimal surface perturbation or material removal and it only needs a simple system setup.[8, 15, 16] However, some problems, such as raised rims, re-deposited debris, bubbles or residual stress at the mitigated damage sites, may occur when using the non-evaporative mitigation protocol and they will lead to problematic damage re-initiation and growth, as well as downstream intensification. Extensive investigations have been conducted to solve these problems, [4, 8, 15– 24] and the non-evaporative mitigation protocol with the combination of particular powers and exposure times of CO2 laser can effectively eliminate raised rims, re-deposited debris, and bubbles at the mitigated damage sites.[8, 15– 22] In addition, high temperature oven annealing or laser annealing can effectively control the residual stress to an acceptable level.[21– 24] These modifications of the mitigated damage sites induced by intensive CO2 laser treatment are associated with the local structural changes of fused silica. However, few studies on the structural changes of fused silica treated with localized CO2 laser heating have been reported. Only recently have Matthews et al. reported their study on fused-silica microstructural changes induced by CO2 laser treatment by using Raman microscopy.[25] Considering the fact that the properties of fused silica are strongly dependent on the structure, it is important to systematically study the structural changes of fused silica for non-evaporative mitigation.
In fused silica, each silicon atom is surrounded by four tetrahedrally co-ordinated oxygen atoms, and adjacent silicon atoms are bridge-bonded through a single oxygen atom. Interatomic vibrational modes of Si– O– Si bonding strongly depend on Si– O– Si bonding angle.[26] Infrared (IR) spectroscopy has been widely used to characterize the structure of fused silica, and the correlation between the IR peak position of silica structural band and the frozen-in temperature of fused silica, i.e., fictive temperature of fused silica, has been established.[26, 27] The structure of fused silica depends on the fictive temperature, and the relationship between fictive temperature and glass density has been reported.[28] Thus, the density change of fused silica induced by localized CO2 laser treatment can be measured by the IR technique. Attenuated total reflectance-Fourier transform infrared spectroscopy (ATR-FTIR) is a powerful means for the direct surface characterization of solids. In this work, systematic investigations of the fused silica treated by the CO2 laser non-evaporative mitigation are performed by using ATR-FTIR technique. The density change of fused silica during CO2 laser treatment is estimated by the shift of the IR peak position of the silica structural band.
2 Experimental details
The fused silica samples used in this study are polished UV-grade Corning 7980 fused silica, 40-mm square by 4-mm thick. Before being treated by CO2 laser, the fused silica samples were slightly etched in a buffered hydrofluoric (HF) acid solution and then cleaned by deionized water. A commercial radio frequency power excited CO2 laser (Coherent GEM-100 L) with a maximum output power of 100 W and power stability of ± 3% was used to treat the fused silica samples. The spatial profile of the CO2 laser beam is a Gaussian distribution. A beam spot with a diameter of 3 mm, where the beam spot intensity decreases to 1/e times of its central intensity, at the sample surface was obtained by a ZnSe lens with a 200-mm focal length for the treatment of the samples. For the non-evaporative mitigation protocol, the fused silica samples were first preheated at a low laser power of 13.7 W for 30 seconds. They were next irradiated under a high power of 25.3 W for 4 seconds to heat the fused silica to above the melting point and heal the damages. Then, laser annealing by a variety of linear decreases in the CO2 laser power with lower power heating silica below the melting point from 19.7 W to 8.7 W with different exposure times was performed to minimize the structural changes of the irradiated sites on the surface of the fused silica sample.
The treated sites of fused silica were first characterized with a photoelastic tool (PTC-702) to determinate the measurement region of the irradiated sites. The ATR-FTIR spectra were measured by a Nicolet 5700 spectrometer equipped with an ATR accessory. The measurements were carried out in a range of 700 cm− 1– 1400 cm− 1, with a Ge ATR crystal, 64 scans and resolution of 1 cm− 1.
To calibrate the fictive temperature of the measurement region of fused silica, a thin fused silica slice with 10-mm square by 1-mm thick was treated by the CO2 laser with a 4-mm diameter beam spot and 26.3-W power for the sufficient length of time of about 100 seconds to establish a metastable equilibrium state at the central portion of the irradiated site, and it was then air quenched. The ATR-FTIR spectra of the central portion of the irradiated site were measured, and the corresponding FTIR transmission spectra were also measured for calibration.
3 Results and discussion
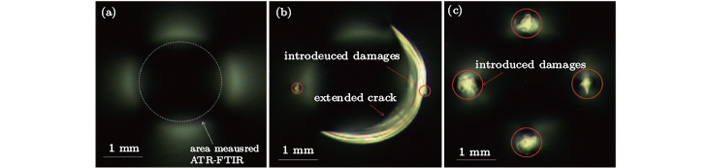
Figure 1(a) shows a typical image of a site treated with the non-evaporative mitigation protocol by a photoelastic tool (PTC-702). Generally, for a typical non-evaporative mitigation protocol, the irradiated zone of the fused silica sample intensively absorbs the energy of a CO2 laser beam, which induces a rapid temperature increase in the irradiated zone. As the fused silica in the irradiated zone is heated up to a peak temperature exceeding the glass transition temperature, the material of the damage site is melted and healed, and then a rapid thermal quench ensues following the switching-off of the CO2 laser. The melt zone of the treated site cannot completely relax the strained material over a time that is much shorter than the corresponding structural relaxation time, and a structure corresponding to a high metastable equilibrium temperature is frozen at higher density. Consequently, the melt zone is intensively plastically deformed, which will induce the change of the morphology profile of the irradiated zone and the formation of residual stress at the treated site.
Fig. 1. (a) Typical image of a treated site observed by a photoelastic tool (PTC-702), (b) a typical image of fracture extending induced by introduced small damages for the treated site, and (c) a typical image of introduced large damages for the treated site with laser annealing following the damage mitigation, no fracture extension is observed.
For a typical treated site, the distribution of the residual stress is shown in Fig. 1(a). If a small damage is introduced at the treated site, the residual stress may cause the cracks of the introduced damage to propagate away, as shown in Fig. 1(b), which leads to a catastrophic failure of the fused silica optics. Meanwhile, the laser annealing by a linear ramp down of the CO2 laser power following the damage mitigation can effectively suppress the residual stress. As shown in Fig. 1(c), large damages are introduced at the treated site and the residual stress does not cause the cracks of the introduced damages to propagate away, which suggests that the local structure of the treated site must be changed during the laser annealing.
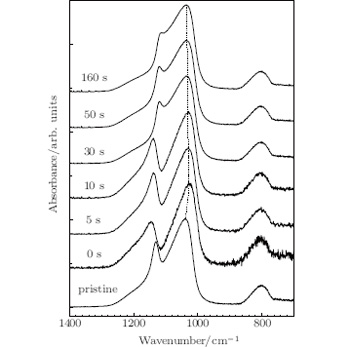
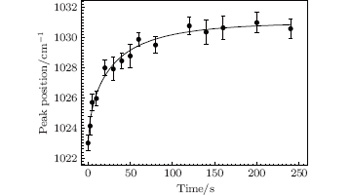
To precisely determine the structural changes of the treated sites, the central region of the irradiated site, as shown in Fig. 1(a), is measured by the ATR-FTIR technique. The ATR-FTIR spectra with laser annealing in various exposure times of the power ramp down after the damage mitigation are shown in Fig. 2. For the pristine fused silica, three main peaks at 804.1 cm− 1, 1036.9 cm− 1, and 1130.4 cm− 1 are observed in a range of 700 cm− 1– 1400 cm− 1. According to the reported literature, [27, 29] the reflection peak at 804.1 cm− 1 is attributed to the bending vibration of Si– O– Si bridges, and the reflection peak at 1036.9 cm− 1 is ascribed to the transverse-optic (TO) component of the asymmetric stretching vibration of Si– O– Si bridges, and the reflection peak at 1130.4 cm− 1 arises from the longitudinal-optic (LO) component of the asymmetric stretching vibration of Si– O– Si bridges. The TO asymmetric stretching vibrational mode of Si– O– Si bridge has been widely used to determine the fictive temperature of fused silica and in the present study the shift in this main band is monitored to characterize the structural changes of the treated sites of fused silica by a CO2 laser. As shown in Fig. 2, the TO vibrational mode with quenching after the damage mitigation has shifted to a lower wavenumber than that of the pristine sample, the peak position gradually increases with the increasing exposure time of the laser annealing by the power ramp down after the damage mitigation.
Fig. 2. ATR-FTIR spectra in various exposure times of the laser annealing by the linear power ramp down after the damage mitigation.
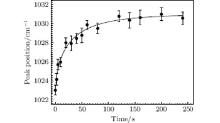
The changes of the TO asymmetric stretching vibrational mode of Si– O– Si bridges indicate the structural changes of the treated sites during the non-evaporative mitigation. The peak position of the TO vibrational mode as a function of exposure time of the laser annealing by the power ramp down after the damage mitigation is shown in Fig. 3. From the reported empirical relation between the fictive temperature and the peak position of TO vibrational mode, the fictive temperature of the mitigated sites can be directly determined by using the non-evaporative mitigation. Unfortunately, the peak position of TO vibrational mode varies with incidence angle, [29] and the incidence angle in the present ATR-FTIR study is different from the almost normal incidence angle for the reported empirical relation between fictive temperature and the peak position, [27] so we cannot directly use the reported empirical relation to estimate the corresponding fictive temperature of the treated sites. Meanwhile, it is reported that the peak position of the structural band near 2260 cm− 1 in IR transmission spectrum, which is attributed to the overtone of the asymmetric stretching vibration of the Si– O– Si bridges, is linearly correlated with the peak position of the TO asymmetric stretching vibration of Si– O– Si bridges.[27] The peak position of IR transmission spectrum at around 2260 cm− 1 is also widely useful for determining the fictive temperature of fused silica, and the precise relation between the peak position and the corresponding fictive temperature from 1000 ° C to 1550 ° C has been established as, [26]
where, ν p is the peak position of IR transmission spectrum at around 2260 cm− 1 and Tf is the fictive temperature of fused silica.
Fig. 3. Peak position of the TO asymmetric stretching vibration of Si– O– Si bridges as a function of exposure time of the laser annealing by the power ramp down after damage mitigation.
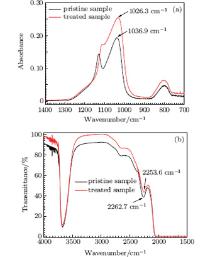
The relation between the peak position of the overtone of the asymmetric stretching vibration of Si– O– Si bridge in IR transmission spectrum and the peak position of the TO asymmetric stretching vibration of Si– O– Si bridge in ATR-FTIR spectra is calibrated by a thin fused silica slice. The thin fused silica slice is treated by CO2 laser for a sufficient length of time to establish a metastable equilibrium state at the central portion of the irradiated zone. Figures 4(a) and 4(b) show the ATR-FTIR spectra and IR transmission spectra of the pristine sample and the treated sample, respectively. For the pristine sample, the peak position of TO asymmetric stretching vibrational mode is at 1036.9 cm− 1 and the peak position of the overtone of the asymmetric stretching vibrational mode is at 2262.7 cm− 1. For the treated sample, the peak position of TO asymmetric stretching vibrational mode is at 1026.3 cm− 1 and the peak position of the overtone of the asymmetric stretching vibrational mode is at 2253.6 cm− 1. According to the linear relationship, [27] the relation of the peak position of the overtone of the asymmetric stretching vibrational mode to the peak position of TO asymmetric stretching vibrational mode can be written as,
where, ν TO is the peak position of TO asymmetric stretching vibration of Si– O– Si bridge in the ATR-FTIR spectra.
Fig. 4. ATR-FTIR spectra (a) and IR transmission spectra (b) of pristine sample and the central portion of the sample treated by 26.3-W power with a 4-mm diameter CO2 laser spot.
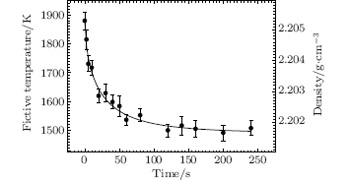
Thus, the fictive temperature of the treated site can be evaluated by the combination of Eq. (1) and Eq. (2). In addition, ν TO as a function of exposure time of the laser annealing by the power ramp down after the damage mitigation, as shown in Fig. 3, can be converted into Tf as a function of exposure time of the laser annealing by the power ramp down after the damage mitigation, as shown in Fig. 5. One of the major concerns is whether the combination of Eq. (1) and Eq. (2) can correctly evaluate the fictive temperature of the treated site. For the quenching mitigated site without the exposure of the laser annealing by the power ramp down after damage mitigation, ν TO = (1023.5 ± 0.5) cm− 1, and from Eqs. (1) and (2), Tf = (1880 ± 30)K, which is consistent with the reported ∼ 1900K for the surface of quenching mitigated sites.[24] For the pristine fused silica sample, ν TO = (1036.9 ± 0.5) cm− 1, and from Eqs. (1) and (2), Tf = (1286 ± 15)K, which is consistent with the annealing temperature 1315 K for the Corning 7980 fused silica. These results evidently indicate that the combination of Eq. (1) and Eq. (2) can correctly estimate the fictive temperature of the mitigated site from the TO vibrational mode ν TO . Figure 5 indicates that the fictive temperature first decreases abruptly with the increase of the exposure time and then gradually changes to a steady value. With the increase of the exposure time of the laser annealing by the power ramp down, the cooling rate of the material at the treated site is slower and the structure of the material, which reaches the high equilibrium temperature, has sufficient time to gradually relax to the state corresponding to the low fictive temperature during the decrease of the thermodynamic temperature. The minimum fictive temperature is stable at (1505 ± 28) K for the non-evaporative mitigation by the 3-mm-diameter beam spot, which indicates that the laser annealing by the power ramp down can control the mitigated sites to lower the fictive temperature.
Fig. 5. Fictive temperature and average density of the central surface of the mitigated site, each as a function of exposure time of the laser annealing by the power ramp down after damage mitigation.
The fictive temperature changes with exposure time of the laser annealing by the power ramp down after the damage mitigation have been converted into the corresponding density change. The UV-grade Corning 7980 fused silica used in this experiment belongs to the Type III silica glass.[30] For the Type III silica glass at a temperature in a range from 1000 ° C to 1450 ° C, the relationship between the normalized density difference and the fictive temperature of fused silica is linear and can be described as[28]
Since the density of the Corning 7980 fused silica at room temperature for the sample with 1042-° C fictive temperature is 2.20 g/cm3 in this experiment, from Eq. (3), the relation between the density and the fictive temperature of the Corning 7980 fused silica can be written as
Using this relation, the density near the surface of the central region of the treated site can be evaluated from the fictive temperature, and the results are shown in Fig. 5. Because the density is linear with respect to the fictive temperature, the change evolution of the density is similar to that of the fictive temperature. For the quenching treated sites without laser annealing after damage mitigation, the surface density of the central portion enhances (0.24 ± 0.01)% compared with for the pristine sample site. The laser annealing by the power ramp down after damage mitigation effectively suppresses the density change and the minimum increase of surface density of the mitigated sites can be reduced to (0.08 ± 0.01)% compared with that of the pristine sample site.
The experimental data of the surface density of the central region of the treated site with increasing exposure time of the laser annealing by the power ramp down are well fitted to the following equation:
where ρ (t) is the surface density of the central portion of the treated sites with exposure time t of the power ramp down, ρ 0 = (2.2042 ± 0.0002) g/cm3 is the surface density of the central portion of the treated sites with infinite exposure time, A = (0.0037 ± 0.0002) g/cm3 is a time-independent constant, τ = (23 ± 4)s is the average relaxation time, and β = (0.60 ± 0.08) is the stretched exponential parameter. This density evolution of the treated sites with increasing exposure time of the laser annealing by the power ramp down is consistent with the stretched exponential Kohlrausch– William– Watts function for the structural relaxation of glass that was reported by Scherer.[31]
4 Conclusions
The surface density changes of the central portion of the sites treated by using the CO2 laser-based non-evaporative mitigation are investigated by ATR-FTIR spectra. The ATR-FTIR peak shifts of the treated sites of fused silica are monitored to determine the changes of the fictive temperature and the corresponding density. For the quenching treated sites, the surface fictive temperature of the treated site increases up to (1880 ± 30) K, and the corresponding density is increased by (0.24 ± 0.01)% compared with the initial density. Laser annealing by the exposure of a power ramp down after damage mitigation effectively suppresses the structural change, which could reduce the fictive temperature of the treated sites to (1505 ± 28) K and minimize the increase of the corresponding density to (0.08 ± 0.01)% of the initial density. These results provide sufficient evidence that laser annealing by a power ramp down after damage mitigation has a positive effect on the control of the structural change induced by CO2 laser-based damage mitigation.
CampbellJ H, Hawley-FedderR A, StolzC J, MenapaceJ A, BordenM R, WhitmanP K, YuJ, RunkelM, RileyM O, FeitM D and HackelR P2004Proc. SPIE534184DOI:10.1117/12.538471[Cited within:1]
HanW, HuangW Q, WangF, LiK Y, FengB, LiF Q, JingF and ZhengW G2010Chin. Phys. B19106105DOI:10.1088/1674-1056/19/10/106105[Cited within:1][JCR: 1.148][CJCR: 1.2429]
10
HanW, WangF, ZhouL D, FengB, JiaH T, LiK Y, XiangY and ZhengW G2012Chin. Phys. B21077901DOI:10.1088/1674-1056/21/7/077901[Cited within:1][JCR: 1.148][CJCR: 1.2429]
11
NortonM A, AdamsJ J, CarrC W, DonohueE E, FeitM D, HackelR P, HollingsworthW G, JarboeJ A, MatthewsM J, RubenchikA M and SpaethM L2008Proc. SPIE672067200HDOI:10.1117/12.748441[Cited within:1]
12
HrubeshL W, NortonM A, Moland erW A, DonohueE E, MaricleS M, PenetranteB M, BrusascoR M, GrundlerW, ButlerJ A, CarrJ W, HillR M, SummersL J, FeitM D, RubenchikA, KeyM H, WegnerP J, BurnhamA K, HackelL A and KozlowskiM R2002Proc. SPIE467923DOI:10.1117/12.461723[Cited within:1]
13
BassI L, GussG M and HackelR P2005Proc. SPIE599159910CDOI:10.1117/12.638828[Cited within:1]
14
BassI L, GussG M, Nostrand M J and WegnerP J2010Proc. SPIE7842784220DOI:10.1117/12.867862[Cited within:1]
15
AdamsJ J, BolourchiM, BudeJ D, GussG M, MatthewsM J and Nostrand M C2010Proc. SPIE7842784223DOI:10.1117/12.867652[Cited within:3]
Effects of an ultra-strong magnetic field on electron capture rates for Co-55 are analyzed in the nuclear shell model and under the Landau energy levels quantized approximation in the ultra-strong magnetic field, and the electron capture rates on 10 abundant iron group nuclei at the surface of a magnetar are given. The results show that electron capture rates on Co-55 are increased greatly in the ultra-strong magnetic field, by about 3 orders of magnitude generally. These conclusions play an important role in future study of the evolution of magnetars.
Du Jun 1 ;Li Ping-Ping 1 ;Luo Xia 1,2 ;
Effects of ultra-strong magnetic field on electron capture rates for 55 Co are analyzed in the nuclear shell model and under the Landau energy levels quantized approximation in the ultra-strong magnetic field, and the electron capture rates on 10 abundant iron group nuclei at the surface of magnetar are given. The results show that electron capture rates on 55 Co are increased greatly in the ultra-strong magnetic field, by about 3 orders of magnitude generally. These conclusions play an important role in future studying the evolution of magnetar.
... 6] For the high-power UV laser facilities, such as the National Ignition Facility (NIF) in USA,[7] the Laser Mega Joule in France,[8] and the SGIII laser facility in China,[9,10] the routine operation is above the damage growth threshold of fused silica optics ...
1
2013
0.0
0.0
... 6] For the high-power UV laser facilities, such as the National Ignition Facility (NIF) in USA,[7] the Laser Mega Joule in France,[8] and the SGIII laser facility in China,[9,10] the routine operation is above the damage growth threshold of fused silica optics ...
5
2009
2.112
0.0
... 6] For the high-power UV laser facilities, such as the National Ignition Facility (NIF) in USA,[7] the Laser Mega Joule in France,[8] and the SGIII laser facility in China,[9,10] the routine operation is above the damage growth threshold of fused silica optics ...
... [8,13#cod#x2013 ...
... [8,15,16] However, some problems, such as raised rims, re-deposited debris, bubbles or residual stress at the mitigated damage sites, may occur when using the non-evaporative mitigation protocol and they will lead to problematic damage re-initiation and growth, as well as downstream intensification ...
... Extensive investigations have been conducted to solve these problems,[4,8,15#cod#x2013 ...
... [8,15#cod#x2013 ...
1
2010
1.148
1.2429
... 6] For the high-power UV laser facilities, such as the National Ignition Facility (NIF) in USA,[7] the Laser Mega Joule in France,[8] and the SGIII laser facility in China,[9,10] the routine operation is above the damage growth threshold of fused silica optics ...
1
2012
1.148
1.2429
... 6] For the high-power UV laser facilities, such as the National Ignition Facility (NIF) in USA,[7] the Laser Mega Joule in France,[8] and the SGIII laser facility in China,[9,10] the routine operation is above the damage growth threshold of fused silica optics ...
1
2008
0.0
0.0
... [11] Surface damage of the fused silica optics intensively restricts the maximum output fluence of the high-power UV laser facilities, and abilities to mitigate the laser damage and enhance the damage growth threshold are necessary for the routine operation of these facilities ...
1
2002
0.0
0.0
... A variety of techniques have been developed to mitigate the growth of surface damage and the most effective technique is the CO2 laser processing technique to locally melt or evaporate the damage[12] There are two kinds of CO2 laser mitigation protocols, i ...
1
2005
0.0
0.0
... [8,13#cod#x2013 ...
1
2010
0.0
0.0
3
2010
0.0
0.0
... [8,15,16] However, some problems, such as raised rims, re-deposited debris, bubbles or residual stress at the mitigated damage sites, may occur when using the non-evaporative mitigation protocol and they will lead to problematic damage re-initiation and growth, as well as downstream intensification ...
... Extensive investigations have been conducted to solve these problems,[4,8,15#cod#x2013 ...
... [8,15#cod#x2013 ...
2
2006
1.689
0.0
... 16] Compared with the evaporative mitigation protocol, the non-evaporative mitigation protocol has the advantage of minimal surface perturbation or material removal and it only needs a simple system setup ...
... [8,15,16] However, some problems, such as raised rims, re-deposited debris, bubbles or residual stress at the mitigated damage sites, may occur when using the non-evaporative mitigation protocol and they will lead to problematic damage re-initiation and growth, as well as downstream intensification ...
Abstract A 10.6 μm CO 2 laser has been reported to effectively mitigate the laser damage growth of fused silica. Two zones of the laser irradiated area are defined in this work: the distorted zone and the laser affected zone. The parameters of the two zones are studied at different CO 2 laser beam sizes, irradiation times, and powers by microscopy, profilometry, and photoelastic method. The results show that the diameter of laser affected zone is almost completely determined by the laser beam size and the distorted zone is associated with the mitigation range of CO 2 laser beam. The diameter and depth of the distorted zone increase as the laser power and irradiation time increase. The depth grows exponentially depending on the irradiation time. The maximum residual stress discrepancy is located near the boundary of the laser affected zone. The laser damage resistance test results show that the distorted zone and the laser affected zone have a better damage resistance than the original substrate.
Based on the binary Bell polynomials, the bilinear representation, bilinear Bäcklund transformation and the Lax pair for the dissipative (2+1)-dimensional Ablowitz–Kaup–Newell–Segur (AKNS) equation are obtained. Moreover, the infinite conservation laws are also derived.
1 Business School, Shandong University of Political Science and Law, Jinan 250014 2 School of Mathematical Sciences, Liaocheng University, Liaocheng 252059
1
2012
1.148
1.2429
... [21#cod#x2013 ...
1
2012
1.148
1.2429
... 22] In addition, high temperature oven annealing or laser annealing can effectively control the residual stress to an acceptable level ...
1
2012
1.148
1.2429
3
2009
0.0
0.0
... 24] and the non-evaporative mitigation protocol with the combination of particular powers and exposure times of CO2 laser can effectively eliminate raised rims, re-deposited debris, and bubbles at the mitigated damage sites ...
... 24] These modifications of the mitigated damage sites induced by intensive CO2 laser treatment are associated with the local structural changes of fused silica ...
... [24] For the pristine fused silica sample, #cod#x03BD ...
1
2010
3.385
0.0
... [25] Considering the fact that the properties of fused silica are strongly dependent on the structure, it is important to systematically study the structural changes of fused silica for non-evaporative mitigation ...
3
2003
0.71
0.0
... [26] Infrared (IR) spectroscopy has been widely used to characterize the structure of fused silica, and the correlation between the IR peak position of silica structural band and the frozen-in temperature of fused silica, i ...
... [26,27] The structure of fused silica depends on the fictive temperature, and the relationship between fictive temperature and glass density has been reported ...
... C has been established as,[26] ...
5
1995
1.597
0.0
... [26,27] The structure of fused silica depends on the fictive temperature, and the relationship between fictive temperature and glass density has been reported ...
... According to the reported literature,[27,29] the reflection peak at 804 ...
... Unfortunately, the peak position of TO vibrational mode varies with incidence angle,[29] and the incidence angle in the present ATR-FTIR study is different from the almost normal incidence angle for the reported empirical relation between fictive temperature and the peak position,[27] so we cannot directly use the reported empirical relation to estimate the corresponding fictive temperature of the treated sites ...
... [27] The peak position of IR transmission spectrum at around 2260#cod#x00A0 ...
... According to the linear relationship,[27] the relation of the peak position of the overtone of the asymmetric stretching vibrational mode to the peak position of TO asymmetric stretching vibrational mode can be written as, ...
2
2004
1.597
0.0
... [28] Thus, the density change of fused silica induced by localized CO2 laser treatment can be measured by the IR technique ...
... C, the relationship between the normalized density difference and the fictive temperature of fused silica is linear and can be described as[28] ...
2
1992
0.0
0.0
... According to the reported literature,[27,29] the reflection peak at 804 ...
... Unfortunately, the peak position of TO vibrational mode varies with incidence angle,[29] and the incidence angle in the present ATR-FTIR study is different from the almost normal incidence angle for the reported empirical relation between fictive temperature and the peak position,[27] so we cannot directly use the reported empirical relation to estimate the corresponding fictive temperature of the treated sites ...
1
2004
1.11
0.0
... [30] For the Type III silica glass at a temperature in a range from 1000#cod#x00A0 ...
1
1990
1.597
0.0
... [31] ...
ATR-FTIR spectroscopic studies on density changes of fused silica induced by localized CO2 laser treatment
[Zhang Chuan-Chaoa), Zhang Li-Juana), Liao Weia), Yan Zhong-Huab), Chen Jinga)†, Jiang Yi-Lana), Wang Hai-Juna), Luan Xiao-Yua), Ye Ya-Yuna)‡, Zheng Wan-Guoa), Yuan Xiao-Donga)]


 , Jiang Yi-Lan