


Selection of quantum path in high-order harmonics and isolated sub-100 attosecond generation in few-cycle spatially inhomogeneous laser fields*
[Ge Xin-Lei, Du Hui, Wang Qun, Guo Jing† , Liu Xue-Shen‡]
, Liu Xue-Shen‡]
|
|


Corresponding author. E-mail: gjing@jlu.edu.cn
Corresponding author. E-mail: liuxs@jlu.edu.cn
Project supported by the National Natural Science Foundation of China (Grant Nos. 11174108, 11104108, and 11271158).
We theoretically study the selection of the quantum path in high-order harmonics (HHG) and isolated attosecond pulse generation from a one-dimensional (1D) model of a
An attosecond (as) pulse can not only probe the ultrafast electronic dynamics in atoms and molecules with extraordinary accuracy and resolution but can also extend the ultrafast measurements to the time scale of electronic motions.[1– 4] High harmonic generation (HHG), which is caused by the interactions between a laser and atoms or molecules, is widely used to produce as pulses. Generally speaking, the HHG spectrum exhibits a fast decrease for the first few harmonics, it then presents a broad plateau and ends up with a sharp cutoff. The physical mechanism of HHG is well explained by the semi-classical three-step model.[5– 7] First, an electron tunnels through the barrier made by the Coulomb potential and the laser field. Second, the electron oscillates and obtains kinetic energy under the effect of the laser field. Finally, when the laser field inverses its direction, the electron comes back to its initial state and emits an harmonic photon. A great deal of attention has been devoted to broadening the plateau width and enhancing the harmonic conversion efficiency.
Numerical approaches to study and control electronic processes in atoms and molecules are largely based on the assumption that the laser electric field is homogeneous in the region where the electron dynamics takes place.[8– 11] Recently, research in laser– atom interaction and as pulses has been created in spatially inhomogeneous fields.[12– 14] Pé rez-Herná ndez et al.[15] solved the three-dimensional time-dependent Schrö dinger equation in the length gauge by employing a double-pulse, inhomogeneous driving laser field, to show that the combination of temporal and spatial laser field synthesis results in a dramatic cutoff extension that is far beyond the usual semi-classical limit. Luo et al.[16] investigated the HHG in a spatially inhomogeneous field with mid-infrared driving wavelength and few-cycle duration without CEP stabilization and this spatiotemporally synthesized electric field is powerful enough to control the quantum path. Luo et al.[17] also demonstrated that by adding a femtosecond UV pulse, the quantum paths contributing to the harmonics can be dramatically enhanced. The propagation of a spatially inhomogeneous field is also in consideration.[18]
The distribution of inhomogeneous spatial can be obtained experimentally by using a laser field as produced by nanoplasmonic antennas, [12, 13, 19] dielectric nanoparticles, [20] metal nanotips, [21] and metallic waveguides.[22] The laser electric field is then no longer homogeneous in space.
In our previous work, we have considered the influence of nuclear motion on the HHG of a 

We theoretically study the HHG and IAP generation in few-cycle spatially inhomogeneous laser fields by numerically solving the TDSE for a one-dimensional (1D) model of 

The soft-core potential of a 

The internuclear distance is always kept near the equilibrium position R = 2.6 a.u. The ground state energy is − 31.7 eV for a 
The ionization probability is obtained by

where the summation is over all the bound states φ n(x) when the field has been turned off.
The harmonic spectrum can be obtained by the Fourier transformation of a(t)

The temporal profile of an as pulse can be obtained by superposing several harmonics

where q is the harmonic order, aq = ∫ a(t) e− iqω t dt.
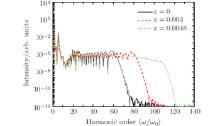
We will investigate the influence of inhomogeneity of the laser field for the high-order harmonic spectrum. As shown in Fig. 1, the HHG of a 

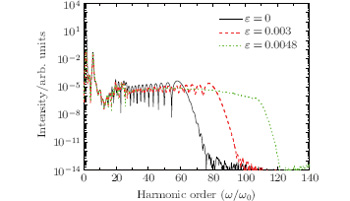 | Fig. 1. Harmonic spectrum of  |
To further understand the physical mechanism of HHG, we investigate the time-frequency profile of the time-dependent dipole of 
 | Fig. 2. The time-frequency distribution of the HHG spectra corresponds to (a) the solid black curve (ε = 0 a.u.), (b) the dashed red curve (ε = 0.003 a.u.), (c) the dotted green curve (ε = 0.0048 a.u.) in Fig. 1. The abbreviation o.c. denotes the optical cycle. |
In order to better understand the structure of HHG, we give a clear physical picture by the semi-classical three-step model. The circular and triangle curves in Fig. 3 represent the harmonic orders as functions of the ionization and emission times, respectively. We also present the ionization probability of the electron for different parameters of inhomogeneous fields in Figs. 3(a)– 3(c) (solid green curve). Figure 3(a) (ε = 0 a.u.) shows that there are two energy peaks contributing to the HHG, which are marked as A1 and A2, respectively. The ionization rate of the electrons ionized before − 0.43 o.c. is very low (see the green curve in Fig. 3(a)), which results in a lower harmonic efficiency. Thus the harmonics emission at around − 0.05 o.c. can be ignored. This is in agreement with the result that the intensity of peak P2 is weaker than peak P1, as shown in Fig. 2(a). The significant increase of the ionization rate after − 0.43 o.c., and the ionization rate from − 0.27 o.c. to − 0.17 o.c. is almost the same, which implies that the short trajectory and long trajectory make the same contribution to the HHG. In Fig. 3(b) (ε = 0.003 a.u.), there are still two energy peaks contributing to the HHG (marked as B1 and B2). For the same reason presented above, the contribution of B1 can be ignored. The ionization rate change from − 0.36 o.c. to − 0.21 o.c. is smaller than that from − 0.21 o.c. to 0 o.c. The harmonic efficiency mainly depends on the ionization rate. This implies that the contribution of the short trajectory for B2 is greater than that of the long trajectory. The harmonic spectrum becomes smooth. As shown in Fig. 3(c) (ε = 0.0048 a.u.), there are two energy peaks C1 and C2 contributing to the HHG. The peak C1 can be ignored. The long trajectory disappears and there is only a short trajectory for peak C2, which is consistent with that in Fig. 2(c). This is advantageous to the generation of an IAP.
 | Fig. 3. The dependence of the harmonic order on the ionization time (the blue circular curve) and the emission time (the red triangle curve), and the dependence of the ionization probability on time (the solid green curve), (a) ε = 0 a.u., (b) ε = 0.003 a.u., (c) ε = 0.0048 a.u. A dotted black curve is used to guide the eye. o.c. denotes the optical cycle. |
Figure 4(a) shows the dependence of the semiclassical trajectories on the ionization (ti) and emission (tr) times for different values of ε . We focus on the ionization time (ti) between − 0.45 and 0.03 optical cycles, which is given in Fig. 4(b). We can observe how the long trajectories change with the different inhomogeneities of the laser field. For the homogeneous case (green triangles), the emission time of the long trajectory is tr ≥ 0.43 optical cycles (as indicated in Fig. 3(a)) while the emission time of the short trajectory is tr ≤ 0.43 optical cycles (a green dashed dotted curve to guide the eye in Fig. 4(b)). We find that the harmonic spectrum has many modulations because both the short and long trajectories are visible and the modulations of HHG come from the interferences of different quantum trajectories. We can see a similar phenomenon for the case of ε = 0.003 a.u. (blue squares), but it differs in that the emission time of the long trajectory is earlier than that of ε = 0 a.u. case as shown in Fig. 4(a), and the long trajectories are a little suppressed. We then increase the parameter ε to be 0.0048 a.u. (red circles), the emission time of the long trajectory is tr ≥ 0.67 optical cycles while the emission time of the short trajectory is tr ≤ 0.67 optical cycles, as indicated in Fig. 3(c). As shown in Fig. 4(b), for the ε = 0.0048 a.u. case, only the short trajectory contributes to the HHG and the long trajectory is absent, which is advantageous to the generation of an IAP.
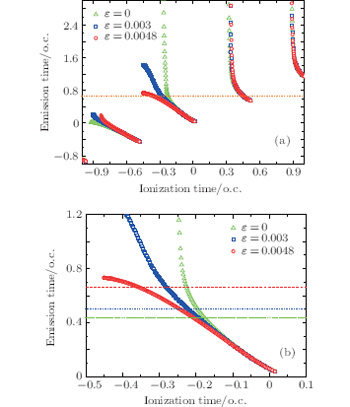 | Fig. 4. (a) Dependence of the semiclassical trajectories on the ionization (ti) and emission (tr) times for ε = 0 a.u. (green triangles), ε = 0.003 a.u. (blue squares), and ε = 0.0048 a.u. (red circles). (b) A detailed view of ionization time from − 0.5 o.c. to 0.1 o.c. o.c. denotes the optical cycle. |
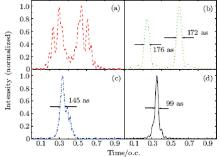
Figure 5 presents the generation of as pulses by superposing a series of harmonics (the vertical coordinates are normalized for comparison). As shown in Fig. 5(a), for the homogeneous case (ε = 0 a.u.), by superposing 31 harmonics (28th– 59th) an irregular as pulse can be observed in every cycle. By superposing 13 harmonics (35th– 48th), a regular as pulse train with two bursts in every cycle can be observed, as shown in Fig. 5(b). The long and short quantum paths have different emission times, which is disadvantageous to the generation of an IAP due to the interference between the long and short paths. This is consistent with the analysis of the time-frequency distributions of the HHG, as shown in Fig. 2(a). Figure 5(c) shows the as pulses generated by superposing 58 harmonics (51th– 109th) for the inhomogeneous case (ε = 0.0048 a.u.), a regular as pulse with only one main burst in every cycle is generated. By superposing properly selected 25 harmonics (60th– 85th), the pulse duration is as short as 99-as pulse, as shown in Fig. 5(d). Figure 6 shows the dependence of the cutoff on the inhomogeneity ε of the driving field. The values are chosen between 0.0 a.u. and 0.005 a.u. With the increase of the inhomogeneity ε , the cutoff of the HHG is extended remarkably. There is a nonlinear variation in the cutoff position as a function of the parameter ε of inhomogeneous laser fields, which is in agreement with Refs. [12] and [13]. We have also examined the consistency of the dependence of the cutoff position on ε using the solutions of the TDSE and the classical trajectory method, and the results present the same tendency.
 | Fig. 5. The temporal profiles of the as pulses generated by superposing the harmonics (a) from 28th to 59th order and (b) from 35th to 48th order for the homogeneous case (ε = 0 a.u.). The temporal profiles of the as pulses generated by superposing the harmonics (c) from 51st to 109th order and (d) from 60th to 85th order for the inhomogeneous case (ε = 0.0048 a.u.). o.c. denotes the optical cycle. |
 | Fig. 6. The variation of the cutoff position of HHG as a function of inhomogeneity ε of the driving field between 0.0 a.u. and 0.005 a.u. |
The HHG and as pulse generated by few-cycle pulses would be greatly influenced by their CEPs.[16] We then further consider the influence of driving field CEP on the harmonic spectrum in an inhomogeneous field with the parameter ε = 0.0048 a.u. The other parameters are kept constant when we investigate the CEP effect on the harmonic spectrum. We present the harmonic spectra with the relative phases of φ = 0 (solid black curve), φ = 0.05π (dashed red curve), φ = − 0.1π (dotted green curve), and φ = − 0.15π (dashed– dotted blue curve), respectively. As shown in Fig. 7, the continuum harmonic spectrum can be obtained for all of these cases. One can also see that when the CEP is positive, the harmonic spectrum is extended and the intensity is decreased. When the CEP is negative, the intensity is increased and the harmonic spectrum is shortened. This is related to the ionization and acceleration properties of the electrons in an inhomogeneous field. The generations of IAP for all these four cases are about 99 as (φ = 0), 94 as (φ = 0.05π ), 110 as (φ = − 0.1π ), and 115 as (φ = − 0.15π ).
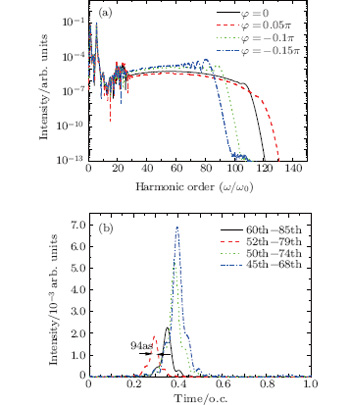 | Fig. 7. (a) The harmonic spectra in an inhomogeneous field (ε = 0.0048 a.u.) with the different relative phases. (b) Temporal profiles of the generated isolated as pulses synthesized by the continua shown in panel (a). The cases of φ = 0 (solid black curve), φ = 0.05π (dashed red curve), φ = − 0.1π (dotted green curve), and φ = − 0.15π (dashed– dotted blue curve), respectively. o.c. denotes the optical cycle. |
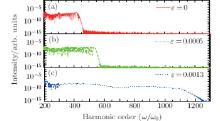
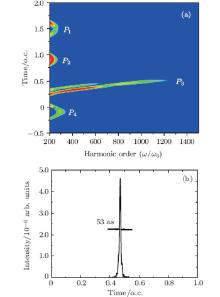
We have investigated HHG by a 3-fs, 800-nm (ω 0 = 0.057) laser pulse, which shows that the inhomogeneous fields have an important effect on the HHG process. Next, we will investigate the influence of HHG in few-cycle long-wavelength spatially inhomogeneous field. A 15-fs, 1600-nm laser pulse is used and the other parameters are kept constant. When ε = 0 a.u., which corresponds to a homogenous field, the cutoff position is at the 418th harmonic, and some modulations appear in HHG (The red line), as shown in Fig. 8(a). When we set the parameter ε = 0.0005 a.u., the harmonic spectrum becomes smooth and the cutoff is extended to the 536th (the green line), as shown in Fig. 8(b). When we increase the parameter ε to 0.0013, the cutoff position of the harmonic spectrum is extended to 1121st order, and a supercontinuum harmonic spectrum can be obtained (the blue line), as shown in Fig. 8(c). The time-frequency distribution for the case of ε = 0.0013 a.u. is shown in Fig. 9(a). There are four main energy peaks contributing to the HHG, which are marked as P1 and P2, P3 and P4, respectively. For the order above 296th, only the short trajectory of P3 makes a contribution to the HHG, whose emission time is at about 0.32 o.c. The supercontinuum harmonic plateau is obtained, which is consistent with the HHG in Fig. 8(c). The short path is selected and an IAP can be generated. By superposing properly selected 100 harmonics (900th– 1000th), the pulse duration is as short as 53-as pulse, as shown in Fig. 9(b).
 | Fig. 8. Harmonic spectrum of  |
 | Fig. 9. (a) The time-frequency distribution of the HHG spectra corresponds to the blue line (ε = 0.0015 a.u.) as shown in Fig. 8(c). (b) The temporal profiles of the as pulses generated by superposing the harmonics from 900th to 1000th order. o.c. denotes the optical cycle. |
We study the HHG of 

| 1 |
|
| 2 |
|
| 3 |
|
| 4 |
|
| 5 |
|
| 6 |
|
| 7 |
|
| 8 |
|
| 9 |
|
| 10 |
|
| 11 |
|
| 12 |
|
| 13 |
|
| 14 |
|
| 15 |
|
| 16 |
|
| 17 |
|
| 18 |
|
| 19 |
|
| 20 |
|
| 21 |
|
| 22 |
|
| 23 |
|
| 24 |
|
| 25 |
|
| 26 |
|
| 27 |
|
| 28 |
|