Detecting overlapping communities in networks via dominant label propagation*
Cite this Article
Sun He-Li, Huang Jian-Bin, Tian Yong-Qiang, Song Qin-Bao, Liu Huai-Liang. Detecting overlapping communities in networks via dominant label propagation* . Chinese Physics B, 2015, 24(1): 018703 
Permissions
Detecting overlapping communities in networks via dominant label propagation*
Corresponding author. E-mail: hlsun@mail.xjtu.edu.cn
Project supported by the National Natural Science Foundation of China (Grant Nos. 61173093 and 61202182), the Postdoctoral Science Foundation of China(Grant No. 2012 M521776), the Fundamental Research Funds for the Central Universities of China, the Postdoctoral Science Foundation of Shannxi Province,China, and the Natural Science Basic Research Plan of Shaanxi Province, China (Grant Nos. 2013JM8019 and 2014JQ8359).
Abstract
Community detection is an important methodology for understanding the intrinsic structure and function of a real-world network. In this paper, we propose an effective and efficient algorithm, called Dominant Label Propagation Algorithm (Abbreviated as DLPA), to detect communities in complex networks. The algorithm simulates a special voting process to detect overlapping and non-overlapping community structure in complex networks simultaneously. Our algorithm is very efficient, since its computational complexity is almost linear to the number of edges in the network. Experimental results on both real-world and synthetic networks show that our algorithm also possesses high accuracies on detecting community structure in networks.
Keyword:
89.75.Fb; 89.75.Hc; overlapping community detection; dominant label propagation; complex network
1. Introduction
Community structure is considered an essential characteristic of complex networks. Community discovery on networks is an important issue and has attracted more and more attention from researchers. Recently, numerous methods have been developed for detecting communities in networks. However, most of them are designed just for detecting a disjointed community.[1, 4] In real social networks, communities sometimes overlap. For example, someone may naturally belong to several social groups like friends, families, and schoolmates. For this reason, some approaches[5, 10] have been investigated to detect overlapping communities in networks. Label propagation has been verified as a very efficient approach for detecting communities in networks.[2, 6, 10, 11] However, the original label propagation method is designed for handling non-overlapping communities. Recently, two improved label propagation methods, COPRA[6] and SLPA, [10] are proposed to reveal overlapping communities in a network. However, these two algorithms only take advantage of the information of nodes' neighbors, and do not take the importance of each neighbor into consideration. Moreover, the COPRA produces lots of small size communities in some networks, and the SLPA has a high space complexity. In this paper, we propose an effective and efficient label propagation algorithm for detecting both overlapping communities and non-overlapping communities.
The main contributions of the paper are summarized as follows. First, we design a fast algorithm for revealing the overlapping and non-overlapping community structure in large-scale networks via dominant label propagation. Second, we define the confidence of a node to its neighbors to take the importance of a node' s neighbors into account. Third, we define an inflation operator to control the overlapping rate. Experimental results from both real-world and synthetic networks show that our algorithm has good performance in detecting the community structure in networks.
The rest of the paper is organized as follows. Section 2 presents the related work. Section 3 introduces the principle and some definitions. The algorithm DLPA is described in detail in Section 4. Section 5 provides the experimental results and analysis. Finally, Section 6 concludes the paper.
2. Related work
Community detection in complex networks is a hot research topic in recent years. Numerous techniques have been proposed to identify potential community structures in networks. However, most of the methods are designed to detect disjointed communities, such as the modularity optimization based method, [1] the method using information theory, [3] the density-based methods, [4, 12] and the methods based on node similarity.[13, 15]
In real social networks, some objects may naturally belong to several social groups. For this reason, many overlapping community detection methods have been proposed. In 2005, Palla et al. proposed the algorithm CPM[9] for detecting overlapping communities. It is based on the assumption that a community consists of fully connected subgraphs. Through searching for adjacent cliques, CPM can detect overlapping communities. Lancichinetti et al. proposed a hierarchical and overlapping community detection method LFM, [7] which identifies a community from an arbitrary node. GCE, proposed by Lee et al. in 2010, [8] starts with all maximal cliques as initial communities, and removes communities that are too similar. In contrast, the iterative scan algorithms detect community through adding or removing nodes until a local density function cannot be improved.[5] The algorithm LTE can reveal multi-resolution communities from a start node via local optimization of a tightness measure.[16] By adjusting an optional resolution parameter, LTE can identify overlapping communities. In Ref. [17], a community is regarded as the set of links, and a method is devised to detect the overlapping link communities. Psorakis et al.[18] proposed a non-negative factorization (NMF)-based approach to detect communities. The method needs a pre-defined parameter K that represents the number of communities. Recently, Coscia et al. presented a local-first algorithm DEMON, [19] which is able to reveal the overlapping community structure of real complex networks through merging local communities detected on the ego networks.
Label propagation is an efficient approach for community detection.[2] This type of method is extremely fast and known to be one of the very few near-linear solutions to the community discovery problem. In COPRA, [6] each node updates its labels and the belonging coefficients averaged out from the coefficients of all its neighbors in a synchronous manner. SLPA is a general speaker– listener based information propagation process.[10] It spreads label information between nodes according to pairwise interaction rules. In the SLPA, each node has a memory space to store the received information. The probability of observing a label in the memory of a node is perceived as the membership strength. Thus, it needs a post-processing parameter γ to generate communities. A smaller value of γ produces a larger number of communities. However, there is no proper strategy for parameter selection. Compared with the existing label propagation methods, our algorithm introduces the concept of confidence to denote the importance of each neighbor in the label updating process. Moreover, our algorithm employs a different dynamic label updating process.
3. Principle and concepts
Our algorithm is an enhanced version of the label propagation algorithm (LPA).[2] In the LPA, each vertex is associated with a label, which is an identifier such as a node id. Each node iteratively updates its label according to the labels and coefficients of its neighbor nodes. Disjoint communities are identified when the algorithm converges, which signals the start of an unchanging state for every node. All vertices with the same label are considered as being in the same community.
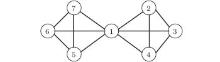
However, in a real-world network, a node may belong to more than one community. For example, as shown in Fig. 1, it can be seen that node 1 belongs to the two adjacent communities simultaneously. For this reason, some overlapping community detection methods based on label propagation have been proposed.[6, 10] Based on the existing label propagation algorithms for detecting overlapping communities, we propose an improved algorithm DLPA to reveal overlapping communities. The DLPA mimics a special voting process and harnesses a new dynamic updating strategy. In each iteration step, one node is selected as the target node, and each neighbor of the node has a chance to vote. However, a different neighbor may have a different influence on the target node. In order to simulate this situation, we define the confidence of a node as follows.
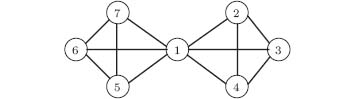 | Fig. 1. A sample network. |
Definition 1 The confidence of the node v to its neighbor node u. Its neighbors are defined as
 |
where Nb(u) represents the set of neighbors of node u and sim(u, v) represent the similarity between nodes u and v. Here, we use the Jaccard similarity function
 |
where Γ (x) = Nb(x)∪ { x} .
For a pair of nodes, the confidence measures the intensity of their connection. For example, as shown in Fig. 1, the confidences of node 7 to its neighbors are δ 1(7) = 0.167, δ 5(7) = 0.389, and δ 6(7) = 0.389. It can be seen that the relationship between node 7 and its neighbor nodes 5 and 6 is stronger than that of node 1.
Similar to the algorithm COPRA, [6] let b(c, u) represent the belonging coefficient of the node u which is a member of the community c, and b(c, u) also denotes the probability of u being a member of the community c. Before designing the update rule, we first give the definition of a dominant label.
Definition 2 Given a node u, the dominant label of u is defined as
 |
A dominant label is a label whose belonging coefficient is the largest. Obviously, it represents the community that the node most likely belongs to. Therefore, we also use it to extract the non-overlapping communities in the algorithm DLPA.
Combining Definitions 1 and 2, we design the update rule for node u as follows:
 |
where

Especially, if a neighbor has more than one dominant label, we randomly choose a label from them as its dominant label.
Next, we introduce the inflation operator Γ in on belonging coefficients to control the overlapping rate, within which is the parameter taking real-number values. After applying Γ in on the labels of node i, the belonging coefficient rises to the in-th power. The inflation operator Γ in is defined as
 |
Based on the above definitions, the label updating process is described in the following. First, the dominant label of each node is initialized as its corresponding ID, and the corresponding belonging coefficient is set to 1. Second, for any target node u, each neighbor of u sends its dominant label and the corresponding belonging coefficient to u. Third, after u receives the dominant labels and the belonging coefficients from its neighbors, we multiply each belonging coefficient by its corresponding confidence to output the new belonging coefficient. Fourth, we normalize each new belonging coefficient from its neighbors via Eq. (4), and compute the dominant label via Eq. (3).
Regarding the inflation operator on belonging coefficients, we give an example to illustrate the effect of the inflation operator on belonging coefficients. Suppose that there are four labels with belonging coefficients 0.4, 0.3, 0.2, and 0.1. Table 1 shows the results after applying the Γ in operator to these belonging coefficients, where in= 1, 2, 3, .... From Table 1, when the belonging coefficient is greater than a threshold, the outputs produced by the inflation operator on belonging coefficients become larger. On the contrary, when the belonging coefficient is below a threshold, the outputs produced by the inflation operator on belonging coefficients become less, as ‘ in’ gets larger. Similarly, for a fixed ‘ in’ , the outputs produced by the inflation operator on belonging coefficients become larger, as the belonging coefficient gets larger. We will discuss the effect of the inflation operator on the overlap rate after we discuss the following delete operation.
| Table 1. Effect of the inflation operator on the belonging coefficients. |
In algorithms COPRA and SLPA, the labels whose belonging coefficient is less than 1/t will be deleted, where t is a manually specified parameter. Similar to that, in the algorithm DLPA, we also need to delete the useless labels. In order to delete the useless labels automatically and make full use of the local information, we set the cut threshold to be 1/|Nb(u)|, where |Nb(u)| is the number of neighbor nodes of u. That is to say, our method preserves the labels whose belonging coefficients are greater than 1/|Nb(n)|. If there is no label whose belonging coefficient is greater than 1/|Nb(n)|, we reserve only one label that possesses the greatest belonging coefficient, and delete others.
Based on the above discussion, for a fixed in, it is easier to delete the small belonging coefficients; the large belonging coefficients are retained consequently. If the belonging coefficient is greater than a threshold, it is easier to delete the belonging coefficient operated by the inflation operator with a small in. As a result, the belonging coefficients operated by the inflation operator with a large ‘ in’ are retained. The larger the belonging coefficients are, the larger the overlapping rate is. Therefore, the inflation operator with an ‘ in’ is used to control the overlapping rate.
4. Algorithm DLPA
DLPA is an improved variation of the original label propagation method, and the label update rule simulates a special voting process. In each iteration step, one node is selected as a target node, and each neighbor of the target node has a chance to vote. In the voting process, each neighbor sends its dominant label and the corresponding belonging coefficient to the target node. The algorithm DLPA is described in detail as follows.
Initially, each node is labeled by the dominant label that is set to its ID and the belonging coefficient that is set to 1. Before updating labels iteratively, we calculate the confidence of each node to its neighbors. Then we update the labels of nodes iteratively in a random order until the maximum iteration number is reached or all labels are stable. Finally, the overlapping and non-overlapping communities are returned.
Algorithm 1 DLPA
Input Network G = (V, E), the maximum number of iteration steps T, the infation operator parameter in.
Output Labels for each node in the network.
(1) Initially, the dominant label of each node is set to its own ID, and the corresponding belonging coefficient is set to 1.
(2) Calculate the confidence of each node to its neighbors.
(3) The following steps are repeated until the maximum iteration number is reached or all labels become stable.
(3.1) Select a random update order for all nodes.
(3.2) Sequentially select node u as the target node.
(i) Each neighbor of u sends its dominant label and the corresponding belonging coefficient to u.
(ii) Use Eq. (4) to update the corresponding belonging coefficients of u.
(iii) Calculate the new dominant label of u via Eq. (3).
(iv) Apply the inflation operator Gin on the belonging coefficients of u produced in Step (ii), and delete the labels whose belonging coefficient is not greater than 1/|Nb(u)|. At last, normalize the belonging coefficients of all the remaining labels of u.
(4) Output two kinds of results: non-overlapping communities, where each node selects its dominant label as its cluster ID, and overlapping communities, where each node has multiple cluster labels.
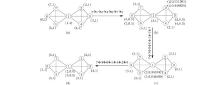
Set the network in Fig. 1 as an example. Figure 2 shows the execution procedure of DLPA. The IDs over the arrows denote the randomly selected node update sequence. Figure 2(a) denotes initial states that the dominant label of each node is set to its ID and the belonging coefficient of each node is set to 1. Next, we compute the confidence matrix of each node to its neighbors, where ‘ ’ represents that there is no confidence, as shown in Table 2. For example, for node 1, which has six neighbors, and the confidence to all its neighbors is the same, with this value being 0.222. After preparation, the update rule is executed iteratively. First, we randomly select a node sequence 3 → 1 → 2 → 4 → 6 → 7 → 5. Second, we update the labels of nodes. For example, for node 3, its neighbors are 1, 2, and 4. Obviously, the dominant label of node 1 is 1 and its belonging coefficient is 1. Thus, node 1 sends (1, 1) to node 3. Node 3 multiplies 1 and δ 3(1), and gets the new belonging coefficient 0.222. Add pair (1, 0.222) to the label set of 3. In the same way, after considering its neighbors 2 and 4, the new label set of node 3 (P3) is updated to { (1, 0.222), (2, 0.389), (4, 0.389)} . Then we compute the dominant label of 3 and apply Γ in= 3 on P3. The label set becomes { (1, 0.085), (2, 0.457), (4, 0.457)} . Since 1/|Nb(3)|=0.333, we delete the labels whose belonging coefficient is not greater than 0.333 and normalize the results. Consequently, we derive the label set { (2, 0.5), (4, 0.5)} of node 3. In the same way, we can update the labels and the corresponding belonging coefficients of the other nodes. After the first iteration, the label set of each node has been updated, and figure 2(b) shows the results. Figure 2(c) shows the results after the second iteration. At the end of the algorithm, two overlapping communities { 1, 2, 3, 4} and { 1, 5, 6, 7} are identified. Node 1 is identified as a shared node, as shown in Fig. 2(d).
| Table 2. Confidences of the nodes in the toy network. |
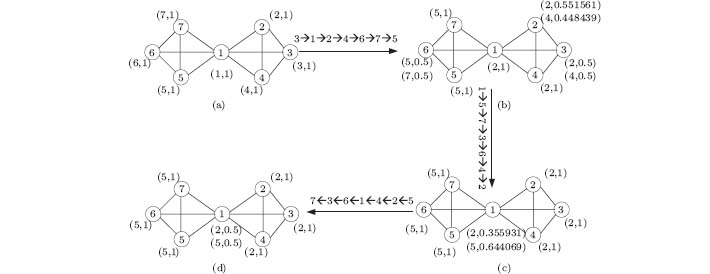 | Fig. 2. Procedure of multiple label propagation of the algorithm DLPA. |
The time complexity of DLPA is estimated as follows. Let n be the number of nodes, m be the number of edges, k be the average degree of all the nodes, and T be the maximum number of iteration steps.
Complexity of initialization of labels is O(n). Complexity of calculating the confidence of all the nodes is O(m). Label update of each node takes O(k) on average. Then, the complexity of label update for all the nodes is O(nk)=O(m). If there are T iteration steps, the total complexity of the label update is O(Tm).
In summary, the time complexity of the entire algorithm is O(m) with T ≪ m which is linear to the total number of edges m.
5. Experiment
In this section, we evaluate the performance of the algorithm DLPA proposed in this paper using some real-world and synthetic networks. For this purpose, we compare our algorithm with seven baseline algorithms. In Table 3, we list the seven baseline algorithms and relevant information. In the first column, the names of the seven algorithms are listed. In the second column, the complexity of each algorithm is listed, where m and n are the number of edges and nodes respectively, h is the number of cliques in GCE, v is the maximum number of communities with which a node can associate in COPRA, kmax is the highest degree of the n nodes in Link, T is the maximum iteration number given by the user in the SLPA and DLPA, α represents the network structure according to the degree of nodes in DEMON, and K is the number of communities given by the user in NMF. The DLPA is implemented using ANSI C++. All experiments were conducted on a PC equipped with a Pentium(R) Dual-Core 3.20 GHz CPU and 4 GB of RAM.
| Table 3. Tested algorithms in the experiments. |
5.1. Datasets
In this section, we benchmark DLPA on two types of datasets. One is on the real-world networks, but there is a problem that for many real networks, we do not know the ground truth. Hence, we turn to the other type of dataset: synthetic benchmark networks where the community structure is known. We compare the ground truth with the communities detected by the above seven algorithms. An advantage of this type of dataset is that we can vary the parameters of the networks to analyze the performance of the algorithms more meticulously.
(i) Real-world networks: to assess the performance of the DLPA in terms of accuracy, we conduct experiments on eight real-world networks, [21, 22] as listed in Table 4.
(ii) Synthetic benchmark networks: we use the LFR benchmark networks to evaluate the performance of DLPA.[23] By varying the parameters of the networks, we analyze the behavior of the algorithms in detail. Some necessary parameters are given as follows: n is the number of nodes; k is the average degree; max(k)is the maximum degree; μ is the mixing parameter (each vertex shares a fraction μ of its edges with nodes in other communities); min (c) is the minimum community size; max (c)is the maximum community size; On is the number of overlapping nodes; Om is the number of communities to which each overlapping node belongs.
| Table 4. Adopted real-world networks. |
Non-overlapping communities are thought of as a special case of overlapping communities. Therefore, we first generate a group of networks with disjoint communities. In Table 5, we list some parameters for the generated datasets. For this type of dataset, we generate eight networks with different values of mixing parameter μ ranging from 0.1 to 0.8 at a step size of 0.1. Generally, the higher the mixing parameter, the more difficult it is to identify the community structure.
| Table 5. Parameters of synthetic network with disjoint communities. |
An important property of community detection is the ability to discover overlapping communities. Therefore, we generate two groups of overlapping networks. In Table 6, we list the values of some parameters. The number of communities to which each overlapping node belongs (Om) varies from 2 to 8.
| Table 6. Parameters of synthetic networks with overlapping communities. |
5.2. Selection of the parameter
In experiments, the iteration number T of the DLPA is always set to 100. For the algorithms with tunable parameters, the performance is compared by using the results with the optimal parameters selected manually. For example, the parameter k, used in the algorithm CFinder, varies from 3 to 10. For the COPRA algorithm, the parameter υ varies from 1 to 10. In contrast, the number of iterations of the algorithm SLPA is set to 100 and the post-processing parameter γ varies form 0.01 to 0.1. As for the algorithm DEMON, the threshold is selected from 0.05 to 0.9 with an interval of 0.05. For the NMF algorithm, the threshold varies from 0.05 to 0.5 with an interval of 0.05 to convert it to a crisp clustering.
5.3. Criteria for evaluation
In this section, we introduce the criteria for evaluation. First, we quantify the above overlapping rate to evaluate the effect of the parameter into our algorithm, which is defined as
 |
where Voverlap represents the overlap nodes set, and nc represents the number of communities to which the node v belongs.
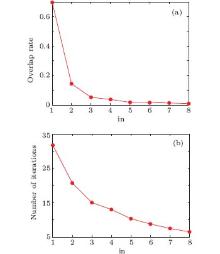
The algorithm DLPA needs a user-specified parameter ‘ in’ , which controls the overlapping rate. As discussed above, with increasing ‘ in’ , labels associated with a node become less after the delete operation. This results in a lower overlapping rate, since the number of communities that a node can belong to becomes less. Besides, the label propagation process converges easily when labels associated with a node become less. Figure 3 shows the effects of parameter ‘ in’ on the overlapping rate and the number of iterations when applying our algorithm to a football dataset. It is obvious that with increasing ‘ in’ , both the overlapping rate and the number of iterations decrease.
For network clustering, various measurement criteria has been used to evaluate the detected communities. Lancichinetti et al. proposed a new variant of the mutual information measurement[23] that is suitable to evaluate the accuracy of the found non-overlapping communities. We adopt the normalized mutual information (NMI) measurement in our experiments in this paper.
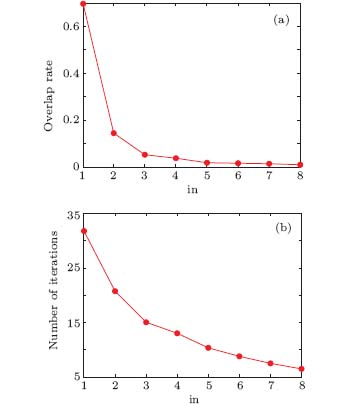 | Fig. 3. Effect of the parameter ‘ in’ on (a) the overlapping rate and (b) the iteration number. |
For real-world networks, the goodness of a result is usually assessed by the relative density of edges within communities and between communities. Modularity[24] is a popular measurement criterion in this field. The higher the modularity value, the better the result. However, the original modularity measurement is proposed just for handling non-overlapping communities. Nicosia et al.[25] designed a variant of modularity for dealing with overlapping communities. In this paper, we use the overlapping modularity measurement (Qov) in our experiments. Its value depends on the number of communities to which each vertex belongs and the intensity of its links in each community. We assume that each vertex belongs equally to all the communities. The overlapping modularity measurement is defined as a function f as follows:
 |
Identifying the nodes shared by multiple communities is an essential component for evaluating the quality of a community detection algorithm. Therefore, the node level evaluation is also important. To provide precise analysis, like the SLPA, we also consider the identification of overlapping nodes as a binary classification problem: a node is labeled as an overlapped one if 
 |
where nr is the number of correctly detected overlapping nodes divided by On, and precision is the number of correctly detected overlapping nodes divided by 
5.4. Accuracy comparison on real-world networks
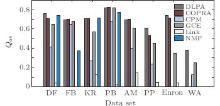
In this section, we compare five algorithms with the DLPA on the real-world networks. We remove CFinder, SLPA, and DEMON from the evaluation because of either their internal memory costs or computation inefficiency on large networks. The overlapping modularity values of these algorithms are shown in Fig. 4. It can be observed that our algorithm achieves the highest Qov in most cases. Although on some real networks, the algorithm COPRA exhibits better performance than our algorithm, the values achieved by our algorithm are pretty close to those of COPRA. In contrast, the overlapping modularity value of COPRA on the word association network is almost zero, because it detects merely one community in the network.
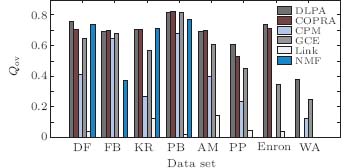 | Fig. 4. Achieved values of overlap modularity Oov by various evaluated algorithms. |
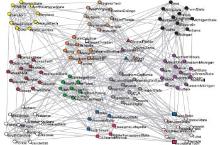
The football network is a social network with communities of American college football teams. The network contains 115 nodes and 613 edges. There is a link between two teams if they play a game together. All college football teams are divided into eleven conferences and five independent teams. Figure 5 illustrates the original football network and the communities detected by our algorithm. The cliques represent the conferences of the original network. Different colors represent distinct communities discovered by the DLPA. The overlapping nodes are highlighted by the red color. The nodes of independent teams are depicted by triangles. The nodes misclassified by our algorithm are depicted by boxes. Our algorithm discovers twelve communities in this network. One independent team, CentralFlorida, is identified as an overlapping node. Interestingly, the Sun Belt conference is divided into two small communities in this network. Five independent teams that do not belong to any community are placed into the other four communities with which they are most closely associated. Except the five independent teams, there are just four teams misclassified by our algorithm.
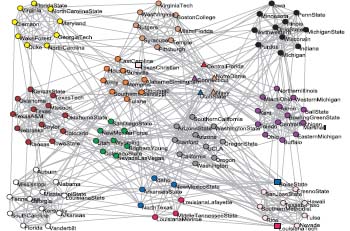 | Fig. 5. Football network and the communities discovered by the DLPA. |
As we know, a high modularity value might not necessarily mean a good partition scheme of a network. Hence, we use another popular measurement criterion NMI to evaluate the performance of our algorithm on non-overlapping community detection in the benchmark networks.
5.5. Accuracy comparison on benchmark networks
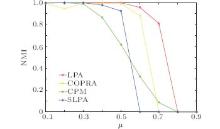
First, we assess the accuracy on disjoint benchmark networks. The achieved NMI values are shown in Fig. 6. It can been seen that our algorithm gets NMI=1 on the networks with parameter μ ≤ 5, which means a perfect match with the community structure of the original networks. Even the mixing parameter increases to 0.7, the value of NMI is still greater than 0.8. However, the performance of the DLPA decreases quickly on the networks with μ > 0.7. This is because the community structures, which are quite difficult to be successfully discovered, become indistinct in these networks. Generally speaking, the performance of the DLPA is still better than other baseline algorithms.
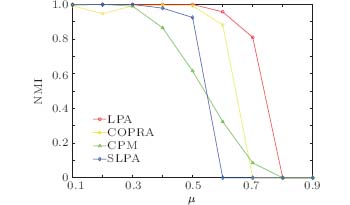 | Fig. 6. The NMI values achieved by various algorithms on synthetic networks with disjoint communities. |
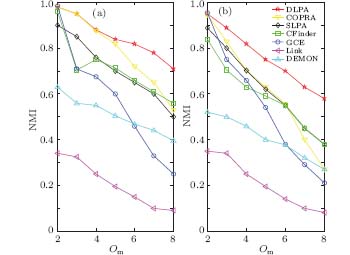 | Fig. 7. The NMI values as a function of the number of members Om in LFR Benchmark networks (a) μ = 0.1, (b) μ = 0.3. |
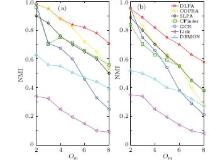
In order to assess the performance of detecting overlapping communities, we compare the accuracy of various algorithms on two types of overlapping benchmark networks above. The achieved results are shown in Fig. 7. It can be observed that the DLPA can accurately identify the overlapping communities in networks. With the increase in Om, especially when Om > 3, the DLPA can detect the communities better than other compared baseline algorithms. Besides, the results of our algorithm are very stable.
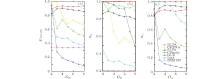
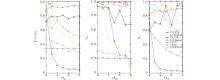
We also test the identified overlapping nodes with the ground truth in order to present the node level evaluation. Moreover, if an algorithm entails tunable parameters, we choose the parameters that lead to the best result with the highest NMI value. Figure 8 shows the F scores achieved by various algorithms on overlapping benchmark networks with μ = 0.1. Figure 9 shows the results on networks with μ = 0.3. The DLPA achieves the best scores on these two types of networks when the parameter Om is greater than 3. It correctly uncovers a reasonable fraction of the overlapping nodes even when those nodes belong to multiple groups (as demonstrated by the high precision and recall in Figs. 8 and 9). Other algorithms fail to strike the balance between precision and recall, which results in low F scores, especially for algorithms Link and DEMON.
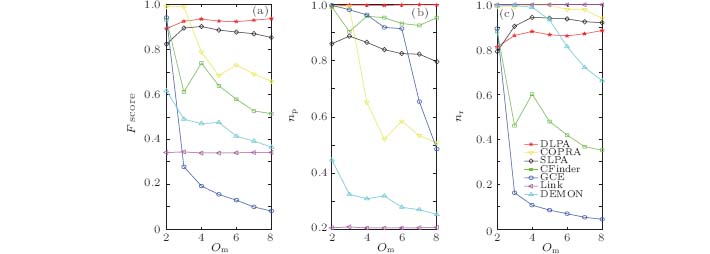 | Fig. 8. (a) Values of the F score, (b) recall nr, and (c) precision np as functions of the number of members Om in the LFR Benchmark networks with a mixing parameter μ = 0.1. |
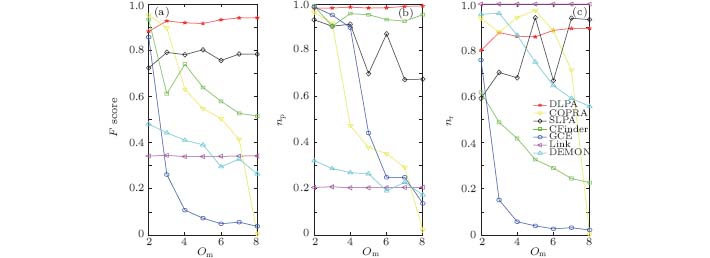 | Fig. 9. (a) Values of the F score, (b) recall nr, and (c) precision np as functions of the number of members Om in the LFR Benchmark networks with a mixing parameter μ = 0.3. |
6. Conclusions
In this paper, a novel label propagation based algorithm DLPA is proposed to detect non-overlapping and overlapping communities in networks. By simulating a voting process, it can efficiently and effectively identify the community structure in networks. The time complexity of the DLPA is nearly linear to the number of edges of the networks and we apply an inflation operator to control the overlap rate properly. How to extend the algorithm DLPA to a parallel implementation will be a valuable future work.
Reference
| 1 |
|
| 2 |
|
| 3 |
|
| 4 |
|
| 5 |
|
| 6 |
|
| 7 |
|
| 8 |
|
| 9 |
|
| 10 |
|
| 11 |
|
| 12 |
|
| 13 |
|
| 14 |
|
| 15 |
|
| 16 |
|
| 17 |
|
| 18 |
|
| 19 |
|
| 20 |
|
| 21 |
|
| 22 |
|
| 23 |
|
| 24 |
|
| 25 |
|