
Ultrafast solvation dynamics at internal sites of staphylococcal nuclease investigated by site-directed mutagenesis*
Cite this Article
Gao Guang-Yu, Li Yu, Wang Wei, Wang Shu-Feng, Dongping Zhong, Gong Qi-Huang. Ultrafast solvation dynamics at internal sites of staphylococcal nuclease investigated by site-directed mutagenesis* . Chinese Physics B, 2014, 24(1): 018201 
Permissions
Ultrafast solvation dynamics at internal sites of staphylococcal nuclease investigated by site-directed mutagenesis*
Corresponding author. E-mail: wangsf@pku.edu.cn
Project supported by the National Basic Research Program of China (Grant Nos. 2013CB921904, 2009CB930504, and 2013CB328700) and the National Natural Science Foundation of China (Grant Nos. 11074016, 11121091, 10934001, 61177020, 11134001, and 10828407).
Abstract
Internal solvation of protein was studied by site-directed mutagenesis, with which an intrinsically fluorescent probe, tryptophan, is inserted into the desired position inside a protein molecule for ultrafast spectroscopic study. Here we review this unique method for protein dynamics research. We first introduce the frontiers of protein solvation, site-directed mutagenesis, protein stability and characteristics, and the spectroscopic methods. Then we present time-resolved spectroscopic dynamics of solvation dynamics inside cavities of active sites. The studies are carried out on a globular protein, staphylococcal nuclease. The solvation at sites inside the protein molecule’s cavities clearly reveals characteristics of the local environment. These solvation behaviors are directly correlated to enzyme activity.
Keyword:
82.53.Ps; 87.14.E–; 87.15.kr; 87.64.K–; ultrafast spectroscopy; protein dynamics; staphylococcal nuclease (SNase); site-directed mutagenesis
1. Introduction
Proteins and water are essential to life on earth, since they are the key factors in all biological activities. Proteins function as structural elements, catalysts of biological reactions, carriers of ions and molecules, immunization antibodies, luminance emitters, etc. Knowledge of the complexity of their structures and environmental dependencies is fundamental to understanding their biological functions.[1] Among all the environmental interactions, solvation is one of the most important, since biological processes occur in an aqueous environment. Water molecules couple to protein structures and motions, enabling the proteins to perform their biological activities.
The water in biological systems has various functions, affecting or participating in the biological processes. Ordered water molecules accompanying the protein framework aid in the folding and stabilizing of the protein structure.[2] In membrane systems, the water helps transport other molecules.[3] In the reaction of hydrolyzing DNA and RNA by staphylococcal nuclease (SNase), water molecules are electron donors for the nucleophilic attack.[4] Water can also be a proton donor for biological reactions.[5] In studying all these phenomena, solvation dynamics is of great importance in understanding the interaction between solvated protein and water, and the corresponding dynamics.[6, 7] The essence of protein solvation dynamics is a localized response of polarized solvent molecules to proteins with static charge distribution in a non-equilibrium state. Through the adjustment of water molecule motions — including translation, vibration, rotation, exchange, etc. — the non-equilibrium charge distribution becomes equilibrious by coupled motion of protein and water molecules. This is also called hydration dynamics. By hydrogen bonding, or charge– dipole or dipole– dipole interactions, water molecules bond to proteins, forming solvated water at the protein molecules' surface, cavities, and internal sites. Because of these strong interactions, the water molecules' dynamics strongly relate to the local protein framework motion and residue characteristics, which is dramatically different from bulk water. Finally, the water participates in the protein' s function or drives the protein to fold and form stable structures.
The timing of protein dynamics ranges from the ultrafast time scale of chemical bond vibration to seconds for protein folding, while the events of protein solvation dynamics range from sub-picosecond to nanosecond. Ultrafast fluorescent spectroscopic techniques are fundamental for this study. Intrinsic or external fluorescent probes are applied to observe the ultrafast response of the protein toward femtosecond disturbing.[8] The internal conversion of these probes usually occurs in less than 100 fs, while their fluorescent lifetimes extend to nanoseconds. Therefore, these probes provide a suitable observation window for studying protein solvation dynamics.[9– 11] The intrinsic probe that is usually used is tryptophan (Trp or W), which has the most reddish emission band among the twenty amino acids. By mutagenesis, Trp can be inserted into the desired positions of a protein framework to study protein dynamics at a specified site. This approach is more versatile than applying external probes.
Solvated water can be roughly classified as either surface water or internal water, which have dramatically different dynamical behaviors. Surface water is also called bound water, since it interacts directly with surface residues and forms a hydration layer. In addition to the ∼ 100 fs and few-picosecond processes in bulk water, [10, 12] the bound water has two other processes of ∼ 1 ps and ∼ 100 ps, [13, 14] which correspond to two types of motions — vibrational and rotational motions of water molecules in the hydration layer, and translational and exchange motions between bound water and bulk water — together with the coupled adjustment motion of the protein framework.
The most systematic study of surface water hydration dynamics was carried out by Zhong’ s group.[15] They applied an ultrafast fluorescent up-conversion technique to investigate the surface of protein apo-myoglobin site by site. They found that the hydration dynamics at the protein surface are clearly different from those around the depth of the Trp probe. The dynamics are also affected by local properties of the protein for each site. Two emission peak shifts (Stokes shifts) are resolved as Δ E1 and Δ E2. The Δ E1 increases monotonically when the probes become closer to the protein surface. This means the probe is gradually sensing the whole hydration layer. When the probe becomes closer to the surface, it is exposed to a stronger polar environment. The Δ E2 does not show this monotonic increment. Instead, it increases to a fixed value when gradually reaching the surface. This limited and saturable shifting is due to the limited water molecule bonding to the protein surface. When the probe is buried deeply inside a protein molecule, it has a non-polar local environment with the shortest emission wavelength less than 330 nm. At intermediate depth, it shifts to 330– 340 nm. When the probe becomes close to the surface, it has an emission peak located at longer than 340 nm, but the dynamical emission shift remains ∼ 600 cm− 1 at this depth. Besides the two shifts, the two time scales for the shifts are also informative. They do not show a monotonic relation to the amplitude of the shifts. The first time scale of a few picoseconds, τ 1, represents the local motion of the water molecules, including vibration and rotation. Some sites with faster τ 1 (1– 2 ps) are surrounded by a flexible loop structure, where the water molecules are quite mobile. Slower τ 1 happens at sites with intensely charged/polar amino acid residues, where the water molecules are bound and cannot move so freely. The overall trend of τ 1 becomes faster when the emission spectra shift to red. In the slower time scale, τ 2 ∼ 100 ps, the water molecule network re-arranges in the hydration layer. Similar to τ 1, the time scale of τ 2 is sensitive to the rigidity of the protein framework. In high charge density sites, τ 2 is large. This study gives an overall dynamical picture for hydration water at the outer surface of a protein molecule.
The water inside protein molecules is also important for structural integrity and functionalities. These water molecules take various roles. In a polar cavity, the water adjusts the protein' s folding and stability, even the catalysis of the protein.[16] It has been proven, both in experiments and molecular dynamics simulation, that water molecules exist inside protein molecules, even inside the hydrophobic cores.[17– 21] Several techniques are applied in exploring this issue, including nuclear magnetic resonance (NMR), molecular dynamics simulation (MD), and time-resolved emission spectroscopy (TRES). Compared to the solvation dynamics at the protein surface, the dynamics of internal water are not yet well understood. Inside cavities with entrance at the protein surface, there are limited water molecules for hydration.[4, 22, 23] Some studies have concluded that their dynamic behaviors differ greatly from water molecules at the surface, due to the influence of the polarity of the cavity. The NMR studies show that their solvation takes place around a nanosecond.[17, 18] It is observed that the exchange of internal water is very slow, up to nano- or micro-second scale.[24, 25] However, others believed that the residence time is in a picosecond time scale.[26] Ultrafast spectroscopic study with fluorescence probes inside protein molecules indicated no slow process, but behavior similar to that of surface water.[15] Qin found that water motion in the binding pocket of polymerase-Dpo4 is a biphasic behavior of a few picoseconds to tens of picoseconds, similar to that of surface water.[26] Chang proposed that the local motion of water in different pockets during photolysis is a triphasic behavior — two fast motions from a few picoseconds to tens of picoseconds plus a sub-nanosecond motion.[6] The two fast ones are similar to those of surface water, while the slowest one may be related to the strong bonding in the cavity. However, this last process may not result from solvation, since the motion of water molecules inside a cavity is very constrained. In the study of a protein– precipitate system or a protein– DNA system, the probe at a protein molecule’ s surface is enclosed in a small space similar to a cavity. In this situation, no long decay component was found.[27] These results show that the dynamic properties of the coupling between internal water motion and protein folding and water’ s role in enzyme activity are unique. Direct optical observations of solvation dynamics are still limited, especially in the interior of a protein molecule. Only a few studies of the local dynamics of protein molecules' active regions, or their hydrophobic core, have been published.
2. SNase, tryptophan, and mutagenesis
SNase is a protein that is widely studied for protein folding, [28– 31] stability, [32, 33] dynamics, [34, 35] and catalysis activity.[36] SNase, which comes from staphylococcus aureus, is a small globular protein with a single chain and a single domain. Its molecular weight is 16800 kDa, with 149 amino acids, including one Trp residue at site 140. It has two subdomains, N-terminal and C-terminal, which contain five β -strands and three α -helixes, respectively. It non-specifically hydrolyzes single or double strand DNA and RNA, producing nucleoside 3’ -phosphates and 3’ -phosphooligonucleotides. Its active domain contains two pockets, a nucleotide binding pocket and a Ca2+ binding pocket.
Three native aromatic amino acids have fluorescence — phenylalanine (Phe), tyrosine (Tyr), and tryptophan (Trp). Trp has the largest extinction coefficient, a moderate fluorescent quantum yield, and the greatest red absorption.[37] It is very sensitive to variations in local polarity. Conformation change, substrate bonding, protein folding, etc. can affect its emission spectrum. Its indole ring is also a good electron donor, which can easily be quenched by any neighboring amino acid. Therefore, Trp is a suitable native fluorescent probe for studying proteins' structure and function.
The absorption band of Trp is at ∼ 280 nm, overlapping that of tyrosine. Pumping at 295 nm can avoid the overlap and excite only Trp. Deeply buried in a hydrophobic core, its emission has a shorted wavelength, e.g., Trp48 in azurin emits at 308 nm.[38] At a protein molecule’ s surface, where it is exposed to water, the emission maxima are close to 350 nm. Trp has two singlet excited states, 1La and 1Lb, whose dipole moments are nearly perpendicular to each other. In a non-polar solvent, 1Lb is the lower state, from which the main fluorescence comes. In an aqueous solution, 1La is lower, and almost all fluorescence is from 1La. The fluorescence decay may be affected by a neighboring amino acid, etc. Therefore, multiple decaying processes can be observed, which should be identified in solvation dynamics studies.[39]
To insert Trp into desired sites of SNase, protein mutagenesis is employed. The wild type (WT) SNase (PDB: 1SNO) has a single native Trp at position 140. First, we replaced this Trp in WT by histidine (H) to generate a single point mutant, W140H, which has good productivity and stability as a template for further modification. The target SNase has a single Trp residing inside the protein molecule, which replaces one original amino acid residue of the desired site to generate dual-point mutants. The selection of a Trp site has to avoid the quenching effect of an amino acid upon a carboxyl group, such as glutamic acid. So we designed twenty five mutated SNases with a single Trp in each. The sequences of all the mutants were confirmed before further purification. The mutants were expressed in Escherichia Coli BL-21(DE3) and purified by procedures described in Ref. [14]. The protein concentrations were determined by absorbance at 280 nm.[40]
All these double point mutants have a clear absorption structure at 290 nm, while the template, W140H, whose Trp is missing, has no strong absorption at this wavelength. W140H also shows no emission peak, unlike all the mutants, when excited at 295 nm.
3. Spectroscopic method and solvation correlation function
The solvation process can be observed by inspecting the spectra emitted from probes. The ultrafast time-resolved emission spectra can be obtained by fluorescent up-conversion at multiple wavelengths, with time resolution up to ∼ 100 fs, or even shorter. By employing a streak camera, recording both the temporal and spectral signals simultaneously, TRES can be recorded directly. However, its time resolution is limited to a picosecond timescale.
The transient fluorescent decay of Trp contains two typical processes. The first one is from solvent relaxation, which has two decays, a picosecond one and a hundred picoseconds one. The second is the native relaxation of Trp, called the lifetime decay, which may itself contain two processes, both at a nanosecond time scale:
 |
where i is the solvation process, while j is the contribution of lifetime. In the solvation process, at the blue side, ampi is positive, while at the red side, it is negative, indicating increasing intensity. The lifetime components are always positive in this case. Through deconvolution, we obtain the peak shift for reconstructing TRES, ν (t). Then, to obtain the time-resolved Stokes shift of only the solvation process, we need to remove the shift from the native decay that is related to lifetime
 |
Here, 
 |
This correlation function can be fitted by a dual-exponential function, which corresponds to spectral shifts Δ E1 and Δ E2.
4. Steady state spectroscopy of SNase mutants, and their structural integrity
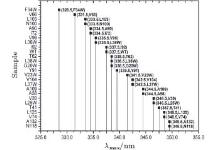
The fluorescence of Trp is widely used to reveal the local environment through the emission maxima λ max. It is widely believed that when λ max is shorter than 330 nm, the Trp is in the local hydrophobic state. When it is between 330 nm and 338 nm, the probe is partially exposed to the polar environment. When λ max is longer than 338 nm, the probe is thoroughly exposed to polar surroundings. Although we targeted internal sites of SNase, our mutants are partially exposed to an aqueous environment, and thus can be observed through fluorescent emission spectra, as shown in Fig. 1.
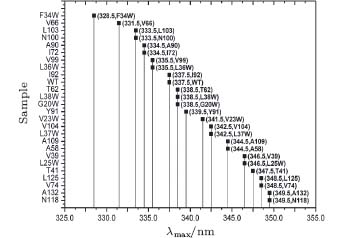 | Fig. 1. Fluorescent emission maxima of Trp in SNase mutants. |
F34W and V66W emit the most blue at 328 nm and 330 nm, respectively, indicating a strong hydrophobic local environment, while emission spectra of the others show gradual exposure to water. N118W has the most red emission at 350 nm, which means it is in a highly exposed position. WT SNase has an emission at 337 nm. Trp in this WT is on a loop structure and partially exposed to water.
The Trp has a hydrophobic residue, and is the largest of the twenty amino acids. So mutation with Trp may vary in conformation.[33, 41– 43] According to the emission spectra, the Trp of L36W should be deeply buried in the hydrophobic core of the β -barrel, similar to F34W. It should show similar blue emission when it is in such a hydrophobic environment, i.e., less than 330 nm. The study shows that it is at 334 nm, partially exposed to water, similar to WT. This case is also found for V23W, L25W, L37W, L38W, V39W, etc. However, most mutants keep an overall structure similar to WT. By checking the structural integration through various methods, we found that most of the mutants have a looser, but similar, structure to WT. The loosening is induced by the large residue of Trp, which becomes more or less exposed to the surrounding water. However, in our study of cavity hydration, the four selected mutants are in the correct spatial location, which will be discussed later.
We carefully chose thirteen double point mutants to study their structural integrity: G20W, V23W, L25W, F34W, L36W, L37W, L38W, V39W, T41W, V66W, N100W, L103W, and N118W. By checking the circular dichroism (CD) spectra, enzyme activity, and surface hydrophobicity by external probe (1-anilino-8-naphthalene sulfonate, ANS), we determined that all the mutants are looser in structure than WT, while their enzyme activities are kept at a certain level. This means that structural integrity is retained. Among the mutants, V23W, L25W, F34W, and L36W are somewhat looser than the others, being in a state that is usually called molten globule, while the others are in between native folding and molten globule.
When these mutants bond to substrates, their structures can be partially recovered. A substrate analog, pdTp, was applied in the study. Note that pdTp has a stronger affinity with the pockets of sites that are active toward DNA or RNA, so it is called an inhibitor. By detecting ANS fluorescence, all mutants except V39W and L103W present weakened hydrophobic environment after binding with pdTp, which means the interaction between protein molecules and the substrate, pdTp (or DNA/RNA), drives proteins to fold into a more WT-like form. After binding to pdTp, F34W, V66W, or N118W has a hydrophobic surface very similar to that of WT. This is also confirmed by CD spectra.
5. Internal solvation dynamics of SNase
Knowledge of internal solvation dynamics is fundamental to the understanding of the dynamic mechanisms of protein structure, recognition, and enzyme activity. The existence and localized motion of internal water maintains the structural integrity of proteins and helps to optimize the local spatial configuration for interacting with ligands or a substrate.[24, 44, 45] The internal water may also take part in catalysis, e.g., as a donor in nucleophilic attack for hydrolysis of DNA and RNA.[4] Therefore, investigating the solvation of protein molecules’ internal water is a way to understand protein dynamics. In this section, we will discuss the experimental details and results with regard to the internal cavity dynamics of SNase.
Picosecond TRES measurements of SNase were conducted using an optically triggered streak camera system (C5410, Hamamatsu). All of the samples were excited at 295 nm. Each sample was placed in a 1-mm thick transparent rotating cell. The polarization of fluorescence from the sample was selected by a Glan– Taylor prism at the magic angle (54.7° ) with respect to the polarization of the pump beam. To measure the anisotropy of fluorescence, the Glan-Taylor prism was rotated to be either parallel or perpendicular to the polarization axis of the pump beam to obtain the parallel (I| ) and perpendicular (I⊥ ) signals. These measurements were used to construct the time-resolved anisotropy: r(t) = (I| − I⊥ )/(I⊥ + 2I⊥ ). The energy of the 295 nm pump beam was below 1 nJ per pulse. The width of the instrument’ s response function is around 6 ps and 60 ps for two time windows (160 ps and 2200 ps, respectively). The final temporal resolution is around 3 ps upon deconvolution. The concentrations of all samples were 200 μ M in a dialysis buffer.
The lifetime measurements of Trp fluorescence were performed at room temperature with a spectrofluorometer (Edinburgh) at 370 nm. The time window and the peak counts are 100 ns and 2000 ns, respectively. The full width at half maximum of the instrument response function is ∼ 1.8 ns. The protein concentration is 50 μ M. The lifetimes were given directly by the software.
The steady-state fluorescence spectra were measured at room temperature. In this fluorescence study, the concentrations of the samples were 5 μ M in a dialysis buffer. Fluorescence was excited at 295 nm, and emissions were recorded between 300 nm and 450 nm.
We select four mutants, F34W, L36W, L38W, and T41W, as shown in Fig. 2, for the study of internal dynamics. The spectra of local environments of the Trp probes in F34W, L36W, and L38W display very weak and comparable polarity, while the spectrum of T41W shows an environment with stronger polarity. The lifetime and quantum yield of WT and the mutants are listed in Table 1. All mutants display reduced quantum yields toward WT. Neglecting the contribution of ultrafast solvent relaxation on the 1– 100 ps scale, all samples exhibit similar two-lifetime decays in nanoseconds, τ L1∼ 1.5– 3.2 ns and τ L2 ∼ 5.0– 6.8 ns. No ultrafast quenching process in sub-nanosecond exists.
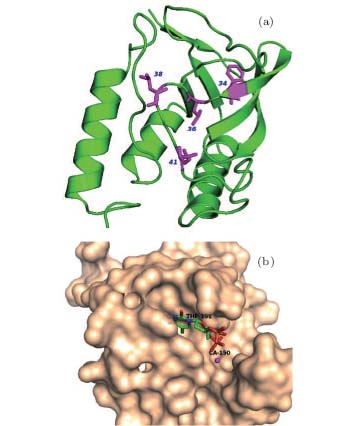 | Fig. 2. (a) X-ray of the crystal structure of SNase (PDB:1SNO). The positions where Trp is substituted are denoted by purple sticks, i.e., positions 34, 36, 38, and 41. (b) Active region of SNase, shown in surface mode, where the substrate analogue, pdTp, and ligand Ca2+ are inserted to demonstrate the two binding pockets, shown by sticks. |
| Table 1. Fluorescence quantum yield of mutants relative to WT and lifetime, where Q is the fluorescence quantum yield, τ L is the lifetime in nanoseconds, and B is the proportions of the lifetime, with B1 + B2= 1. |
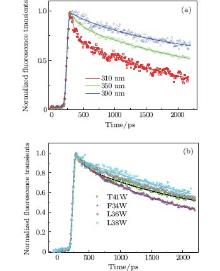
Figure 3(a) shows the picosecond-resolved fluorescence transients of T41W for three typical wavelengths from the blue to the red side of Trp emissions. All transients were taken within two time windows: 160 ps and 2200 ps. At the shorter time window of 160 ps, two ultrafast components, τ 1 and τ 2, in the range of several picoseconds and tens of picoseconds can be found, in addition to the two intrinsic lifetime components τ L1 and τ L2. Similar to recent reports, [9, 10, 27] this phenomenon is believed to be a manifestation of the local solvation dynamics of neighboring water molecules. These systematic studies indicate that the decay in a few picoseconds represents the local relaxation of the water network, while the decay in tens of picoseconds is the rearrangement of the water network, coupled with local protein fluctuations, transforming from a non-equilibrium configuration to an equilibrious state. The other three mutants exhibit similar temporal behaviors. Their variations are shown in Fig. 3(b).
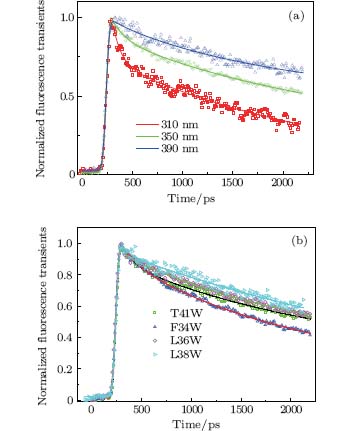 | Fig. 3. (a) Normalized picosecond-resolved fluorescence transients of T41W for three emission wavelengths: 310 nm, 350 nm, and 390 nm. (b) Normalized picosecond-resolved fluorescence transients of four mutants at 350 nm. Scattered dots are the original fluorescence transience data; and solid lines are the best-fit curves of the transients. |
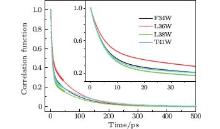
We fitted the time-resolved fluorescence spectra with a log-normal function to deduce the dynamic Stokes shifts ν s(t). The lifetime-associated emission contributions ν l(t) were obtained with a three-exponent fit to ν s(t) and extrapolation to time zero. Figure 4 shows the solvation correlated dynamical Stokes shift of the four mutants, c(t), which was constructed following Eq. (1). All solvation correlation functions can be fitted by a two-exponent decay, with two time constants τ 1(a few picoseconds) and τ 2 (tens of picoseconds). The results are shown in Table 2. For all mutants, the two time constants of solvation dynamics are within 10 ps and 110 ps, respectively, similar to the results probed by Trp at protein molecules’ surfaces and active regions, [14] revealing that water molecules in the binding pockets (or in a cavity) of SNase are not tightly trapped. The response from trapped water, as well as from the neighboring polar/charged residues, should be hundreds of picosecond to nanoseconds, as has been reported, [6, 46] describing the slow collective motions.
 | Fig. 4. Solvation correlation functions of the four mutants F34W, L36W, L38W, and T41W, shown in symbol and line. The inset shows the correlation functions within 40 ps. |
| Table 2. Results obtained from the hydration correlation functions C(t) of the four mutants of SNase. All of the solvation correlation functions are fitted with C(t)= C1exp(− t/τ 1) + C2exp(− t/τ 2), where C1+ C2= 1. The time constants are in picoseconds, Ei is the dynamic Stokes shift of the τ i component in cm− 1, and λ max represents the emission maximum in the steady state. |
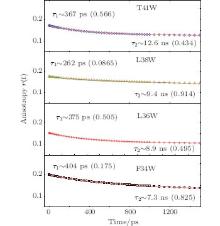
We also studied the picosecond-resolved rotational dynamics of Trp by probing the anisotropy, as shown in Fig. 5. We observed that all anisotropy dynamics are biphasic with a fast decay component in a hundred picosecond time scale and a slow component in a several nanosecond time scale. The nanosecond dynamics from 7.3 ns to 12.6 ns represents the whole protein molecule’ s tumbling motion. The picosecond dynamics from 262 ps to 404 ps results from local wobbling motions.[14] All of these findings suggest relatively small local fluctuations. The local structure around a Trp probe in the samples does not undergo large conformation changes in our measurements. The conclusion is indeed consistent with the results of the steady-state fluorescence emission maxima.
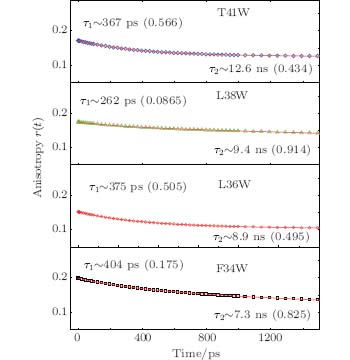 | Fig. 5. Picosecond-resolved anisotropy of Trp emission, together with a fitting using a two-exponential function. |
The time constants of solvation dynamics of the four mutants probed by Trp clearly reflect unique local dynamic properties in the interior of SNase. According to the crystal structure, Trp in F34W is deeply buried in the β -barrel with high hydrophobicity. This reveals the fastest time constants of solvation dynamics accompanied by the minimum corresponding energy relaxation. This indicates that the local environment has very weak polarity and low solvation, so the energy relaxation, which represents the extent of hydration, is small. This is similar to the dynamic properties of mutants W14, A15W, and H12W in Ref. [15]. Therefore, the dynamic results of F34W represent typical solvation features of an internal hydrophobic region. However, due to the presence of water in the hydrophobic cavity of a protein molecule, [47, 48] we cannot thoroughly remove the contribution of solvation relaxation from the measurements of a protein molecule' s surface and/or the nucleotide binding pocket of SNase. The probable internal water present in the hydrophobic cavities of SNase[44] may also contribute to the solvation relaxation, but it is supposed to be very weak because of the limited number of water molecules. For L36W, the side-chain of Trp stretches into the β -barrel and is deeply buried below the nucleotide binding pocket. L36W shows time constants and energy relaxation of solvation dynamics that are quite similar to those of F34W. The results of F34W and L36W are consistent with their steady-state fluorescence data and similar to the results in Ref. [15], verifying that the inside of a hydrophobic core should be only a little solvated.
For the nucleotide binding pocket, Trp in L38W lies at the bottom of the pocket, where the Trp probe is mainly surrounded by several hydrophobic and polar residues, such as Leu-37, Thr-113, and Thr-115. L38W has slower time constants but bigger Stokes shifts than F34W and L36W, τ 1 = 5.2 ps and τ 2 = 90 ps, with E1 = 196.7 cm− 1 and E2 = 115.5 cm− 1, as shown in Table 2. The first time constant τ 1 of L38W is quite similar to that of polymerase mutant S244W in the apo state, [27] revealing similar local dynamics and polarity of the nucleotide binding pocket for different enzymes. The solvation relaxation of L38W can be mainly assigned to the contribution from the hydrated water in the pocket. The slower time constants reveal moderate polarity at the bottom of the pocket, which confines the motion of the cavity water. For T41W, the probe is located at the bottom of the Ca2+ binding pocket. This pocket, surrounded by dense charged and polarized residues, including Asp-21, Asp-40, Thr-41, and Glu-43, is responsible for the hydrolysis of the phosphate backbone of DNA and RNA when Ca2+ is in the pocket. The high polarity distribution in this region results in the slowest time constants of solvation relaxation, τ 1 = 9.8 ps and τ 2 = 104 ps, with E1 = 258.3 cm− 1 and E2 =356.7 cm− 1, as shown in Table 2. The increases in solvation time constants and Stokes shifts relative to F34W, L36W, and L38W reveal that more confined water is present, including close probing of the water contained in the binding pocket and distant probing of the surface water.
The distinct differences in time constants of solvation relaxation between a nucleotide binding pocket and a Ca2+ binding pocket, as well as the hydrophobic core of SNase, clearly reveal characteristic dynamic features of different local structures. For a compact hydrophobic core (β -barrel), the biphasic behavior of solvation relaxation is similar to that in rigid regions, such as binding pockets, and in flexible regions, such as loop patches.[16] For the nucleotide binding pocket, [4, 49] the residues (Arg-35, Lys-84, Tyr-85, and Arg-87) and the water form the hydrogen-bond networks bind nucleotides at a perfect position. For L38W, the Trp probe detects the local dynamics of the pocket bottom, which is surrounded mainly by the two polar residues Tyr-113 and Tyr-115, and other nonpolar ones like Leu-37. (Tyr-113 and Tyr-115 in the nucleotide binding pocket may have π – π interactions with the adenine part of nucleotide to further regulate its binding.) Thus this region has moderate polarity and is solvated. Local water molecules are not confined tightly compared to that in the Ca2+ binding pocket, as observed in our results. Due to drastic structural transitions occurring upon Tyr-113 and Tyr-115 in the recognition and binding processes, [45] the moderate polarity and local dynamics must be crucial for the expelling of water and the binding of adenine. For the Ca2+ binding pocket, where some functional water molecules are present, the high polarity environment forms a relatively rigid hydrogen-bond network, including Asp-21, Asp-40, Thr-41, and Glu-43. This network is responsible for the hydrolysis of the phosphate backbone of DNA and RNA. Therefore, for the Ca2+ binding pocket, high polarity and relatively slow local dynamics at the bottom of the pocket are required to provide accurate and efficient nucleophilic attack.
6. Conclusion and outlook
The picosecond time-resolved solvation dynamics at internal sites and cavities of a protein molecule are reviewed here. We discuss the methods for studying protein dynamics with external and intrinsic probes. The external probe is versatile but cannot be site-directed. It may affect the local environment in ways that interfere with detection. The intrinsic probe is feasible for site-specific study and can be used for mapping the whole protein molecule. However, because of the size and hydrophobicity of Trp residue, it may affect the overall integrity of the protein, some trouble that should be carefully handled before further Trp-based studies. The solvation dynamics in the interior of SNase are successfully characterized using picosecond-resolved emission spectra of Trp as an intrinsic probe. The probes are buried at four internal sites. One is in the β -barrel, two sites are close to the bottom of the nucleotide binding pocket, and one is at the bottom of the Ca2+ binding pocket. For all selected sites, two robust TRES processes of the intrinsic Trp residue have been observed, occurring, respectively, in time scales of a few picoseconds and tens of picoseconds. The initial solvation relaxation, happening in a few picoseconds, is the fundamental relaxation of the local water network; the second solvation dynamic, occurring in tens of picoseconds, is the subsequent rearrangement of the water network, coupled with local protein fluctuations, from a non-equilibrium configuration to an equilibrious state. Trp probes at these sites show distinct differences in solvation time scale and energy relaxation. Solvation relaxation at the bottom of the Ca2+ binding pocket has the smallest dynamic time scale (τ 1∼ 10 ps, τ 2∼ 104 ps), accompanied by the largest energy changes. Solvation relaxation in the hydrophobic core (β -barrel) is the fastest (τ 1∼ 5 ps, τ 2∼ 80 ps), accompanied with the smallest energy changes. These distinct differences in time scale and energy change of solvation relaxation reflect diverse and characteristic dynamic features of different regions, which closely relate to protein stability and the recognition, binding, and hydrolysis with a substrate. The method of site-directed mutagenesis combined with ultrafast spectroscopy is a unique way to map and fully understand the fundamental physics of proteins.
The wild type (WT) SNase plasmid was generously provided by Prof. Bertrand Garcia-Moreno (Johns Hopkins University). We very much appreciate Dr. Lijuan Wang (Ohio State University) directing us in preparing all the mutants and setting up the biological lab.
Reference
| 1 |
|
| 2 |
|
| 3 |
|
| 4 |
|
| 5 |
|
| 6 |
|
| 7 |
|
| 8 |
|
| 9 |
|
| 10 |
|
| 11 |
|
| 12 |
|
| 13 |
|
| 14 |
|
| 15 |
|
| 16 |
|
| 17 |
|
| 18 |
|
| 19 |
|
| 20 |
|
| 21 |
|
| 22 |
|
| 23 |
|
| 24 |
|
| 25 |
|
| 26 |
|
| 27 |
|
| 28 |
|
| 29 |
|
| 30 |
|
| 31 |
|
| 32 |
|
| 33 |
|
| 34 |
|
| 35 |
|
| 36 |
|
| 37 |
|
| 38 |
|
| 39 |
|
| 40 |
|
| 41 |
|
| 42 |
|
| 43 |
|
| 44 |
|
| 45 |
|
| 46 |
|
| 47 |
|
| 48 |
|
| 49 |
|