


MnFe(PGe) compounds: Preparation, structural evolution, and magnetocaloric effects*
Cite this Article
Yue Ming, Zhang Hong-Guo, Liu Dan-Min, Zhang Jiu-Xing. MnFe(PGe) compounds: Preparation, structural evolution, and magnetocaloric effects* . Chinese Physics B, 2014, 24(1): 017505 
Permissions
MnFe(PGe) compounds: Preparation, structural evolution, and magnetocaloric effects*
Corresponding author. E-mail: yueming@bjut.edu.cn
Project supported by the National Natural Science Foundation of China (Grant Nos. 51171003, 51071007, and 51401002).
Abstract
The interdependences of preparation conditions, magnetic and crystal structures, and magnetocaloric effects (MCE) of the MnFePGe-based compounds are reviewed. Based upon those findings, a new method for the evaluation of the MCE in these compounds, based on differential scanning calorimetry (DSC), is proposed. The MnFePGe-based compounds are a group of magnetic refrigerants with giant magnetocaloric effect (GMCE), and as such, have drawn tremendous attention, especially due to their many advantages for practical applications. Structural evolution and phase transformation in the compounds as functions of temperature, pressure, and magnetic field are reported. Influences of preparation conditions upon the homogeneity of the compounds’ chemical composition and microstructure, both of which play a key role in the MCE and thermal hysteresis of the compounds, are introduced. Lastly, the origin of the “virgin effect” in the MnFePGe-based compounds is discussed.
Keyword:
75.20.En; 75.30.Sg; 75.50.Gg; MnFePGe-based compounds; magnetocaloric effect; structural evolution; thermal hysteresis; virgin effect
1. Introduction
Magnetic refrigeration (MR) is a new cooling technology based on the magnetocaloric effect (MCE), a physical phenomenon first reported by Warburg in 1881.[1] Up to now, different temperatures from below 1 K to near room temperature (RT) have been successfully achieved by using adiabatic demagnetization of various magnetic refrigerants. In 1933, Giauque et al.[2] obtained an ultralow temperature below 1 K by MR technology with Gd2(SO4)3· 8H2O as the working medium. Later in 1976, Brown[3] applied the same technology to RT refrigeration and reached 80 K below RT by using Gd as the refrigerant, opening an avenue to room temperature magnetic refrigeration (RTMR).
Currently, the main driving force for research and development of RTMR is the urgent need for energy efficient and environment-friendly cooling technology, eliminating the two major disadvantages of current vapor-compression refrigeration (VCR). The RTMR technology offers higher cooling efficiency than VCR does, and no environmentally harmful gases are used. Moreover, it also possesses other advantages such as small device size, low noise, and high stability. As a result, RTMR has drawn tremendous attention from both scientists and engineers as a promising cooling technology for practical applications. On the other hand, no proposed magnetocaloric material surpassed the entropy changes of Gd until the discovery of Gd5Si2Ge2 by Pecharsky et al.[6] in 1997. This compound undergoes a first-order structural transition in the vicinity of its Curie temperature (TC), leading to a giant MCE (GMCE) and therefore a larger entropy change than that of Gd metal. Since then, several new materials with GMCE such as La1– xCaxMnO3, [4] LaFe13– xSix, [5– 7] MnAs1– xSbx, [8] and MnFeP1– xAsx[9, 10] have been developed. These important discoveries led to a rapid acceleration of research on RTMR.
In 2002, Tegus et al.[12] reported GMCE in MnFeP1– xAsx compounds, with tunable TC via changing the P/As ratio. In subsequent research, it was found that the GMCE can be maintained quite well in similar MnFe(P, Ge) compounds, in which the toxic element has been replaced by Ge for safety of practical applications.[11– 13] However, the new MnFe(P, Ge) compounds presented some undesirable behaviors such as the anomalous “ virgin effect” and a large thermal hysteresis. Fortunately, intensive investigation on the crystal/magnetic structure and phase transformation of the compounds have shed more light on the mechanism of these unexpected behaviors, and some effective strategies have been proposed to improve the MCE as well as to minimize the thermal hysteresis. Moreover, several methods have been developed for the proper evaluation of the MCE in these compounds based on new understanding of the simultaneous structural and magnetic phase transitions of the compounds.
In the present paper, we give a brief review of the recent advances in MnFe(PGe) compounds, based mainly on our recent progress in the preparation, structure evolution, and magnetocaloric effects of these compounds. In Section 2, we discuss the preparation of the MnFe(PGe) compounds using spark plasma sintering (SPS) technology. Section 3 is devoted to an overview of the temperature, magnetic field, and pressure dependence of the crystal and magnetic structural evolution, as well as phase transformation, determined from neutron powder diffraction (NPD) investigations. Section 4 describes an easy and reliable method for evaluating the MCE of the compounds via differential scanning calorimetry (DSC). Section 5 deals with the “ virgin effect” behavior in MnFe(PGe) compounds and its origin, based on magnetic measurements and NPD study. In Section 6, we end the review with a brief summary.
2. Preparation of MnFe(PGe) compounds
In all previous work, the MnFe(PGe) compounds were prepared either by a mechanically activated solid-diffusion method[12, 14] or by a melt-spinning method.[15] However, both methods require a long processing time and frequently involve the formation of undesirable intermetallic ferromagnetic impurities in the compound. Such disadvantages potentially prevent practical application of the compounds.
The SPS is an advanced consolidation technique that can produce materials under non-equilibrium conditions.[16] One of the important advantages of the SPS technique is the plasma-aided sintering mechanism, which effectively shortens the diffusion paths to facilitate phase formation and homogenization of the compound. In addition, the high sintering speed of SPS can restrain phase separation and allow consolidation of the compounds in a very short time. In our work, the SPS has been applied to prepare bulk MnFe(PGe) compounds.
Yue et al.[17] reported preparation of Mn1.1Fe0.9P0.8Ge0.2 compound by simple blending and subsequent SPS. The high-purity starting materials, Mn powders, Fe powders, Ge chips, and red P powders, were manually blended under an Ar atmosphere in a glove box. The as-blended powders were then collected into a carbon mold and quickly consolidated into a cylindrical sample at 1193 K under 30 MPa by the SPS technique. The density of the sample was found by the Archimedes method to be over 95% of the density of an as-cast ingot with the same composition. Figure 1(a) shows the observed and calculated X-ray diffraction (XRD) patterns for the Mn1.1Fe0.9P0.8Ge0.2 compound. Apart from the Fe2P type main phase, a minor impurity phase of MnO is found, which according to the refinement results, is less than 2 wt.%. This phase probably originates either from the starting materials or from the oxidation of Mn during the preparation process. It is worth mentioning that some ferromagnetic secondary phases such as (Mn, Fe)5Ge3, which persists in conventionally sintered and cast samples even after long-duration annealing, [12, 14, 15] are not present in the latest bulk sample prepared by the SPS technique. Magnetic measurement indicates that the TC of the compound is 253 K and the thermal hysteresis is 15 K. In addition, the compounds’ maximum magnetic entropy change is 49.2 J/kg· K during a magnetic field change from 0 to 5 T at 253 K, which is superior to previous findings.[12, 15]
 | Fig. 1. XRD patterns of bulk Mn1.1Fe0.9P0.8Ge0.2 alloy prepared through (a) manually blending and (b) high energy ball milling, respectively. The bottom curve is the difference between the observed and calculated intensities. The black and red rows of vertical bars indicate the Bragg reflection positions of MnFePGe and MnO compounds, respectively.[17, 18] |
To improve the reaction efficiency among the elemental powders, a high energy ball milling process was added into the process before SPS.[18] In detail, the mixed elemental powders were ball milled under an argon atmosphere for 1.5 h prior to SPS. From Fig. 1(b) one can see that the final Mn1.1Fe0.9P0.8Ge0.2 sample is also composed of the main Fe2P type phase and a minor impurity phase of MnO. Most importantly, the magnetic measurements show that the new sample exhibits a remarkable 25% enhancement of the maximum magnetic entropy change (61.8 J/kg· K) compared to the sample without ball milling under the same 5 T field change. Meanwhile, it is found that the thermal hysteresis of the new sample is 10 K higher. Clearly, the ball milling process plays an important role in modifying the MCE of the MnFe(PGe) compounds.
Further investigations with the NPD technique reveal that the chemical homogeneity and grain size of the MnFe(PGe) compounds can substantially influence their MCE.[19] Therefore, a heat treatment process was added after the SPS step.[20] In detail, the as-sintered samples were solution-treated at 950 ° C for 15 h, followed by annealing at 800, 850, 900, and 950 ° C for 48 h, respectively, after which they were quenched in ice water. Figure 2 shows the magnetic entropy change of as-sintered (curves “ a” ) and annealed (curves “ b” ) for Mn1.1Fe0.9P0.8Ge0.2 samples in a field change of 0– 3 T. The annealed sample has a higher TC and a better magnetic entropy change than the as-sintered sample. Moreover, the thermal hysteresis is reduced from 15 K for the as-sintered sample to 9 K for the annealed sample, indicating the important influence of proper preparation on the magneto-caloric properties of the MnFe(PGe) compounds.
 | Fig. 2. Temperature dependence of the magnetic entropy change of bulk Mn1.1Fe0.9P0.8Ge0.2 alloys, before (a) and after (b) annealing, measured in a magnetic field change from 0 to 1, 2, and 3 T.[20] |
3. Structure and phase transformation of MnFe(PGe) compounds
3.1. Crystal and magnetic structures of MnFe(PGe) compounds
Liu et al.[21] described the crystal and magnetic structures of Mn1.1Fe0.9P0.8Ge0.2 as investigated by the NPD technique. The compound with the Fe2P-type hexagonal structure (space group P6
| Table 1. Structural parameters of Mn1.1Fe0.9P0.8Ge0.2 at 295 and 10 K. Space group P6 |
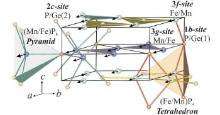
 | Fig. 3. Crystal structure and magnetic structure of Mn1.1Fe0.9P0.8Ge0.2 alloy.[19] |
The magnetic structure of Mn1.1Fe0.9P0.8Ge0.2 compound has been determined to have a P11m magnetic space group, in which Mn and Fe moments are parallel to each other in the a– b plane. This differs from the MnFePAs compounds, in which the moments lie in the a– c plane or along the c axis.[22] The refined moments for Mn atoms on the 3g sites and Fe/Mn atoms on the 3f sites at 245 K are 2.9 μ B and 0.9 μ B, respectively. These measurements are similar to those of other compounds with the Fe2P-type structure, where the atoms in the 3g site have larger moments than those in the 3f sites.[14, 22] From Table 2, it can be seen that the interatomic distances between Fe/Mn atoms and the surrounding P/Ge atoms in the pyramidal and tetrahedral coordination are very different, which strongly affects the bond strength between them, and thus induces different magnetic moments.
| Table 2. Selected interatomic distances (Å ) at 295 and 10 K.[21] |
3.2. Crystal structure evolution during the phase transition in MnFe(PGe) compounds
As indicated in Table 1, during the temperature-induced paramagnetic (PM) ↔ ferromagnetic (FM) phase transition in Mn1.1Fe0.9P0.8Ge0.2 compound, the c axis of the crystal lattice is shortened, while the ab plane is expanded. Moreover, more specific and unexpected bonding characteristics of this material during the phase transition have been discovered by a detailed inspection of the structural variation.[21, 23]
Figure 4(a) shows the temperature variations in the lattice parameters for the PMP and FMP of Mn1.1Fe0.9P0.8Ge0.2. At the transition, the a-axis lattice parameter increases and the c-axis lattice parameter decreases abruptly. However, aside from those sharp changes at the phase transition, there is little variation with temperature. The temperature dependence of the relevant metal– metal bond distances in or between the neighboring layers is shown in Fig. 4(b). During the transition from PMP to FMP, the intralayer metal-metal bond distances increase significantly, while the interlayer distances either remain almost constant or decrease slightly, indicating that the shortening of the caxis is mainly due to the decrease in the P/Ge(1)– Fe/Mn– P/Ge(1) angle.
 | Fig. 4. Variation in lattice parameters (a) and the metal– metal bond distances (b) as functions of temperature. The changes occurring at the transition are indicated by the arrows.[21] |
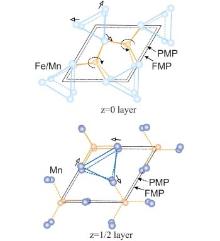
Figure 5 shows the relative atomic positions in the a– b plane in the PMP and FMP, and the atomic shifts between the two phases are indicated by the arrows. On the z = 0 layer, rotations of the P/Ge(2) atoms result in a substantial increase of Fe/Mn– Fe/Mn distances and Fe/Mn– P/Ge(2) distances. On the z = 1/2 layer, the same behavior occurs for the Mn– Mn distances, with only a slight variation in the Mn– P/Ge(1) separations. We can conclude that the triangular framework of magnetic atoms is most affected during the phase transition, revealing that the structural and magnetic transitions are tightly connected to each other, and hence any modulation of interatomic distances will directly affect the transition temperature and thus the MCE properties.
 | Fig. 5. Projections along the c axis of the atomic arrangement in the z = 0 and z = 1/2 layers of the structure. The atomic shifts and the rotations about the P/Ge atoms taking place at the transition are indicated by the arrows. The outlines of the unit cell and the bonds between the atoms are shown by continuous and broken lines for the FMP and PMP, respectively.[21] |
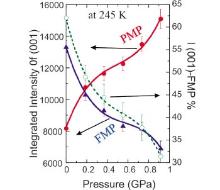
According to the structural variation during the phase transition, one can easily imagine the structural evolution during the phase transition under a certain pressure, since expansion of the crystal lattice will be preferred in the formation of the FMP. Conversely, the application of pressure should inhibit the formation of the FM phase and thus decrease the TC. This is the situation that was observed by Liu et al.[21] when they applied pressure up to 1 GPa on the sample. As shown in Fig. 6, at 245 K, the phase fraction of PMP continuously increases while that of FMP reduces correspondingly when the applied pressure is increased from 0 to 0.92 GPa.
 | Fig. 6. Integrated intensities for the PM and FM reflections as functions of pressure. The (green) broken line shows the relative intensities of the two peaks.[21] |
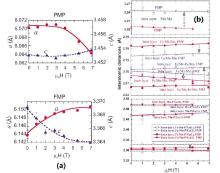
Figure 7(a) shows the magnetic field variations in the lattice parameters for the PMP and FMP of Mn1.1Fe0.9P0.8Ge0.2 compound. As the field strength increases, the a-axis lattice parameter increases and the c-axis lattice parameter simultaneously decreases in FMP. In contrast, the lattice parameters in PMP show an opposite variation, indicating that its chemical composition differs from that of FMP. The magnetic field dependence of the relevant metal– metal bond distances in or between the neighboring layers is shown in Fig. 7(b). From the PMP to the FMP, the variation in the metal– metal distances is positive and large for the intralayer bonds, and rather small and negative in the case of the interlayer bonds. Note that all the distances remain remarkably constant when the magnetic field is varied, indicating that the crystal and magnetic structures of the PMP and FMP do not change markedly during the transition. Moreover, variations of lattice parameters with decreasing temperature or increasing field are similar, revealing that the effect of temperature on the nature of the transition is basically equivalent to that of an applied magnetic field.
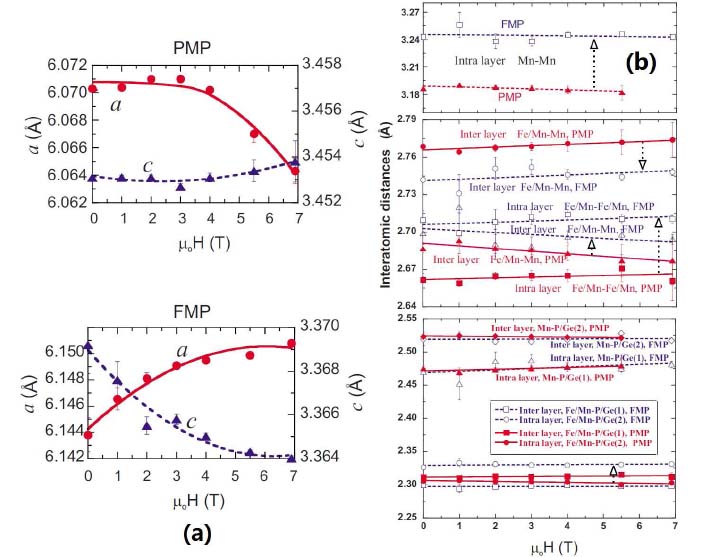 | Fig. 7. (a) Magnetic field variations in the lattice parameters for the PMP and FMP of Mn1.1Fe0.9P0.8Ge0.2 compound. (b) Bond distances at 255 K as a function of applied magnetic field.[21] |
3.3. Correlation between phase transition and MCE in MnFe(PGe) compounds
The NPD experiments provide a unique and important phenomenon of this material: the magnetic field or temperature induced magnetic-entropy change is directly controlled by the fraction of FMP during the first-order transition. The refined phase fraction determined from the NPD data reveals that the FM– PM transition is almost fully accomplished when the temperature increases and surpasses 255 K, as shown in Fig. 8(a). However, during the PM– FM transition, about 4.5% of the sample will always remain in the PM state until the temperature decreases to below 10 K. A similar situation develops during the first-order structural transition driven by an external magnetic field, as shown in Fig. 8(b); only 70% of PMP was converted into FMP in a field of 5 T. Liuet al.[19] normalized the magnetic entropy change (Δ Sm) to the magnetization, [001]-FM intensity and the fraction of FM phase, as shown in Figs. 8(c) and 8(d). The excellent agreement between these parameters and the linear relationship between Δ Sm and the FM-phase fraction strongly suggest that the FM-phase fraction is directly connected to the magnetocaloric effect of the compound.
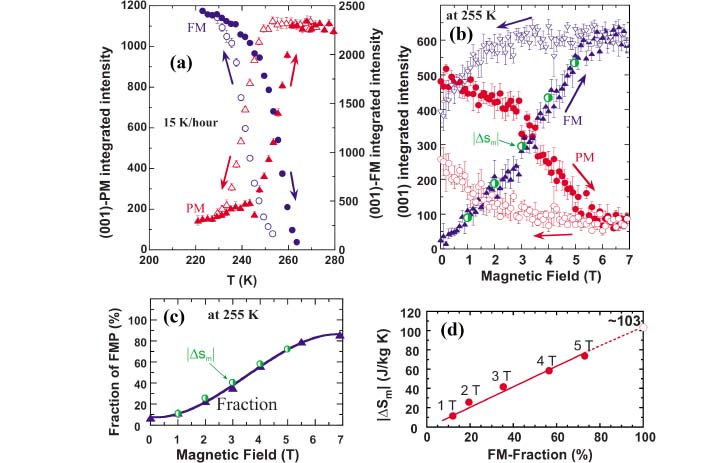 | Fig. 8. (a) Integrated intensities of the (001) reflections for the PM and FM phases as functions of temperature, upon cooling and warming. (b) Field dependence of the integrated intensities of the (001) reflections for the PM and FM phases at 255 K. For comparison, data normalized from the magnetic-entropy change |Δ Sm| are also shown. (c) Fraction of the ferromagnetic phase (FMP) at 255 K as the field increases. Data normalized from |Δ Sm| are shown for comparison. (d) |Δ Sm| as a function of the ferromagnetic phase fraction.[19] |
4. Evaluation of the MCE of MnFe(PGe) compounds
The magnetic entropy change (Δ Sm) is the key parameter to evaluate the MCE of magnetic refrigerant materials. A popular way to obtain Δ Sm is from isothermal magnetization curves with either the Maxwell[24] or Clausius– Clapeyron relation.[25] However, the applicability of this method to first-order magnetic transitions is under debate.[8, 26– 28] Another way is to extract Δ Sm from heat capacity measurements under different magnetic fields. However, the conventional methods of measuring heat capacity are time consuming and not suitable for materials with first order transitions, since a heat input does not necessarily lead to a temperature modification in the sample due to the latent heat. It is therefore necessary to explore new methods for evaluating MCE of the magnetocaloric materials with first order magnetic transitions.
A reliable method to observe entropy change (Δ S) is differential scanning calorimetry (DSC), which measures the heat flux, while the temperature of the calorimeter is continuously changed, and with proper integration of the calibrated signal, the latent heat of the transition can be obtained. The DSC is particularly well suited to the case of first-order phase transitions since it yields both the latent heat and the entropy changes associated with the transitions. Moreover, the DSC measurements directly provide both the magnetic and the structural contributions to Δ S.[29]
The results discussed in Section 3 suggest that the effect of temperature on the nature of the transition is basically equivalent to that of an applied magnetic field, demonstrating that DSC measurements are ideal for studying the MCE of magnetocaloric materials. To clarify the relationship between Δ Sm obtained from magnetic measurements and Δ S derived from DSC measurements, Yue et al.[29] investigated the structural evolution, magnetic transition, as well as the MCE of Mn1.1Fe0.9P0.76Ge0.24.
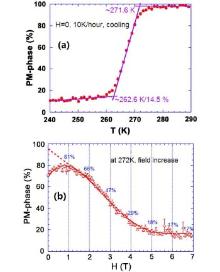
Figure 9(a) shows the PMP fraction as a function of temperature during the magnetic transition in Mn1.1Fe0.9P0.76Ge0.24. The compound is in the fully PM state above 272 K, and below this point the PMP and FMP coexist. It is found that 85.5% of the sample transforms quickly between 272 and 263 K, but the rest of the sample remains in the PM state and slowly transforms into the FM state with decreasing temperature. Figure 9(b) shows the PMP fraction as a function of the magnetic field at 272 K. It is observed that most of the PMP transforms into the FMP between 1.4 and 4.1 T, and the transition is not completed even when the field strength reaches 7 T, with 17% of the sample remaining in the PM state. Note that the behaviors of the transitions with changing temperature and with changing magnetic field are quite similar to each other.
 | Fig. 9. (a) PM phase fraction as a function of temperature; (b) PM phase fraction as a function of magnetic field.[29] |
To clarify the evolution of crystal structure and magnetic structure of the PMP and FMP in the Mn1.1Fe0.9P0.76Ge0.24 compound during the transition process, the structural parameters as well as the magnetic moments of the compound at four temperature-field values, 267 K/0 T, 259 K/0 T, 271 K/3 T, and 271 K/6.9 T, were investigated. It is interesting to find that the phase fractions, lattice parameters, atomic occupancy factors, bond distances and angles, and magnetic moments of the FMP in the compound at 259 K/0 T and 271 K/3 T are almost the same for both phases, within uncertainties, as shown in Table 3. However, if the magnetic field increases to 6.9 T at 271 K, the magnetic moments increase by 15%. It is therefore concluded that the magnetic and structural transitions in the Mn1.1Fe0.9P0.76Ge0.24 compound induced by temperature are almost identical to the transitions induced by the application of a magnetic field. In this situation, it is expected that the entropy changes are also approximately the same in the two cases.
| Table 3. Structural parameters and magnetic moments of FMP in Mn1.1Fe0.9P0.76Ge0.24 compound at 259 K/0 T and 271 K/3 T.[29] |
Figure 10 shows the temperature dependence of the entropy upon cooling and warming. The transition started at 271 K and ended at 261 K under cooling, and started at 273 K and ended at 283 K under warming, exhibiting a thermal hysteresis of ∼ 11 K. The average integrated entropy changes from 240 K to 300 K upon cooling and from 261 K to 300 K upon warming are 33.81 and 30.76 J/kg· K, respectively. Note that only 81.7% of the PMP was converted into FMP at 259 K, and there is still 4% MnO impurity in the sample. Hence the average entropy changes as high as 43 J/kg· K can be achieved if the phase transformation goes to completion in a pure sample.
 | Fig. 10. PM-FM phase transformation entropy of Mn1.1Fe0.9P0.76Ge0.24 as a function of temperature calculated from DSC data, at rates of 1 K/min or 5 K/min. (a) Cooling, with Δ S = 33.8J/Kg· K, and (b) warming, with Δ S = 30.8J/Kg· K.[29] |
Figure 11 shows the temperature dependence of the Δ Sm in the Mn1.1Fe0.9P0.76Ge0.24 compound, obtained using magnetization curves and the Maxwell relation. As shown in the figure, the measurements were made via four modes: (i) increasing temperature-increasing field; (ii) increasing temperature-decreasing field; (iii) decreasing temperature-increasing field; (iv) decreasing temperature-decreasing field. The results from the four types of measurements give similar values of Δ Sm. Note that the four types of measurement result from different magnetic transition processes in the compound, so an average of 46.5 J/kgK for Δ Sm corresponding to a 5-T field change is obtained. Allowing for the presence of the impurity phase and for the phase fraction, a maximum value of 58.1 J/kgK for the compound is expected.
 | Fig. 11. Temperature dependence of the magnetic entropy change in bulk Mn1.1Fe0.9P0.76Ge0.24 as a function of magnetic field up to 5 T, determined using the Maxwell relation. The steps of temperature and magnetic field used in the measurements were 1 K and 0.1 T.[29] |
It is easy to find that the Δ Sm value via magnetic measurement is substantially larger than the measured Δ S obtained directly from the DSC technique. However, based on the above investigation of the lattice parameters and magnetic moments of the Mn1.1Fe0.9P0.76Ge0.24 compound at different temperature/field situations, we may need to use an average Δ Sm value for fields from 0 to 3 T instead, which is more or less equal to the Δ S from DSC measurements. It is therefore concluded that detailed comparisons are reliable only when using the DSC technique on well characterized samples for which the structures and phase fractions are known.
5. Origin of virgin effect in MnFe(PGe) compounds
The “ virgin effect” is a phenomenon first observed about ten years ago in Fe2P-type Mn2– yFeyP1– xTx (T = As, Ge, and Si) compounds.[14, 30, 31] Further investigations showed that this phenomenon also occurs in other Mn-based compounds such as MnAs.[32] A typical “ virgin effect” in the Mn1.1Fe0.9P0.8Ge0.2 compound is shown in Fig. 12. The as-prepared sample shows a significantly lower transition temperature on first cooling than after it has undergone thermal cycling down to 50 K.[30] In detail, with decreasing temperature, a PM– FM transition starts at about 200 K for the as-prepared sample and ends at about 100 K. These results imply that this magnetic transition may co-occur with a structural change and may need a very large overcooling as a driving force. After it has undergone thermal cycling to 20 K, the FM– PM transition will be completed at about 240 K during the subsequent warming process. For the second thermal cycle, the PM– FM transition starts at about 230 K during the cooling process, while FM– PM transition ends at 240 K during the heating process. Further thermal cycles have no effect on TC.
 | Fig. 12. Temperature dependence of magnetization, MT, for Mn1.1Fe0.9P0.8Ge0.2 under a magnetic field of 10 mT.[30] |
Though experimental results show that the virgin effect happens only during the first several thermal cycles and has no influence on the MCE performance of the materials, it is still important to explore its origin and its relation to the magnetostructural change during the first-order phase transition. Based on some neutron diffraction observations of MnFePSi compounds, the virgin effect is thought to be related to the intrinsic strain effect in the samples, which was proven to not be very regular in a recent study.[31]
Liu et al. studied the virgin effect in Mn1.1Fe0.9P0.8Ge0.2 by the NPD and first-principles calculations.[33] First, they found from the refined NPD data that there is an irreversible structural change during the first thermal cycle, i.e., a structural relaxation accompanying the magnetostructural transition. According to their conclusion, since the sample is prepared via non-equilibrium processes like ball milling and SPS, there will be many metastable distorted structural units with random distribution of P/Ge atoms on both 1b and 2c sites. Due to the atomic size difference between Ge and P, the Fe-centered tetrahedron and Mn-centered pyramid will be distorted and cause local fluctuations of the interatomic distances and thus to the magnetic properties.
To prove this point, the interatomic exchange coupling PMP for the FMP of the material has been determined. It turns out that the magnetic exchange interaction is highly sensitive to the interatomic distances between magnetic atoms (Fe, Mn). The existence of structural distortion results in the local fluctuation of the inter-atomic distances and the related magnetic exchange interactions. Therefore, one can deduce that during the first cooling, the local fluctuations of the magnetic exchange interaction hinder the structural change around TC. Once the transition is accomplished, however, the structure will have the opportunity to relax to a more stable configuration under the driving force of magnetic exchange interactions. When the temperature warms up, the atoms are not necessarily restored into their initial atomic positions and thus cause the observed significant increase of the TC. Further thermal cycles will not be affected by this effect because most of the structural relaxations have been completed during the first thermal cycle.
6. Summary
We prepared MnFe(PGe)-based compounds by using ball milling, SPS, and annealing successively. Structure evolution and phase transformation in the compounds as functions of temperature, pressure, and magnetic field are reported. In this paper, correlations among preparation conditions, magnetic and crystal structures, and magnetocaloric effects (MCE) of the MnFePGe-based compounds are reviewed.
Due to the unique sintering mechanism, the spark plasma sintering technique is an effective way to prepare Fe2P-type MnFe(PGe)-based compounds with high purity. To achieve homogeneity of the chemical composition and microstructure in the compounds, a subsequent annealing process is necessary.
The crystal structure and magnetic structure of the Mn1.1Fe0.9P0.8Ge0.2 compound have been determined as Fe2P-type hexagonal structure (space group of P62m) and P11m magnetic space group, respectively. The PMP-FMP structural and magnetic transitions can be facilitated by temperature, pressure, and magnetic field via modulation of interatomic distances in the compounds. Moreover, the FMP fraction in the compounds during PMP-FMP transition is directly connected to the MCE of the compounds.
Reliable measurements of entropy change and other important thermodynamic properties associated with the transitions can be obtained through DSC measurements. An effective and easy way to evaluate the MCE of the compounds is presented, combining DSC with the structural and magnetic properties of the MnFe(PGe)-based compounds.
The “ virgin effect” , an irreversible structural change in MnFe(PGe)-based compounds, results from the structural relaxation of metastable structural distortions in the as-prepared state upon thermal cycling. This behavior originates from the interplay between structural distortion and interatomic exchange interactions.
Reference
| 1 |
|
| 2 |
|
| 3 |
|
| 4 |
|
| 5 |
|
| 6 |
|
| 7 |
|
| 8 |
|
| 9 |
|
| 10 |
|
| 11 |
|
| 12 |
|
| 13 |
|
| 14 |
|
| 15 |
|
| 16 |
|
| 17 |
|
| 18 |
|
| 19 |
|
| 20 |
|
| 21 |
|
| 22 |
|
| 23 |
|
| 24 |
|
| 25 |
|
| 26 |
|
| 27 |
|
| 28 |
|
| 29 |
|
| 30 |
|
| 31 |
|
| 32 |
|
| 33 |
|