Field-dependent resistive transitions in YBa2Cu3O7− δ thin films: Influence of the pseudogap on vortex dynamics
Cite this Article
Naqib S H, Islam R S. Field-dependent resistive transitions in YBa2Cu3O7− δ thin films: Influence of the pseudogap on vortex dynamics . Chinese Physics B, 2014, 24(1): 017402 
Permissions
Field-dependent resistive transitions in YBa2Cu3O7− δ thin films: Influence of the pseudogap on vortex dynamics
Corresponding author. E-mail: salehnaqib@yahoo.com
Abstract
The nature of resistive transition of high-quality crystalline thin films of YBa2Cu3O7− δ has been studied under magnetic fields ( H) applied along the c direction over a wide range of doped holes, p in the CuO2 planes. The field- and temperature-dependent in-plane resistivity, ρ ab( T, H), has been analyzed within the thermally assisted flux-flow (TAFF) formalism. The flux activation energy, U( T, H), has been extracted from this analysis. The low- T part of the ρ ab( T, H) data can be described by an activation energy having the functional form of U( T, H) = (1- t) m( H0/ H)− β, where t= T/ Tc (reduced temperature), and H0 is a field scale that primarily determines the magnitude of U( T, H). The temperature exponent, m, shows a systematic variation with p, whereas the field exponent, β , is insensitive to the p values and is close to unity. The H0, on the other hand, changes rapidly as p is varied. U( T, H) is linked to the pinning potential and consequently on the superconducting condensation energy. Since the normal state pseudogap directly affects superconducting condensation energy, a clear correspondence between H0 and the PG energy scale, ɛ g, is found. Possible implications of these results are discussed.
Keyword:
74.25.Uv; 74.62.Dh; 74.72.Ek; 74.25.Dw; Y123 superconductors; thermally assisted flux-flow model; activation energy; pseudogap
1. Introduction
Right after its discovery, the peculiar nature of the broadening of the resistive transition under applied magnetic fields in high-Tc cuprates has attracted significant attention.[1– 4] The phenomenon is particularly interesting because of its link to magnetic vortex dynamics. The mechanism of pinning and the motion of the flux lines are the most important fields of applied superconductivity research since they determine the magnitude as well as the temperature and field dependences of the critical current density. Various theoretical interpretations exist, but the experimentally observed behavior of the temperature- and field-dependent resistivity, ρ (T, H), in the vicinity of superconducting transition are still not entirely well understood. Complications arise because of the electronic and structural anisotropy, low superfluid density, small coherence volume, and high thermal energy associated with high Tc itself, in all the families of hole-doped cuprates. These features enhance the role of pairing fluctuations and at the same time weaken the flux pinning properties. Generally, over a certain range of temperature, sufficiently below the mean field Tc (≡ Tp in this paper), the resistive features are modeled using the thermally assisted flux flow (TAFF) formalism.[1– 10] This is the regime where the unpinned vortex-liquid exhibits viscous (dissipative) flow.
As far as the potential for future large-scale applications are concerned, YBa2Cu3O7− δ (Y123) remains the most promising system because of its high irreversibility field, low structural anisotropy, and relatively higher superfluid density, which results in large intrinsic depairing critical current density. The normal and superconducting (SC) state properties of all the cuprates depend strongly on the number of doped holes in the CuO2 plane. Previously, we have shown that the in-plane critical current density is primarily governed by the depairing contribution, and therefore shows the same qualitative trend as shown by the p-dependent superfluid density and condensation energy.[11, 12] We have also detected a crossover in the temperature dependence of the critical current density in the underdoped (UD) Y123, where depinning contribution starts to contribute.[13, 14] To obtain a comprehensive picture, we have undertaken this project to investigate the temperature and field dependences of the activation energy, U(T, H), as a function of hole content in high-quality c-axis oriented thin films of Y123. It is rather surprising that even though a number of works on U(T, H) already exist for Y123 and related systems, [1– 10, 15– 17] most of these studies were performed at a single sample composition, or by considering the role of sample anisotropy alone. So far, no systematic study has been done on the nature of the p dependence of U(T, H) in Y123 explicitly, to the best of our knowledge. From the detailed analysis of the in-plane resistivity ρ ab(T, H), we have found that the dimensionless activation energy can be expressed as U(T, H) = (1− t)m(H0/H)− β , irrespective of the hole content. Here t = T/Tp is the reduced temperature and H0 is a characteristic field scale. Tp is the mean-field SC transition temperature. The value of the temperature exponent m depends on the hole content, whereas β is insensitive to the p values and is close to unity. H0, on the other hand, decreases rapidly as the hole concentration is reduced.
Previous studies on vortex dynamics have considered the role of the pseudogap (PG) on the magnitudes of the critical current density and the irreversibility field.[12, 18] Here, we find that the PG energy scale, extracted from the ρ (T, p) data, exhibits a clear correspondence with the doping dependent values of H0. We discuss the implications of this result and other findings in the concluding section of this paper.
2. Sample preparation and characterization
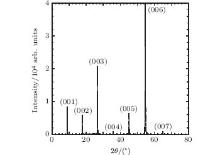
Crystalline c-axis oriented thin films of YBa2Cu3O7− δ were synthesized from high-density single-phase sintered targets using the method of pulsed laser deposition (PLD). Thin films were grown on (001) SrTiO3 single crystal substrates at a deposition temperature of 780° C under an oxygen partial pressure of 0.95 mbar. Samples were characterized by using x-ray diffraction (XRD), atomic force microscopy (AFM), ab-plane room-temperature thermopower, Sab[290 K], and ρ ab(T) measurements. XRD was used to determine the structural parameters, phase purity, and degree of c-axis orientation (from the rocking-curve analysis). The AFM was employed to study the grain size and the thickness of the films. All the films used in the present study were phase-pure and had a high degree of c-axis orientation (typical value of the full width at half maximum of (007) peak was ∼ 0.25° ). Thickness of the films lies within the range of 2800± 300 Å . The hole concentrations were changed by changing the oxygen deficiency in the CuO1− δ chains by annealing the films under different temperatures in different oxygen environments. Sab[290 K] was used to calculate the planar hole concentration following the method proposed by Obertelli et al.[19] The level of oxygen deficiency was determined from an earlier work where the relation between δ and p was established.[12] Also, as an independent check, systematic variations in the c-axis lattice parameters were noted as δ changes as a result of oxygen annealing.[12]ρ ab(T) measurements provide information regarding the impurity content and about the quality of the grain boundaries of the films. All the films used in this study have low values of ρ ab(300 K) and the extrapolated zero temperature resistivity, ρ ab(0 K). Details of the PLD method and film characterizations can be found in Refs. [20]and [21]. Figure 1 shows the XRD profile of the as-prepared thin film annealed in-situ at 400 ° C in 100% oxygen environment. We have used thin films with four different hole contents in this study. The p values for these films are 0.170 (slightly overdoped, OD), 0.150 (close to optimally doped, OPD), 0.135 (underdoped, UD1), and 0.118 (underdoped, UD2), where the quoted numbers are accurate within ± 0.005.
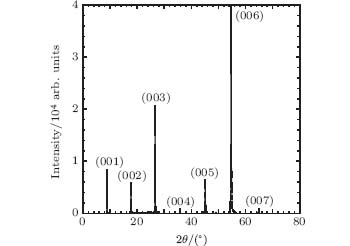 | Fig. 1. X-ray diffraction (XRD) profile (obtained with Co Kα radiation) of the OD film. The Miller indices (00l) are shown in the plot. |
3. Experimental results
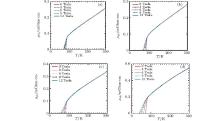
The resistivity, under applied magnetic fields along the c direction, was measured using the four-terminal configuration on patterned untwined thin film samxgples. Evaporated gold pads were used to form low resistance contacts. An AC current of 10 μ A (77 Hz) was applied. Low noise transformers were used to improve the signal-to-noise ratio, and voltages were measured with EG& G model 5110 lock-in amplifiers. Measurements were made at magnetic fields of 0, 3, 6, 9, and 12 Tesla in the temperature range of 50 K– 160 K (the upper temperature limit for the zero field and the 12 Tesla data was 300 K). A temperature sweep rate of 2 K/min was used. A 15-Tesla magnet system (Oxford Instruments) was used to carry out these magneto-transport measurements. A Lake Shore 340 temperature controller was used to control the temperature of the probe head. Temperature was monitored via a Cernox thermometer placed in close proximity of the sample. ρ ab(T, H) data for all the thin films are shown in Fig. 2.
 | Fig. 2. The ab-plane resistivity of (a) OD, (b) OPD, (c) UD1, and (d) UD2 thin films under different magnetic fields applied along the crystallographic c direction. |
4. Analysis of the ρ ab(T, H) data
Within the context of the TAFF model, the single most important parameter is the activation energy for the motion of flux lines/bundles. There exist a number of methods to extract the temperature and field-dependent U(T, H) from the analysis of the resistivity data.[6– 10, 15, 22] In this paper we have employed the method used earlier by Liu et al.[10] This method has been checked for internal consistency and provides us with a satisfactory scheme for the analysis of the ρ ab(T, H) data below Tp, where the critical fluctuations are absent and a simple Arrhenius equation describes the resistive broadening under applied magnetic field. In the TAFF region, the field-dependent resistivity is expressed as follows:
 |
where ρ n is the normal state resistivity. The activation energy depends both on temperature and magnetic field and can be expressed as the product of two functions in the dimensionless form as U(T, H)= f(T)h(H).[9, 10] In this case, U(T, H) can be thought of as the activation energy normalized by U0, where U0 is the effective unperturbed pinning potential at T = 0 K. The functions f and h have the following forms:[9, 10]f(T) = (1− t)m and h(H) = (H0/H)− β . Based on a scaling analysis, Yeshurun and Malozemoff[23] suggested m = 1.5, for anisotropic cuprate superconductors. Subsequent experimental analyses found that the value of m varies over a wide range for different families of cuprates. Even for the same system, depending on the method of synthesis and crystalline state, different values of m were obtained.[9, 10] As mentioned previously, Ref. [10]provides us with a way of calculating the value of m without any a priori assumption. The central feature of this procedure is the observation that over a significant temperature range below Tp, it is possible to describe f(T) by a function g(T) given by
 |
At the same time, following Refs. [10], [15], and [16], we make use of the fact that the applied magnetic field and the zero-resistance temperature, Tc0, can be related through the equation expressed as
 |
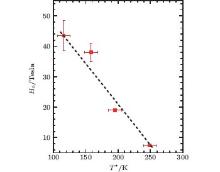
Here Tc denotes the SC transition temperature (not affected by critical fluctuations) in the absence of any magnetic field, i.e., Tc ≡ Tp for the field-free case. In cuprate superconductors, the mixed state, significantly below the mean field SC transition temperature, can be described as a true vortex solid state, whereas the state at temperatures closer to Tp is dissipative and the vortices behave as liquids even for a very low current density. In ultra-clean compounds, the two regimes are separated by a well-defined vortex lattice melting temperature.[24, 25] In samples with quenched disorders, the solid-liquid transition becomes glass-like and Tc0 can be considered as the glass transition temperature, i.e., at T < Tc0, the vortices are pinned and are in the non-dissipative glassy state. Equation (3) describes the field-induced shifts in Tc0 quite well. Fitting to the Tc0(H) data yields the magnitude of β close to unity (0.98 ± 0.04), in agreement with previous studies, [9, 10] irrespective of the hole content. The fitting also produces estimates for H0 as hole contents vary. Using Eq. (3), the activation energy can now be expressed in terms of Tc0 as follows:
 |
Therefore, equation (1) turns into
 |
Rearranging the above expression, we obtain the following expression for the function f(T) in terms of experimentally measurable parameters:
 |
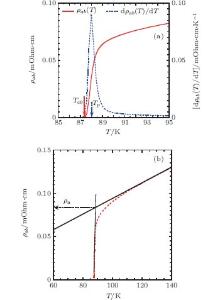
At this point, it should be noted that the above equation contains a number of parameters (namely, Tc (≡ Tp), Tc0, and ρ n) which are determined somewhat subjectively.[6– 10, 15– 17] Different methods yield slightly different values, [6– 10, 15– 17] but the main conclusions do not differ significantly irrespective of the criterion used to locate these parameters from the experimental data. In this study, we have defined Tp as the temperature, where dρ ab(T, H)/dT is maximum and Tc0 has been taken at the temperature where ρ ab(T, H) goes to zero. The normal state resistivity was located at the intersection between two straight lines, with one being the tangent to the ρ ab(T, H) curve at Tp and the other one being the extrapolated straight line fitted to the ρ ab(T, H) data over a T range from Tp + 50 K to Tp+ 25 K. The reasons for selecting this particular temperature range are as follows. (i) Ideally, ρ n should be the resistivity just above the SC transition temperature in the absence of any SC fluctuation. Previous studies on different families of cuprates showed that significant pairing fluctuations only start to contribute in paraconductivity from around 20 K above the mean-field SC transition temperature.[26– 28] Therefore, T region too close to Tp has been avoided. (ii) Higher-temperature linear extrapolation has been excluded since the pseudogap (PG)[26, 29] induces a downturn from the high-T linearity in the resistivity data in the normal state and this contribution due to the PG should be included in the extracted value of ρ n as PG probably originates from a normal state correlation.[26] The procedures for determining Tp, Tc0, and ρ n are illustrated in Figs. 3(a) and 3(b). By taking the mean field SC transition temperature at the peak of the dρ ab/dT data below the resistive onset of superconductivity, we have safely avoided the T range, where the critical fluctuations are significant.
 | Fig. 3. Representative plots for the OD sample in zero magnetic field, illustrating the methods employed to obtain (a) Tc0 and Tp, and (b) ρ n (see text for details) from the resistivity data. |
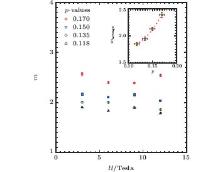
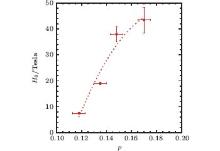
The calculated values of f(T) using Eq. (6) is shown in Fig. 4. We have also shown the fitted function g(T), given by Eq. (2), in the same plot. It is seen that g(T) describes the f(T) data quite well at temperatures below Tp, in agreement with Ref. [10]. Significant order parameter fluctuations are expected to be close to Tp and equation (1) holds only in the TAFF region. Therefore, it is somewhat expected that a single exponent fitting does not describe the experimentally obtained f(T) over the entire T range from Tp to Tc0. According to the procedure employed here, the plot of ln(ρ /ρ n) versus [(Tp− T)m(H0/H)β ]/T should be a straight line and all the data points at different p values could be scaled onto a single straight line. These predictions are checked and our data satisfy such scaling analysis over an extended T range, except at temperatures close to Tp below the SC transition. The values of the temperature exponent, m, obtained from this analysis is not sensitive (within the error bars) to the magnitude of the applied magnetic field. This is in agreement with previous studies, [9, 10] but shows a systematic variation with the hole content. We have shown these behaviors in Fig. 5. Figure 6 shows the strong dependence of H0 on the hole concentration.
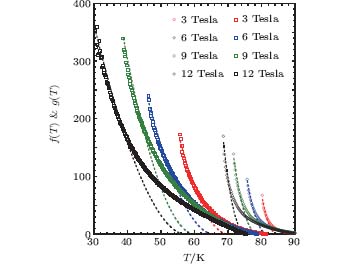 | Fig. 4. f(T): circles for the OD and squares for the UD2 thin films. g(T) (dashed lines) is the low-T fitting to f(T) (see text for details) at different applied magnetic fields. For clarity, data for two out of the four different film compositions are shown here. |
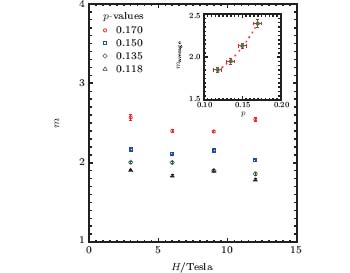 | Fig. 5. Variation of the exponent m with applied magnetic field for samples with different hole contents. The values of p shown in the plot are accurate within ± 0.005. Inset: average values of m versus p. The dashed curve is drawn as a guide to the eye. |
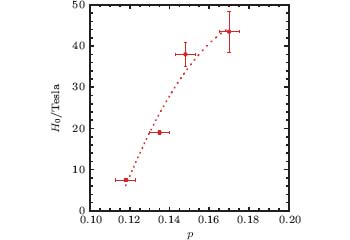 | Fig. 6. Characteristic field H0 versus p. The dashed line is a second-order polynomial fitting to the H0(p) data. |
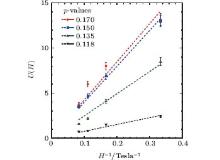
Once reliable estimates for m, β , and H0 are made, the field- and temperature-dependent activation energy can be determined individually. We have extracted the field-dependent part of the activation energy, U(H), from the slope of the ln(ρ /ρ n) versus (Tp− T)m/T plot. The result of this analysis is illustrated in Fig. 7. It is observed that U(H) varies almost linearly with 1/H. The slope of these lines at different p gives an independent measure of H0(p). The values of H0(p) obtained from these slopes are in good (within 5%) agreement with those shown in Fig. 6, extracted from the fitting of the Tc0(H) data using Eq. (3).
 | Fig. 7. Dimensionless activation energy, U(H), versus 1/H at different hole concentrations. The p values given in the plot are accurate within ± 0.005. The dashed lines are fitting to straight lines passing through the origin. |
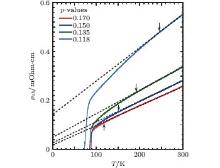
The characteristic PG energy scale (expressed in temperature as T* = ɛ g/kB) has been located at the onset of the downward deviation of experimental ρ (T) data from its high-T linear fitting. This analysis is shown in Fig. 8. The extracted values of T* (p) are in excellent agreement with those found in previous studies.[26, 29– 31] It should be noted that zero-field resistivity data is used here. Application of magnetic field suppresses Tc but has a minimal effect on T* .[32] Figure 9 shows a plot of T* (p) versus H0(p). An almost linear anti-correlation is found between these two apparently independent parameters.
 | Fig. 8. Extraction of the characteristic PG temperature, T* , from the resistivity data. Black dashed lines: the high-T linear fitting to the ρ ab(T) data. Arrows mark the onset of the downward deviations of the experimental data from the linear fitting, T* . |
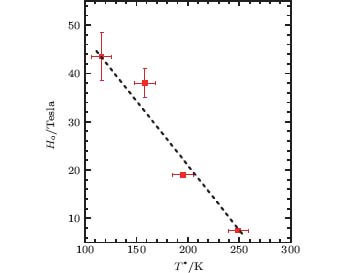 | Fig. 9. T* (p) versus H0(p). An anti-correlation is seen. The thick dashed straight line is drawn as a guide for the eye. |
5. Discussion and conclusions
As stated earlier, previous studies have linked the values of m to extrinsic effects such as the method of synthesis, nature of pinning centers, and to intrinsic properties like the particular family of cuprates, or to the degree of electronic/structural anisotropy.[9, 10, 33] Here, we have found clear indications that for a given system m varies systematically with hole content in the CuO2 planes. Quite interestingly, it has been suggested earlier that m = 1.5 and 2.0 correspond to 3D and 2D behaviors, respectively.[33] Our study reveals that m decreases with the decrease in the hole content. This trend is completely opposite to what was suggested in Ref. [33], since the films become more and more anisotropic as p decreases. For all the films under study, β remains close to unity. This could imply[33, 34] that the flux pinning centers are predominantly point defects in these untwined thin films.
The values of H0 are strongly p-dependent. H0 decreases rapidly in the UD region and seems to peak in the overdoped (OD) side. It is interesting to note that even though the Tc values are almost identical for the OPD and the OD samples, H0 is significantly higher for the OD compound. The OPD compound is more disordered due to oxygen deficient CuO1− δ chains, whereas the OD one has a higher superfluid density due to a smaller PG in the low-energy electronic density of states.[18, 26, 35] These imply that the role of superfluid density/SC condensation energy is significantly greater in enhancing the pinning potential than that due to the oxygen defects in the CuO1− δ chains. This is consistent with the collective pinning model.[18] It is perhaps noteworthy that both condensation energy and superfluid density increase the depairing critical current density and these two intrinsic SC parameters depend largely on the magnitude of the PG.
It is reasonable to assume that the flux line is pinned at a site where the SC order parameter is partially or almost completely suppressed. In this situation the energy of the vortex core would reveal itself as the energy barrier for motion of the flux line and therefore, would be equal to the activation energy U0.[36] Here U0 is the zero-temperature activation energy. The energy density at the vortex core varies as 


Therefore, it appears that to maximize the critical current density or the irreversibility field (both of which depend directly on U0(p)), one must control the sample composition so that the PG is small or zero, without reducing Tc too much by gross overdoping. It is also interesting to note that the p values of the two UD films are quite close to the 1/8th doping where the spin/charge stripe correlations are at their strongest.[38– 40] This study shows that the exponents m and β , as well as the characteristic field H0, vary smoothly as a function of hole content and no noticeable extra feature appears in the vicinity of the 1/8th anomaly. This indicates that the inhomogeneity in the charge/spin arrangements induced by the incipient stripe instability does not affect the vortex dynamics significantly in Y123.
To summarize, we have explored the nature of ab-plane resistive transition of high-quality c-axis oriented crystalline thin films of YBa2Cu3O7− δ over a wide range of hole concentrations. We have found that the temperature exponent varies systematically with hole content. This exponent becomes smaller as the hole content decreases (as the system becomes more anisotropic). The field exponent, on the other hand, remains largely unaffected. The characteristic magnetic field H0 that primarily determines the pinning strength decreases sharply with decreasing p in the UD side. It appears that H0 is controlled by the SC condensation energy, and therefore is linked directly to the PG in the quasiparticle energy spectrum.
The authors would like to thank the MacDiarmid Institute for Advanced Materials and Nanotechnology, New Zealand, and the IRC in Superconductivity, University of Cambridge, UK, for funding this research. The authors would also like to thank the AS-ICTP, Trieste, Italy, for the hospitality.
Reference
| 1 |
|
| 2 |
|
| 3 |
|
| 4 |
|
| 5 |
|
| 6 |
|
| 7 |
|
| 8 |
|
| 9 |
|
| 10 |
|
| 11 |
|
| 12 |
|
| 13 |
|
| 14 |
|
| 15 |
|
| 16 |
|
| 17 |
|
| 18 |
|
| 19 |
|
| 20 |
|
| 21 |
|
| 22 |
|
| 23 |
|
| 24 |
|
| 25 |
|
| 26 |
|
| 27 |
|
| 28 |
|
| 29 |
|
| 30 |
|
| 31 |
|
| 32 |
|
| 33 |
|
| 34 |
|
| 35 |
|
| 36 |
|
| 37 |
|
| 38 |
|
| 39 |
|
| 40 |
|