Effect of pump-1 laser on Autler–Townes splitting in photoelectron spectrum of K2 molecule*
Cite this Article
Guo Wei, Lu Xing-Qiang, Wang Xin-Lin, Yao Hong-Bin. Effect of pump-1 laser on Autler–Townes splitting in photoelectron spectrum of K2 molecule* . Chinese Physics B, 2014, 24(1): 013302 
Permissions
Effect of pump-1 laser on Autler–Townes splitting in photoelectron spectrum of K2 molecule*
Corresponding author. E-mail: luxingqiang@163.com
Project supported by the National Natural Science Foundation of China (Grant Nos. 41104094 and 11174119), the Research Fund for the Doctoral Program of Higher Education of China (Grant No. 20114324120002), the Research Foundation of Education Bureau of Hunan Province, China (Grant No. 12C0370), and the Scientific Research Foundation for the Returned Overseas Chinese Scholars.
Abstract
We theoretically investigate the Autler–Townes (AT) splitting in the photoelectron spectrum of four-level ladder K2 molecule driven by a pump 1-pump 2-probe pulse via employing the time-dependent wave packet approach. The effects of the pump-1 laser intensity and wavelength on AT splitting are studied for the first time. The magnitude of AT splitting increases with increasing the pump-1 laser intensity. The triple splitting with asymmetric profile occurs due to the nonresonant excitation. The triple structure is transformed into a double structure (near-resonant region), and then becomes a peak (far-off resonant region) progressively as the pump-1 laser is detuned from the resonance wavelength, which can be explained in terms of the asymmetric excitation/population of dressed states. The splitting between adjacent peaks and the splitting between the two sideband peaks in the triplet do not change with the pump-1 pulse wavelength. The three peaks shift toward lower energy with the same shift 1/4* Δ1 as the pump-1 wavelength changes in near-resonant region. The asymptotic behaviors of AT splitting with the pump-1 laser intensity are interesting in the threshold points of the near-resonant region and the far-off resonant region.
Keyword:
33.60.+q; 33.20.Xx; 42.50.Hz; Autler–Townes splitting; photoelectron spectra; four-level ladder K2 molecule
1. Introduction
The ac-Stark effect, also known as Autler– Townes (AT) splitting, occurs due to nonlinear interactions between light and matter in the presence of one or more strong variable radiation fields.[1] In recent years, the dependence of AT splitting on laser parameters, such as laser intensity, [2– 27] laser wavelength, [4, 5, 8– 11, 16– 21] pulse width, [6, 7, 22, 24, 25] pulse envelope, [27] and time delay[2, 26, 28, 38] has been studied theoretically and experimentally in multi-level atomic/molecular systems of various configurations
For a three-level system, the AT double splitting generally can be observed by using a pump– probe laser configuration, and can be interpreted by the dressed-state theory. Wollenhaupt et al.[2, 3] observed experimentally the AT double splitting in photoelectron spectra of K atoms, and studied the effects of pump intensity and time delay on AT doublet. They suggested that the asymmetry of the splitting is due to the nonresonant excitation, and the splitting monotonically increases with the laser intensity. Peng and Zheng[4, 5] investigated single quantum dots driven simultaneously by pump– probe field in a three-level V-type system, and showed that the pump intensity and detuning affect the splitting, position and relative height of AT double peaks. Sun and Lou[6] obtained theoretically the AT double splitting in Na2 molecules, and studied the effects of pump intensity and pulse width on the splitting. The longer pulse can induce the asymmetry of doublet. Yuan et al.[7] studied the effects of molecular rotation and alignment on the AT double splitting in Na2. Liu et al.[8] indicated that probe wavelength and time delay have an effect on the AT double splitting and relative height in ladder Li2 molecules. Yao and Zheng[9] and Yao et al.[1] observed the AT double splitting in K2 molecules, and suggested that the pump intensity and wavelength determine the magnitude of splitting and the enhancement of peaks.
Nonlinear effects due to the quantum coherence effect have also been studied in four-level atomic systems of various configurations. The AT splitting in a four-level system shares some similar features with that in a three-level system. Wei et al.[11] and Han et al.[12] studied theoretically the ac Stark effect in a four-level V-type atomic system in the presence of three driving fields. It was found that the absorption spectra can have two or three peaks depending on the intensities and wavelengths of the driving fields. The intensity and wavelength of the second driving field have an effect on the AT splitting. They used the dressed state theory to explain the absorption peaks in the spectra. Many reports[13– 16] studied the AT effect in a strongly driven electromagnetically induced transparency (EIT) resonance with a four-level Λ -type atomic system. It is found that the absorption spectrum has two or three peaks in general and their positions and relative intensities are strongly affected by the intensities of the driving fields and their detunings. Echaniz et al.[17] and Wang and Zheng[18] expected a three-peak absorption spectrum in a four-state N-type atomic system, and studied the trajectories of three peaks as a function of Rabi frequency and detuning of one couple field. The expectation is verified in the Rb sample. Dutta and Mahapatra[19] expected a two or three-peak emission spectrum in a four-state N-type atomic system, and suggested that the double splitting increases as the intensity of one couple field augments. Sandhya[20] studied the absorption profile of a four-level ladder atomic system interacting with three driving fields. It is expected that there is three-peak absorption (dynamic splitting) with strong middle transition coupling. The three-peak splitting is also observed in the absorption profile of a photonic crystal doped with five-level nanoparticles, and the features of triple splitting with different intensities and those of detuning are also studied.[21]
For a four-level ladder system, Meier and Engel, [22] and Meier et al.[23] observed the AT triple splitting in Na2 molecules driven by three driving fields, and studied the effect of pulse width on the AT splitting. Longer pulse indicates asymmetric AT triplet. Hu et al.[24, 25] observed the AT triple splitting in Li2 molecules driven by three driving fields, and studied the effect of pulse width on the splitting. A longer pulse indicates asymmetric AT triple splitting. Liu et al.[26] indicated that the probe intensity and time delay affect the peak height of AT splitting of Li2 molecules using a cw– pump– probe field. Yao and Zheng[27] observed the AT triple splitting with asymmetric profiles in four-level K2 molecules driven by three driving fields in the near-resonant region, and studied the effects of intensity, wavelength, and envelope on AT splitting when the parameters of the three laser fields change simultaneously, but they did not study the phenomenon in the resonant and far-off resonant region nor the effect of the parameters of some pump laser field on the AT splitting.
Most of the above experimental and theoretical studies on the dependence of AT splitting on laser intensity and wavelength are involved with the four-level N, V, and Λ configuration. Few studies relate to the ladder configuration. No study has focused on the effects of the intensity and wavelength of the first pump pulse on AT splitting in a four-level ladder K2 molecule. In this paper, we investigate the natures of the AT splittings in the photoelectron spectra of the four-level ladder K2 molecule driven by pump-1, pump-2, and probe pulses by the time-dependent quantum wave packet method. We discuss the effects of the pump-1 laser intensity and wavelength on AT splitting for three cases: resonant pulse, near resonant pulse, and far-off resonant pulse. The corresponding features are different at different intensities and wavelengths of the pump-1 pulses.
2. Formalism
In this paper, we model a four-level ladder K2 molecule by four electronic states, ground state 


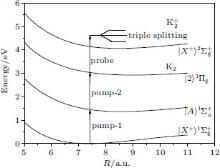
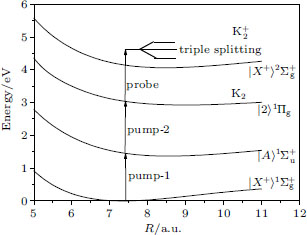 | Fig. 1. Potential energy curves of the K2 molecule used in this work. The arrows indicate the excitation energies of 1.462 eV (848 nm), 1.579 eV (785 nm), and 1.579 eV (785 nm) respectively. |
Under the Born– Oppenheimer approximation, the wavefunction Ψ can be obtained by solving the time-dependent Schrodinger equation
 |
The Hamiltonian H of the system can be written as
 |
where HS = T + V is the Hamiltonian of the K2 molecule, T is the operator of the kinetic energy of the nucleus, V is the potential energy of the system, and H′ is the interaction between the K2 molecule and the laser field. For the four-state model, the wave functions can be written in the form of column vector
 |
where ψ X, ψ A, ψ 2, and ψ ion are the wave functions for the ground state | X⟩ , excited states | A⟩ and | 2⟩ , and ionization state | X+ ⟩ , respectively. The ionization state is a continuum state, and it is discretized into a band of quasicontinuum states in terms of the energies of the emitted photoelectron for the numerical calculations. The ionization state ψ ion can be further expressed as
 |
where N is the number of discrete states of the K2 ion.
The kinetic energy T can be expressed as
 |
where μ is the reduced mass of the nuclei, R is the distance between the nuclei in the K2 molecule,

and 𝔬 = (0, 0, … , 0) is a zero vector with N-component, 
The potential V can be expressed as
 |
where VX, VA, and V2 are the potential curves of the ground state | X⟩ excited states | A⟩ and | 2⟩ , respectively. 𝕍 is an N × N matrix, which is the discretized states of ionization state | X+ ⟩ . It can be written as
 |
where ξ (i) = (i − 1)Δ ξ (i = 1, 2, … N) is the energy of the emitted photoelectron.
The interaction H′ between K2 molecule and laser field is given by
 |
where 


where 
The photoelectron spectrum as a function of the electronic energy ξ (i), can be obtained as[22– 27]
 |
The potential energy curves of the K2 molecule employed in our calculations are cited from Refs. [32]– [35]. These potential curves are in good consistence with relevant spectroscopic constants of experimental results[36– 38] and the detailed information about the potentials can be obtained from Ref. [39]. The transition dipole moments are cited from Ref. [40]. In this paper, the energies of the emitted photoelectron ξ (i) span over 0– 2 eV, and the number of discrete states of K2 ions, N, equals 120. The time-dependent Schrodinger equation (1) is solved by the “ split-operator Fourier” method exactly.[41– 44] The K2 molecule is initially populated on its vibrational ground state of the | X⟩ state.
3. Results and discussion
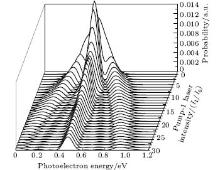
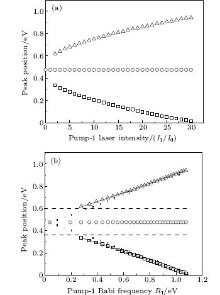
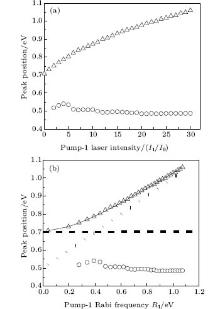
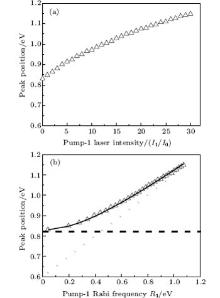
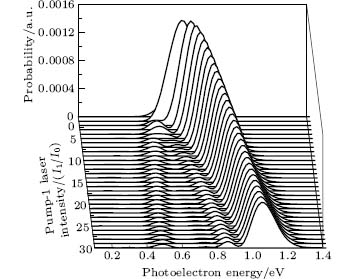
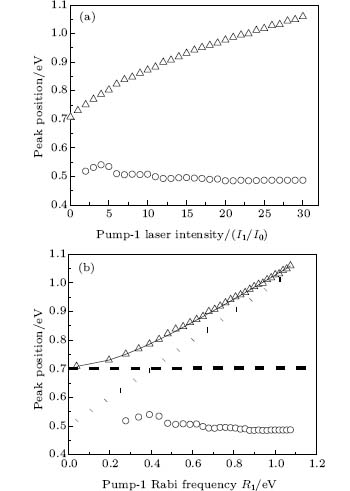
We consider the effect of pump-1 laser intensity on the photoelectron spectrum in the resonant region. Figure 2 shows the photoelectron spectra each as a function of pump-1 laser intensity I1 at I2 = I3 = 4I0 (I0 = 1.0 × 10¹¹ W/cm2), λ 1 = 848 nm, and λ 2 = λ 3 = 785 nm. The peaks of photoelectron spectra show the triple splitting with symmetric profiles: one central and two sideband peaks at I1 ≥ 2I0, and no splitting at I1 ≤ 2I0. The triple splitting with asymmetric profiles of the K2 molecule has been obtained in the near resonant region of the pump-1 pulse with λ 1 = λ 2 = λ 3 = 785 nm. However, the resonant case was not studied.[27] The triplet with symmetric profiles has been observed in four-level ladder Na2 molecule[22, 23] and Li2 molecule, [24, 25] and it is similar to the expected three-peak absorptions (dynamic splittings) in four-level atomic systems with various configurations interacting with three driving fields, [11, 12, 14, 15, 17, 18, 20] which can be explained in terms the dressed state formalism. It is also observed in the absorption profiles in a photonic crystal doped with five-level nanoparticles.[21] The splitting pattern of photoelectron spectrum is so-called AT splitting. According to the explanation of ac-Stark splitting in dressed state picture, the three-peak structure arises from the sufficient Rabi oscillation in the resonant region in the ionization process.[22– 27] From the dressed state theory, the excited state | 2⟩ is dressed by the laser field and splits into three substrates | α ⟩ , | β ⟩ , and | γ ⟩ , which correspond to the three peaks from left to right in the photoelectron spectrum respectively. Here, we assume that the energy of the | γ ⟩ state is higher than that of the | β ⟩ state, which in turn is higher than that of the | α ⟩ state. Another important feature in Fig. 2 is that the magnitude of the triple splitting increases with the increasing laser intensities of the pump-1 pulse. This is similar to the observations in three-level K, [2, 3] Rb, [45] K2, [9, 10] and Na2, [4] and four-level K2.[21] A similar feature is shown in the absorption spectrum for a four-level atomic system interacting with three driving fields.[11– 20, 46, 47] Figure 3 shows the peak positions for the spectra shown in Fig. 2 as a function of pump-1 laser intensity I1 (Fig. 3(a)) and pump-1 Rabi frequency R1 (Fig. 3(b)), respectively. The position of the central peak is around 0.474 eV, which simply is Ev0 + ∑ ħ ω k – VI (R0), [6, 22, 24] with Ev0 being the energy of the vibrational ground state, ħ ω k the photon energy, and VI (R0) the potential of the | X+ ⟩ state at equilibrium distance R0 of the neutral ground state, which are indicated with arrows in Fig. 1. These three peaks are at 0.474 − R/2, 0.474, and 0.474+ R/2 (effective Rabi frequency 
 | Fig. 2. Photoelectron spectra for various laser intensities of pump-1 filed. The parameters are as follows: I = 1.0 × 10¹¹ W/cm2, I2 = I3 = 4I0, λ 1 = 848 nm, λ 2 = λ 3 = 785 nm, and τ = 30 fs. |
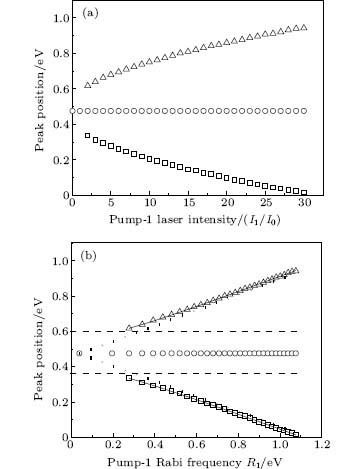 | Fig. 3. Peak positions for the spectra in Fig. 2 as a function of (a) pump-1 laser intensity I1 and (b) pump-1 Rabi frequency R1. Also shown is the result using the dressed-state formalism (curves in solid lines). The dashed straight lines and dotted straight lines indicate the asymptotic behaviors for R1 ≪ R2 and R1 ≫ R2, respectively. All the other parameters are the same as those in Fig. 2. |
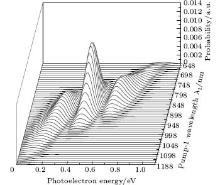
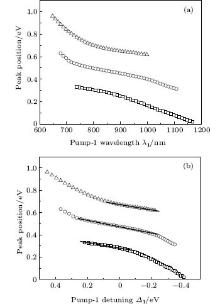
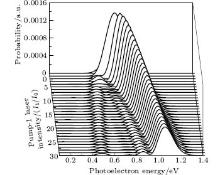
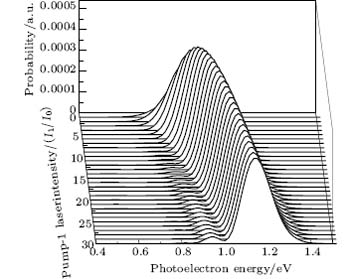
We also pay attention to the effects of the pump-1 wavelength on the photoelectron spectrum. Figure 4 demonstrates the photoelectron spectra for different wavelengths of pump-1 (648– 1188 nm) while keeping the pump-2 resonant, i.e. λ 2 = 785 nm, at I1 = I2 = I3 = 4I0. The pump-1 field detuning is given by Δ 1 = ω 1 − ω AX, where ω AX is the frequency of the | X⟩ → | A⟩ state. From Fig. 4 it is noted that the spectrum exhibits a triple splitting with symmetric profiles when the pump-1 field has a zero detuning (i.e., λ 1 = 848 nm), while asymmetric profiles arise as the pump-1 field is moved off resonance 848 nm. The asymmetry of the splitting is due to the nonresonant excitation. The triple splitting with asymmetric profiles of four-level K2 molecule in the near resonant region of pump-1 with λ 1 = λ 2 = λ 3 = 785 nm has been observed by Yao and Zheng.[27] This asymmetry has been observed in double splitting in three-level K atoms[2] and K2 molecules[9] and other atoms.[5, 52– 54] A similar feature is shown in the three-peak absorption profiles[47, 55] or emission spectra[19] in a four-level atomic system and in five-level atoms.[21] The three peaks shift toward the lower energy with increasing pump-1 wavelength. This is because the longer wavelength indicates the lower photon energy, resulting in lower photoelectron energy. This energy shift trend with the laser wavelength is qualitatively identical with the observation in three/four-level atoms/molecules.[2, 5, 11, 27, 46, 54] This is also identical with the observation in a four-level K2 molecule with a secant pulse and a square pulse by Yao and Zheng, but they did not give the results with a Gaussian pulse.[27] Figure 5 shows the peak positions for the spectra shown in Fig. 4 as a function of pump-1 wavelength λ 1 (Fig. 5(a)) and pump-1 detuning Δ 1 (Fig. 5(b)), respectively. The linear fits are 0.281 + 0.246Δ 1, 0.474 + 0.267Δ 1, and 0.671 + 0.245Δ 1, for three peaks from left to right in the photoelectron spectrum, respectively in the near resonant region. This indicates that both peaks shift 1/4*Δ 1 in the region. This peak shift behavior is not shown in earlier work in the four-level ladder system, but in other configurations. Sadeghi et al.[13] studied the AT effect in a strongly electromagnetically induced transparency (EIT) resonance with a four-level Λ -type atomic system, and suggested that the splitting between adjacent peaks in the triplet of the absorption spectrum may be equal or unequal, depending on different detunings of two driving fields. Echaniz et al.[17] and Wang and Zheng[18] studied the trajectories of three peaks as a function of detuning of the second couple field with the four-level N-type Rb system, and suggested that the peak shift is not linear with respect to the detuning, and the splitting between adjacent peaks in the triplet is unequal to that in the resonant case. In contrast to these suggestions in the detuning case of the driving field, comparing Fig. 5 with Fig. 3, we can see that neither the splitting (0.185 eV) between adjacent peaks nor the splitting (0.370 eV) between the two sideband peaks in the triplet changes with the pump-1 pulse wavelength. In Figs. 4 and 5, an important and interesting feature is that the triple structure is transformed into a double structure and then become one peak progressively as pump-1 is detuned from the resonance wavelength 848 nm. The threshold points are Δ 1 = ± 0.24 eV (i.e., λ 1 = 728 nm or 1008 nm) and Δ 1 = ± 0.34 eV (i.e., λ 1 = 668 nm or 1118 nm) for three-to-two transformation and two-to-one transformation, respectively. The peak disappearance can be explained by the asymmetric excitation/population of dressed states. For the resonant case (i.e., λ 1 = 848 nm), the dressed states | α ⟩ and | γ ⟩ will be equally excited because of their symmetries, so the two symmetric side peaks are observed. However, if the pump-1 wavelength scans from 728 nm to 1008 nm, the dressed states | α ⟩ and | γ ⟩ will be shifted and excited differently, and the two asymmetric side peaks are obtained at near resonant pump-1 pulse. For example, as the pump-1 wavelength increases from resonance, the longer wavelength indicates the lower photon energy, the dress state | α ⟩ will be excited/populated more easily than substate | γ ⟩ , resulting in the enhancement of the left side peak over the right side peak. The disappearance of the right/left side peak for λ 1 ≥ 1008 nm/λ 1 ≤ 728 nm indicates that the population on the | γ ⟩ / | α ⟩ substate is zero. The central peak and right/left side peak disappear for λ 1 ≥ 1118 nm/λ 1 ≤ 668 nm in the far-off resonant pump-1 pulse. This indicates that only the substate | α ⟩ is populated in the far-off resonant pump-1 pulse region.
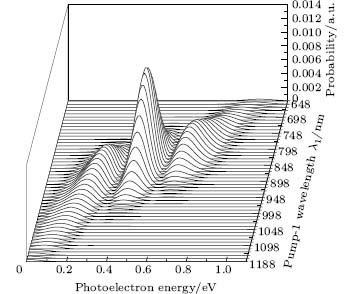 | Fig. 4. Photoelectron spectra for various pump-1 laser wavelengths (648 nm– 1188 nm) with pump-2 resonant. The parameters are as follows: I = 1.0 × 10¹¹ W/cm2, I1 = I2 = I3 = 4I0, λ 2 = λ 3 = 785 nm, and τ = 30 fs. |
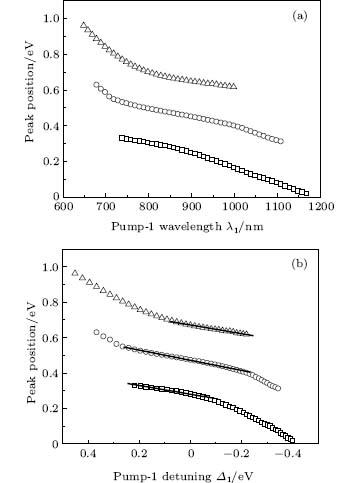 | Fig. 5. Peak positions for the spectra in Fig. 4 versus (a) pump-1 laser wavelength λ 1 and (b) pump-1 detuning Δ 1. Other parameters are the same as those in Fig. 4. |
 | Fig. 6. Photoelectron spectra for various pump-1 laser intensities at the first threshold point. The parameters are as follows: I = 1.0 × 10¹¹ W/cm2, I2 = I3 = 4I0, λ 1 = 728 nm, λ 2 = λ 3 = 785 nm, and τ = 30 fs. |
We consider the effect of pump-1 laser intensity on the photoelectron spectrum in the threshold region (the transformation of three peaks to two peaks), i.e. λ 1 = 728 nm. The result is shown in Fig. 6. A comparison of Fig. 6 with Fig. 2 shows that in Fig. 6, the left side peak disappears and only the central peak and right side peak are in the photoelectron spectrum. These two peaks are at 0.495, 0.495 + R′ /2 (effective Rabi frequency 

 | Fig. 7. Peak positions for the spectra in Fig. 6 versus (a) pump-1 laser intensity I1 and (b) pump-1 Rabi frequency R1. Also shown is the result using the dressed-state formalism (curve shown by solid line). The dashed straight lines and dotted straight lines indicate the asymptotic behaviors for R1 ≪ R2 and R1 ≫ R2. All the other parameters are the same as those in Fig. 6. |
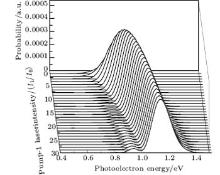
We also consider the effect of pump-1 laser intensity on the photoelectron spectrum in another threshold region (the transformation of two peaks to one peak), i.e. λ 1 = 668 nm. The result is shown in Fig. 8. A comparison of Fig. 8 with Figs. 2 and 6 shows that the central peak and left side peak disappear, only a right side peak exists in the photoelectron spectrum. The position of the right side peak peak is 0.595+ R′ /2 (effective Rabi frequency
 | Fig. 8. Photoelectron spectra for various pump-1 laser intensities at the second threshold point. The parameters are as follows: I0 = 1.0 × 10¹¹ W/cm2, I2 = I3 = 4I0, λ 1 = 668 nm, λ 2 = λ 3 = 785 nm, and τ = 30 fs. |
 | Fig. 9. Peak positions for the spectra in Fig. 8 versus (a) pump-1 laser intensity I1 and (b) pump-1 Rabi frequency R1. Also shown is the result using the dressed-state formalism (curve shown by the solid line). The dashed straight lines and dotted straight lines indicate the asymptotic behaviors for R1 ≪ R2 and R1 ≫ R2. All the other parameters are the same as those in Fig. 8. |
4. Conclusions
In this paper, we theoretically investigate the nature of AT splitting in the photoelectron spectrum of the four-level ladder K2 molecule by employing the time-dependent wave packet approach. The observation of the photoelectron spectrum maps the information on the dressed state. The effects of the pump-1 laser intensity and wavelength on AT splitting are studied in detail for the first time for three cases: resonant pulse, near resonant pulse, and far-off resonant pulse.
In the resonant region, for fixed intensities of pump-2 and probe fields, the photoelectron spectra show the triple splitting with symmetric profiles (in peak height and splitting of two adjacent peaks), and the AT splitting increases with increasing pump-1 intensity. When the pump-1 field is weak (R1 ≪ R2), there is a linear splitting proportional to R2/2. On the other hand, with a very large R1 (R1 ≫ R2), the two side peaks approach a linear splitting proportional to R1/2.
In the nonresonant region, for the fixed intensities of three fields, the photoelectron spectra show that neither the triple splitting with asymmetric profiles (in peak height), nor the splitting (0.185 eV) between adjacent peaks, nor the splitting (0.370 eV) between two sideband peaks in the triplet changes with the pump-1 pulse wavelength. The three peaks shift toward lower energy with the same shift 1/4*Δ 1 as the pump-1 wavelength changes in the near resonant region (i.e., 738 nm ≤ λ 1 ≤ 998 nm). As pump-1 is detuned from the resonance wavelength 848 nm, the triple structure is transformed into a double structure (near-resonant region), and then becomes a peak (far-off resonant region) progressively. This can be explained by the asymmetric excitation/population of dressed states.
At the two threshold points of the transformation (three peaks to two peaks and two peaks to one peak, i.e. λ 1 = 728 nm, 668 nm, respectively) the position of the right side peak changes as the pump-1 laser intensity increases. There is a linear splitting proportional to
Reference
| 1 |
|
| 2 |
|
| 3 |
|
| 4 |
|
| 5 |
|
| 6 |
|
| 7 |
|
| 8 |
|
| 9 |
|
| 10 |
|
| 11 |
|
| 12 |
|
| 13 |
|
| 14 |
|
| 15 |
|
| 16 |
|
| 17 |
|
| 18 |
|
| 19 |
|
| 20 |
|
| 21 |
|
| 22 |
|
| 23 |
|
| 24 |
|
| 25 |
|
| 26 |
|
| 27 |
|
| 28 |
|
| 29 |
|
| 30 |
|
| 31 |
|
| 32 |
|
| 33 |
|
| 34 |
|
| 35 |
|
| 36 |
|
| 37 |
|
| 38 |
|
| 39 |
|
| 40 |
|
| 41 |
|
| 42 |
|
| 43 |
|
| 44 |
|
| 45 |
|
| 46 |
|
| 47 |
|
| 48 |
|
| 49 |
|
| 50 |
|
| 51 |
|
| 52 |
|
| 53 |
|
| 54 |
|
| 55 |
|