


Precision frequency measurement of 1S0–3P1 intercombination lines of Sr isotopes*
Cite this Article
Liu Hui, Gao Feng, Wang Ye-Bing, Tian Xiao, Ren Jie, Lu Ben-Quan, Xu Qin-Fang, Xie Yu-Lin, Chang Hong. Precision frequency measurement of 1S0–3P1 intercombination lines of Sr isotopes* . Chinese Physics B, 2014, 24(1): 013201 
Permissions
Precision frequency measurement of 1S0–3P1 intercombination lines of Sr isotopes*
Corresponding author. E-mail: changhong@ntsc.ac.cn
Project supported by the National Natural Science Foundation of China (Grant No. 61127901) and the Key Project of the Chinese Academy of Sciences (Grant No. KJZD-EW-W02).
Abstract
We report on frequency measurement of the intercombination (5s2)1S0–(5s5p)3P1 transition of the four natural isotopes of strontium, including88Sr (82.58%),87Sr (7.0%),86Sr (9.86%), and84Sr (0.56%). A narrow-linewidth laser that is locked to an ultra-low expansion (ULE) optical cavity with a finesse of 12000 is evaluated at a linewidth of 200 Hz with a fractional frequency drift of 2.8×10⁻¹³ at an integration time of 1 s. The fluorescence collector and detector are specially designed, based on a thermal atomic beam. Using a double-pass acousto-optic modulator (AOM) combined with a fiber and laser power stabilization configuration to detune the laser frequency enables high signal-to-noise ratios and precision saturated spectra to be obtained for the six transition lines, which allows us to determine the transition frequency precisely. The optical frequency is measured using an optical frequency synthesizer referenced to an H maser. Both the statistical values and the final values, including the corrections and uncertainties, are derived for a comparison with the values given in other works.
Keyword:
32.30.Jc; 06.30.Ft; 42.62.Fi; optical frequency measurement; strontium; intercombination transition
1. Introduction
Optical frequency measurements can enhance the development of modern physics by improving the measurement of atomic energy levels, the testing of the theory of quantum electrodynamics (QED), [1] and astronomical observations.[2, 3] In recent years, optical frequency measurement has made great advances following the invention of the optical frequency comb, which makes optical frequency measurement more convenient.[4, 5] Interestingly, some optical clocks have reached a frequency fractional uncertainty level of 10− 18.[6– 8] These highly stable and precise optical clocks allow scientists to search variations of the fine structure constant α .[9] This may lead to new discoveries in fundamental physics.
The alkaline-earth atoms have achieved remarkable success in optical frequency standard applications, [8, 10, 11] and this group of atoms also have excellent performance in Bose– Einstein condensation (BEC), [12, 13] Rydberg atom, [14] and quantum information[15] applications. All these interesting applications are related to the intercombination 1S0– 3P1 transition, which is characterized by a narrow linewidth. As a prominent representative, the intercombination (5s2)1S0– (5s5p)3P1 transition of strontium is becoming increasingly important, and has played a key role in topics such as narrow line laser cooling and trapping, [16, 17] photo-association spectroscopy, [18] BEC, [13] and ultra-cold collisions.[19] Narrow line laser cooling and trapping also serve as an anchor for a high-precision optical lattice clock based on this neutral atom.[8]
There are four strontium natural isotopes, including three bosons, 88Sr, 86Sr, 84Sr, and one fermion, 87Sr (I = 9/2). The abundance of the four natural isotopes are 82.58% (88Sr), 9.86% (86Sr), 0.56% (84Sr), and 7.0% (87Sr). The narrow linewidth (γ = 7.6 kHz) means that it is difficult to obtain proper signal-to-noise ratios (SNRs) from the high-precision nonlinear absorption spectrum for the low abundance isotopes, and particularly for 87Sr and 84Sr, which are very important for quantum degeneracy[20, 21] and BEC[13] applications. The precision frequency measurements of the intercombination (5s2)1S0– (5s5p)3P1 transition of strontium for low abundance isotopes therefore have an important reference value for these research topics.
In this paper, we report direct precision frequency measurement of the intercombination (5s2)1S0– (5s5p)3P1 transition for the four natural isotopes of strontium. Using our carefully designed apparatus, high precision and SNR saturated spectra are obtained. The frequency corrections and uncertainties are considered, and the statistical values and final values are derived and compared. This work also demonstrates the potentials of both the system and the measurement technique that were developed here for precision measurement applications.
2. Experimental setup
Compared with using cold atoms, optical frequency measurements using thermal atomic beams are relatively simple and are also reliable. Atomic beams have been widely used for a long time, and thus the properties of these beams, such as their transverse velocity distributions, [22] have also been investigated in depth. The atomic flux from the beam can be high enough to access the spectra of low abundance isotopes. Additionally, it is much more convenient to measure the optical frequencies of different isotopes using an atomic beam, because the transition signals of the different isotopes can be detected with a single atomic beam.
The experiment setup for optical frequency measurement of the intercombination (5s2)1S0– (5s5p)3P1 transition of strontium is shown in Fig. 1. The setup is composed of a stabilized and narrow linewidth laser source (Fig. 1(a)), an atomic beam fluorescence spectroscopy system (Fig. 1(b)), and an optical frequency synthesizer stabilized to an H-maser clock (Fig. 1(c)).
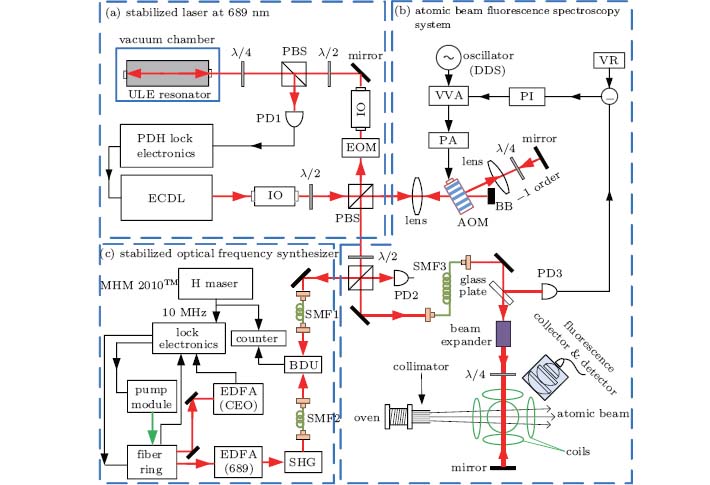 | Fig. 1. Experimental setup for optical frequency measurement of the intercombination (5s2)1S0– (5s5p)3P1 transition of strontium. |
Given that the natural linewidth of the intercombination (5s2)1S0– (5s5p)3P1 transition of strontium is only 7.6 kHz, the linewidth of the laser used to measure this transition frequency should be much smaller than 7.6 kHz. The laser frequency drift should also be as small as possible. Based on these demands, the laser system was constructed as shown in Fig. 1(a). The laser is an external cavity diode laser (ECDL) (Toptica, DL 100 pro design) operating at 689 nm. It is mounted in a Littrow configuration, and delivers a typical output power of 16 mW. This laser is locked to an optical cavity with a finesse of 12000 by the classical Pound– Drever– Hall (PDH) method. The optical cavity, made from ultra-low expansion material, is temperature-controlled with fluctuation of less than 0.01 K and isolated from the atmosphere using a vacuum chamber that is maintained at a pressure of 1.1× 10− 7 Torr. The free spectral range of the optical cavity is 1.5 GHz. The electro-optic modulator (EOM) is driven at 5 MHz. Both optical isolators provide 60 dB isolation. Under locked conditions, more than 90% of the laser power is contained in the carrier, and the linewidth is approximately 200 Hz. To evaluate the fractional frequency drift of this stabilized laser, we beat the laser beam with the optical frequency comb. The Allan standard deviation of the fractional frequency drift of the laser is 2.8× 10− 13 at an integration time of 1 s and the lowest value is 4.6× 10− 14 at an integration time of 16 s.[23]
To determine the transition frequency, the spectrum must be measured with high precision. This requires the detection laser to be stable in terms of both power and space, and the SNR should also be high. The atomic beam fluorescence spectroscopy system is shown in Fig. 1(b).
Because the laser frequency has been locked to the passively-stabilized optical cavity, a double-pass acousto-optic modulator (AOM) configuration is used here to detune the laser frequency. In the double-pass configuration, the AOM is placed at the common focus spot of the two lenses, which have identical focal lengths (f = 200 mm). The minus first-order diffraction beam is reflected by a mirror, meaning that the laser beam travels through the AOM twice and the laser frequency ω is thus reduced by two factors of the modulation frequency Ω . This configuration can largely eliminate the variation in the laser propagation direction, but the residual variations cannot be ignored in the frequency measurement. If the laser power is dependent on Ω , another problem also arises during the sweeping of the modulation frequency and affects the fluorescence spectrum.
To stabilize the laser propagation direction and laser power during the sweeping of the modulation frequency, a short single-mode fiber (SMF3) and a laser power stabilization setup is used. SMF3 is 1 m long and can almost absolutely eliminate the laser propagation direction instability, but it also increases the laser power instability. The laser power stabilization setup can stabilize the downstream laser power. In the laser power stabilization setup, a small part of the laser power that has been separated using a glass plate is fed into a photodiode (PD3) that can turn the laser power signal into a voltage signal. After the voltage signal is subtracted from the highly stable voltage reference (VR) that is generated by the LT1027 operational amplifier, an error signal that represents the instability of the laser power is generated and is sent to a proportional integrating (PI) amplifier, which outputs a negative feedback voltage to a voltage variable attenuator (VVA). A direct digital synthesizer (DDS) oscillator, a voltage-variable attenuator (VVA), and the power amplifier (PA) form a voltage-tunable AOM driver that can control the diffraction efficiency of the AOM using the negative feedback voltage. Here, a negative feedback loop is formed to stabilize the laser power. This setup can stabilize the laser power to a level of better than 10− 4. Thus, stabilization of the power and the propagation direction of the detection laser can be ensured, while the detection laser frequency can be detuned.
The strontium atomic beam is collimated by a bundle of approximately 300 Monel-400 alloy capillaries with a length of 8 mm and an inner diameter of 0.2 mm. The oven is heated to about 823 K, and the corresponding atomic flux is estimated to be of the order of 1012 atoms per second. To shield the external magnetic field in the detection region, three pairs of coils are placed such that they are orthogonal to each other around the region.
To obtain high-SNR fluorescence spectra, a fluorescence collector and a photodetector were home-made for specific designs. The fluorescence collection efficiency of the fluorescence collector, which is composed of three anti-reflection flat-convex coated lenses, is simulated and optimized using the Zemax lens design tool. The solid angle for fluorescence collection, which is limited by the design of the vacuum chamber, is π /6. The photodetector, which is designed to have a two-stage amplifier (based on an AD549 operational amplifier) and adjustable bias voltage, has an output of about 5× 10⁶ V/W. The photodiode used in this photodetector is the S1337-1010BR diode, which has a sensitivity of 0.44 A/W to 689 nm light.
The laser beam, which has been expanded to a 1/e2 diameter of 12 mm after it was filtered by SMF3, is retro-reflected by a mirror and coupled back into SMF3. The placement of a quarter-wave plate before the mirror means that the polarization direction of the reflected beam is changed by π /2, and thus the reflected beam is also reflected by a polarizing beam splitter (PBS) and detected by a photodetector (PD2) that is used to detect the power of the laser beam that was coupled back. By maximizing the power of the back-coupled laser beam, the indeterminate angle of the retro-reflected beam can be estimated to within 20 μ rad. We can also minimize the residual first-order Doppler shift using this method.
Figure 1(c) shows our stabilized optical frequency synthesizer system. The repetition rates and offset frequencies of available optical frequency synthesizers must be locked to a highly stable reference frequency. In this paper, an active hydrogen maser (Symmetricom® MHM 2010™ ) is used. It delivers an extremely stable frequency of 10 MHz, and the typical Allan deviations are 1.5× 10− 13, 2.0× 10− 14, and 5.0× 10− 15 for integration times of 1 s, 10 s, and 100 s, respectively.
We use a commercial optical frequency synthesizer (Menlo Systems GmbH, FC1500) based on a femtosecond fiber laser frequency comb to measure the optical frequency. Both the repetition rate (close to 250 MHz) and the offset frequency (absolute value close to 20 MHz) are locked to the H-maser clock. The configuration of this optical frequency synthesizer is shown in Fig. 1(c). The center wavelength of the fiber ring femtosecond laser is approximately 1560 nm. After amplification and undergoing a process called self-soliton Raman shift[24] in the EDFA (1378) module, the wavelength of one of the beams outputting from the fiber ring is shifted to 1378 nm. Then, the SHG (689) module, which is based on a periodically poled lithium niobate (PPLN) crystal, frequency doubles the comb laser beam to 689 nm. The comb laser beam then beats with the optical cavity-stabilized continuous wave (cw) laser in the beat detection unit (BDU). The beat signal is sent to the counter, which is referenced to the H maser, to measure its frequency. Another beam outputting from the fiber ring is fed into the EDFA (CEO, carrier-envelope offset) to be amplified, and goes through a highly nonlinear fiber (HNLF) that broadens the spectrum to cover an octave, spanning roughly from 1050 nm to 2100 nm. Then, the offset frequency can be detected and stabilized by providing feedback to the pump diode laser current. The repetition rate can be detected from the mode-locked fiber ring laser and can be adjusted via the intra-cavity piezoelectric element and the intra-cavity EOM, and by a motorized translation stage that is used for rough adjustment. Repetition rate locking is achieved via feedback to the intra-cavity piezoelectric element (lower bandwidths) and the intra-cavity EOM (higher bandwidths). For the radio frequency reference, repetition rate locking can be achieved via feedback to the intra-cavity piezoelectric element only.
3. Fluorescence spectrum of the intercombination (5s2)1S0– (5s5p)3P1 transition of strontium
By considering the SNRs of the low abundance isotopes and the influence of external factors, such as the instability of the detection laser and external magnetic fields, and using the experiment setup that has been described in detail in Section 2, some fluorescence spectra are obtained.
Figure 2 shows the Doppler-broadened fluorescence spectrum that was obtained by scanning the piezoelectric transducer (PZT) element of the ECDL under free-running conditions. It shows all (5s2)1S0– (5s5p)3P1 transition lines of the natural isotopes (88Sr, 87Sr, 86Sr, 84Sr) of strontium and their frequency gaps in general. The fluorescence signal amplitudes are sufficient, even for the signal from 84Sr. The relative peak values of 88Sr, 87SrF= 9/2– F′ = 11/2, 87SrF= 9/2– F′ = 9/2, 87SrF= 9/2– F′ = 7/2, 86Sr, and 84Sr have a ratio of 100:3.97:2.80:2.09:11.87:0.70. Because these peak values are proportional to the numbers of the corresponding isotope atoms, the abundance of this strontium sample can be inferred to be 82.3(3)% (88Sr), 7.3(3)% (87Sr), 9.8(3)% (86Sr), and 0.6(3)% (84Sr). This abundance is in good agreement with the natural abundance value given by IUPAC.[25] The residual Doppler broadening is 37 MHz (full width at half maximum, FWHM), which corresponds to the residual atomic beam divergence.
 | Fig. 2. Fluorescence spectrum of the strontium intercombination (5s2)1S0– (5s5p)3P1 transition. Inset: the whole fluorescence spectrum signal. |
To obtain precision saturation spectra, we detune the laser frequency by sweeping the AOM driver frequency, which is generated by a DDS, while the laser frequency is locked to the ULE optical cavity. For the (5s2)1S0– (5s5p)3P1 transition, it can be split by an external magnetic field, because there are three Zeeman sub-lines in the bosons and other complicated lines in the fermion 87Sr (I = 9/2). Therefore, an external magnetic field can reduce the SNR and the resolution of the spectrum and influence the transition frequency measurement precision, particularly for 87Sr. The high abundance of 88Sr allows the intensity of the detection laser to be as low as 100 μ W/cm2 (the saturation intensity is 3 μ W/cm2). Thus, a high SNR and narrow linewidth (FWHM of 55 kHz) saturation spectrum can be obtained. Based on this precision saturation spectrum for 88Sr, the energy level splitting due to the Zeeman effect can be discriminated precisely. By adjusting the driving currents of the three pairs of coils, the Zeeman sub-lines and the crossover transition lines can be shifted to be sufficiently close until they cannot be distinguished. An estimation based on the driving currents of the coils indicates that the external magnetic field is no more than 0.03 G, which is much smaller than the geomagnetic field of 0.5 G– 0.6 G.
Figure 3 shows representative saturation fluorescence spectra for the four natural isotopes near the Lamb dip under a near-zero external magnetic field. Because the abundances of the different isotopes are different and to obtain a sufficiently high SNR in each case, the laser power used is different in each case. The laser intensity for the 88Sr line is about 0.1 mW/cm2, while that for the 86Sr line is about 2.1 mW/cm2. The intensity for the three lines of 87Sr is about 4.3 mW/cm2, and that for the 84Sr line is about 12 mW/cm2. The SNRs of the spectra of the low abundance isotopes are relatively low, so the laser power stabilization is necessary; otherwise, the Lamb dip almost cannot be seen at all in the spectra. To calculate the linewidth of the Lamb dip in each case, curves were fitted by Lorentz fitting. This fitting shows that the FWHM values of the Lamb dip for 88Sr, 86Sr, 87SrF= 9/2– F′ = 7/2, 87SrF= 9/2 – F′ = 7/2, 87SrF= 9/2 – F′ = 7/2, and 84Sr are 55 kHz, 229 kHz, 433 kHz, 445 kHz, 427 kHz, and 1020 kHz, respectively, corresponding to the power broadening, transit-time broadening, and recoil splitting.
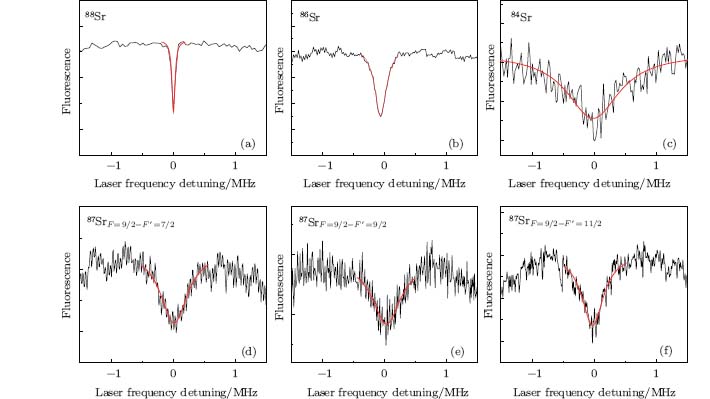 | Fig. 3. Fluorescence saturation spectrum of the strontium (5s2)1S0– (5s5p)3P1 transition lines of the four natural isotopes crossing the Lamb dip. The FWHM values of the Lamb dip for (a) 88Sr, (b) 86Sr, (d) 87SrF= 9/2 – F′ = 7/2, (e) 87SrF= 9/2 – F′ = 9/2, (f) 87SrF= 9/2 – F′ = 11/2, and (c) 84Sr are 55 kHz, 229 kHz, 433 kHz, 445 kHz, 427 kHz, and 1020 kHz, respectively. |
4. Optical frequency measurement
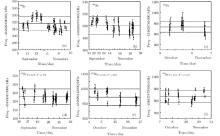
To measure the transition frequency, the laser frequency that has been locked to the ULE optical cavity should be shifted to the center of the Lamb dip. Because the power of the detection laser has been stabilized, when the RF of the AOM driver is swept periodically, the fluorescence signal turns sharply at the end of the sweep. From the measured spectrum, the frequency difference between the center of the Lamb dip and the end of the frequency sweep can be measured. Here, we denote this frequency difference as fd. Then, the laser frequency can be shifted precisely to the center of the Lamb dip by adjusting the AOM driver. The precision depends on the Lamb dip linewidth and the SNR of the spectrum. Figure 4 shows the frequency measurement results for the four natural isotopes over several days. To randomize the residual first-order Doppler shift that results from imperfect alignment in the standing wave, the retro-reflected beam is realigned after each data point measurement. Additionally, to randomize the deviation of the measurements of fd, we record six spectra at least, corresponding to six values of fd for each data point. The error bar is the sum of the standard deviation of fd and the standard deviation of the beat frequency between the cw laser and the light from the optical frequency synthesizer. We set the mean value of the data points as the statistical value, and the root mean square as the uncertainty of the statistical value.
 | Fig. 4. Spectra results of frequency measurements of the (5s2)1S0– (5s5p)3P1 transitions of the four natural Sr isotopes. (a)– (c) Measurement results of the bosons 88Sr, 86Sr, and 84Sr, respectively. (d)– (f) Measurement results of the fermions 87SrF= 9/2 – F′ = 7/2, 87SrF= 9/2 – F′ = 9/2, and 87SrF= 9/2 – F′ = 11/2, respectively. |
5. Corrections and uncertainties
The spectroscopy technique used here is standing wave saturation absorption, which involves some complex line shift effects. The main effects, including a residual first-order Doppler shift, a recoil shift, a second-order Doppler shift, curvature of the laser wavefront, the mechanical effects of light, a collision shift, and a second-order Zeeman shift, are evaluated here. Corrections and uncertainties corresponding to these effects are listed in Table 1.
| Table 1. Budget of corrections and uncertainties for optical frequency measurements of the four natural isotopes. |
The residual first-order Doppler shift comes from a small alignment imperfection of the standing wave. A deviation at the micro-radian level may lead to a kHz-range frequency shift. This effect has been randomized by realigning the reflected beam after each measurement. For the resulting contribution of the first-order Doppler shift to the final uncertainty, it is evaluated to be less than 7 kHz based on the undetermined angle of retro-reflected laser beam. Because of the differences in atomic mass between the four isotopes, the recoil effect leads to different corrections. The second-order Doppler effect causes a correction of about 0.6 kHz. Considering that we have minimized the magnetic field to within 0.03 G by merging the sub-Zeeman levels using the saturated spectrum of 88Sr, we provide the upper limit values for the first-order and second-order Zeeman shifts. With regard to the collision shift, we also offer an upper limit value based on the self-broadening coefficient given by Ref. [26] (approximately 50 MHz/Torr). Considering that the background pressure is on the order of about 10− 6 Torr, this value is approximately 50 Hz. Based on the theory given by Ref. [27], we evaluate the shift due to the curvature of the laser wavefront to add about 2 kHz to the final uncertainty. In the standing wave saturation spectrum, the mechanical effects of light can induce a blue shift at the lowest Lamb dip.[28] Based on our experimental conditions, we make a conservative estimate for this effect using the theory offered by Ref. [28]. The correction and the uncertainty of the final value are the sum of the corrections and the uncertainties of the above contributors, including the statistical uncertainty. We present our final values with conservative uncertainty in Table 2, and also compare our results with other final values measured by other researchers.
| Table 2. Absolute frequency of the 1S0– 3P1 transitions of strontium (“ *” : experimental value, “ #” : computed value). |
6. Conclusion
In conclusion, we report the frequency measurement of the intercombination (5s2)1S0– (5s5p)3P1 transition of the four natural strontium isotopes. The experiment setup was carefully designed. A narrow linewidth laser, which was locked to a ULE optical cavity with a finesse of 12000, was evaluated at a linewidth of 200 Hz with a fractional frequency drift of 2.8× 10− 13 at an integration time of 1 s. Based on a thermal atomic beam, the fluorescence collector and detector were specially designed to improve the SNR of the spectrum. By using a double-pass AOM combined with a fiber and laser power stabilization configuration to detune the laser frequency, the detection laser remains highly stable in terms of both power and space. The saturation spectra of the six transition lines, corresponding to the intercombination (5s2)1S0– (5s5p)3P1 transition of the four natural strontium isotopes, are detected. Based on the use of these saturation spectra to determine the transition frequency, the six transition line frequencies were measured precisely using a commercial optical frequency synthesizer (FC1500) that was referenced to an active H-maser clock (MHM 2010™ ). The statistical values and the final values, including the frequency corrections and uncertainties, are derived, showing that the results obtained in this work are in good agreement with previous results in the literature.
Reference
| 1 |
|
| 2 |
|
| 3 |
|
| 4 |
|
| 5 |
|
| 6 |
|
| 7 |
|
| 8 |
|
| 9 |
|
| 10 |
|
| 11 |
|
| 12 |
|
| 13 |
|
| 14 |
|
| 15 |
|
| 16 |
|
| 17 |
|
| 18 |
|
| 19 |
|
| 20 |
|
| 21 |
|
| 22 |
|
| 23 |
|
| 24 |
|
| 25 |
|
| 26 |
|
| 27 |
|
| 28 |
|
| 29 |
|
| 30 |
|
| 31 |
|