|
|
Linear-fitting-based similarity coefficient map for tissue dissimilarity analysis in T2*-w magnetic resonance imaging
|
Yu Shao-De a),b), Wu Shi-Bin a),b), Wang Hao-Yu c), Wei Xin-Hua d), Chen Xin d), Pan Wan-Long e), Hu Jiani f), Xie Yao-Qin† a) |
|
| |
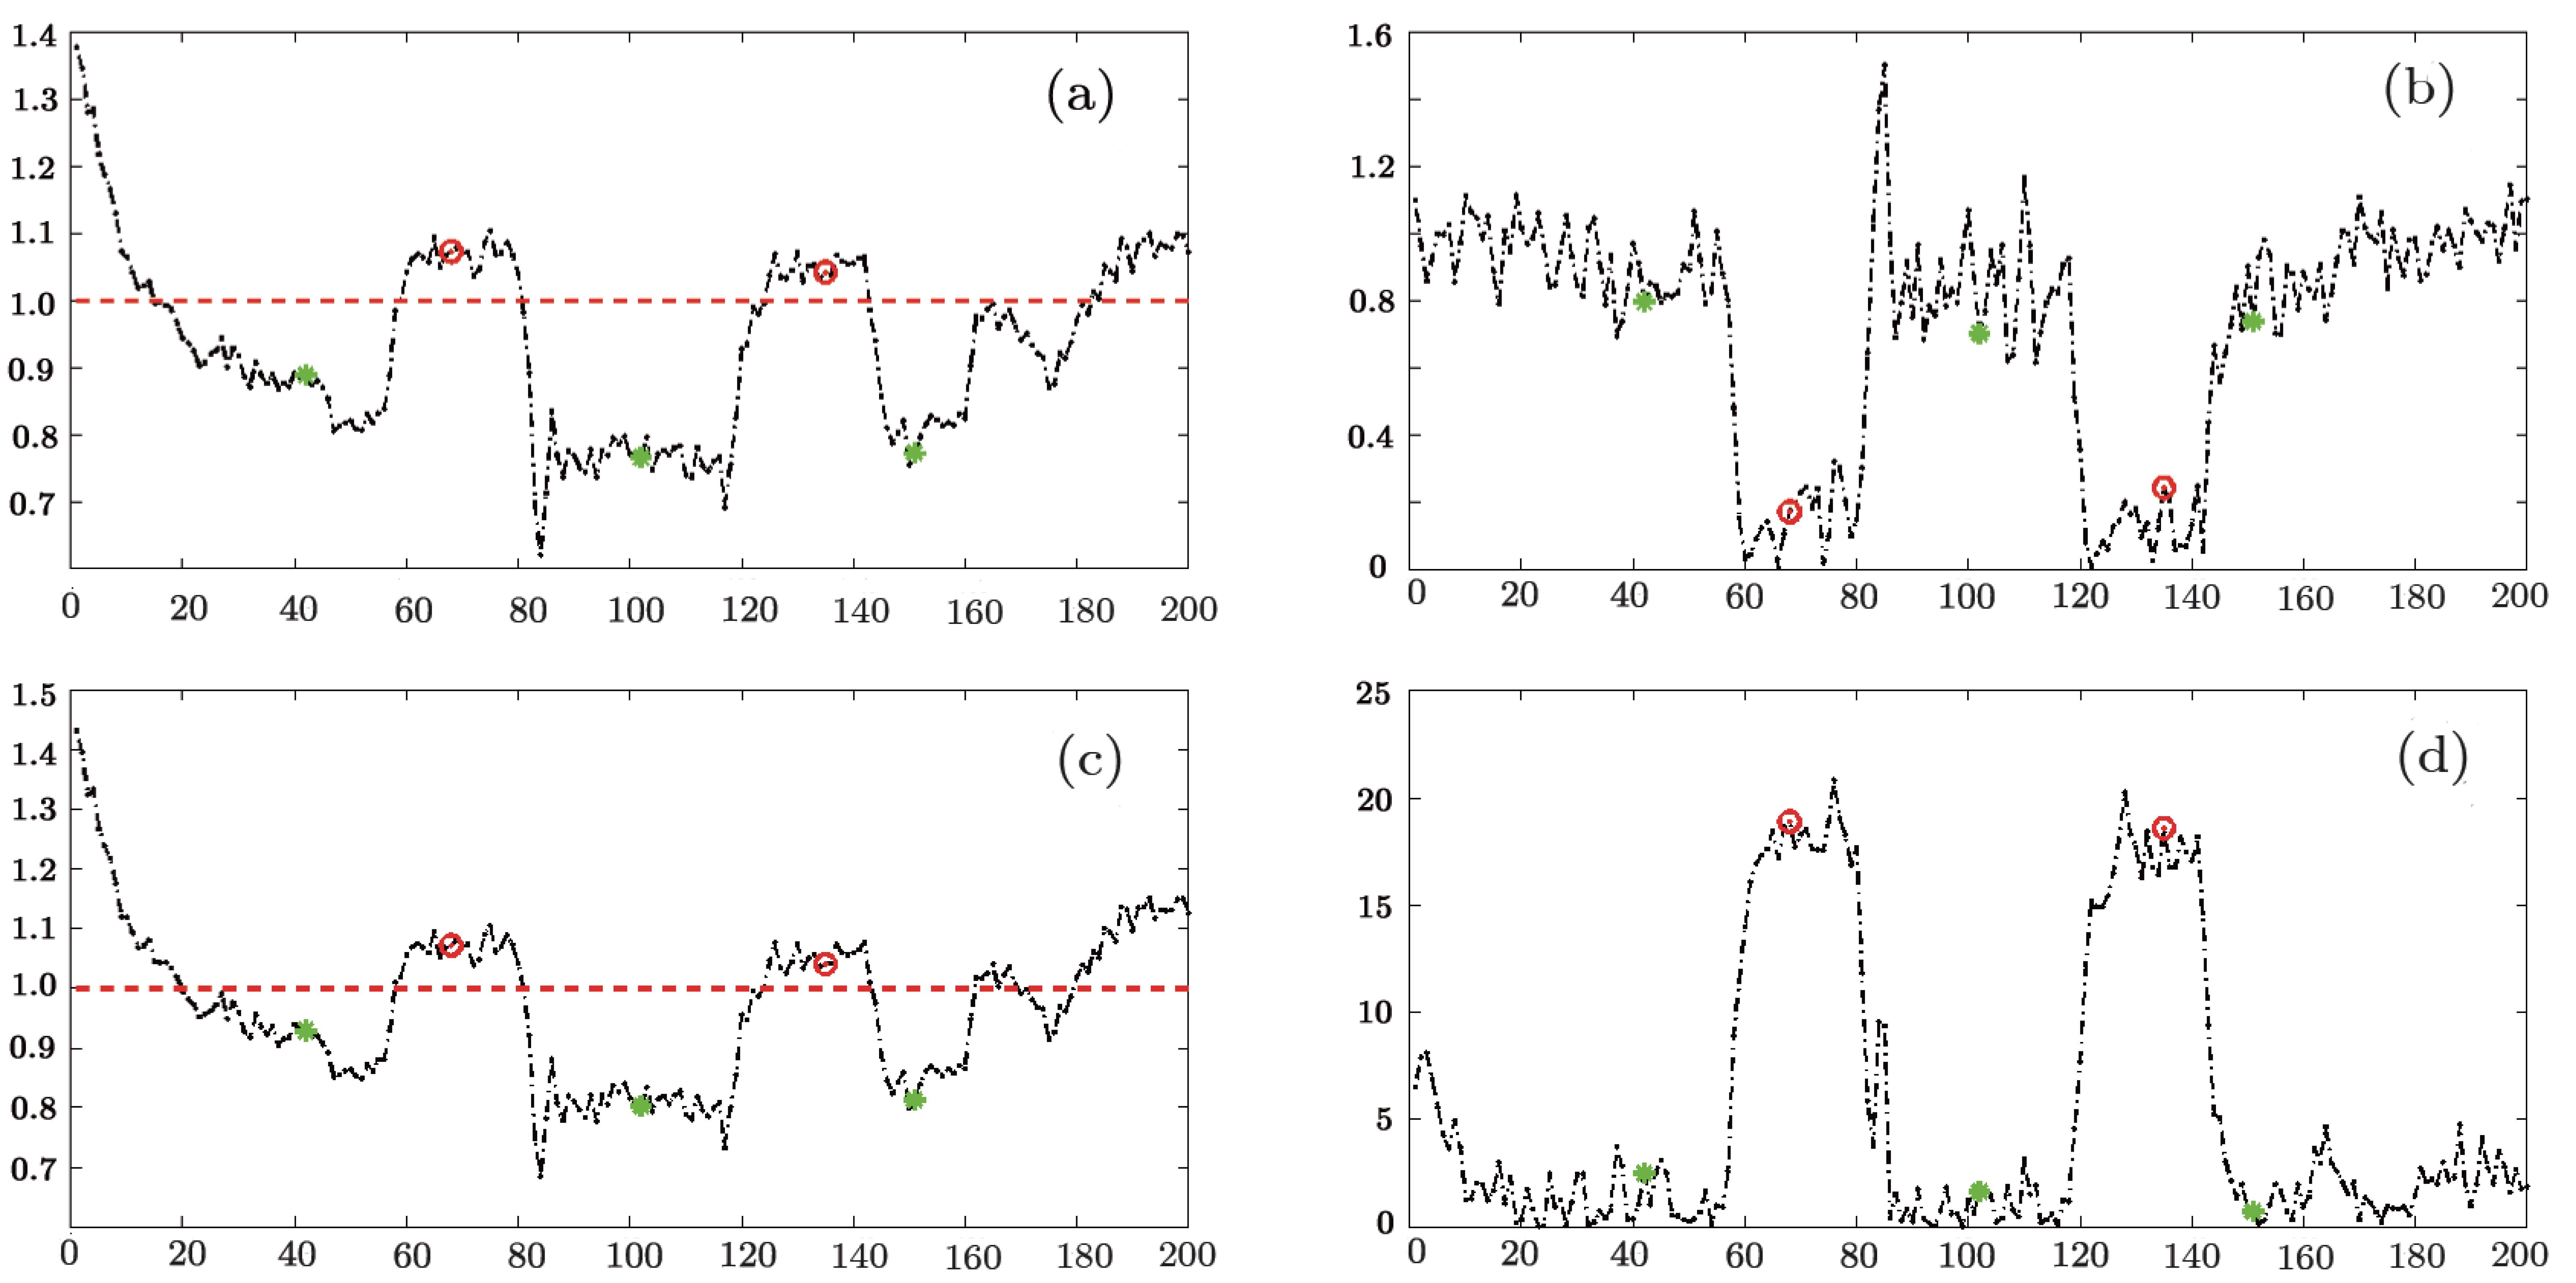
| Intra- and inter-tissue analysis and theoretical interpretation based on pixel intensity observation. Black dots shown in panels (a), (b), (c), and (d) respectively correspond to those pixel intensities on the blue lines in Fig. 1 [panels (e), (f), (h), and (i)], and red circles and green sparkers are also in accordance. The x axis corresponds to the pixel index and the y axis shows the pixel intensity |
|
|
 |
|
|