
Al-doping influence on crystal growth of Ni–Al alloy: Experimental testing of a theoretical model
[Rong Xi-Minga) , Chen Junb), c) , Li Jing-Tianb), c) , Zhuang Juna) , Ning Xi-Jing†b), c)  ]
]
]
|
|


†Corresponding author. E-mail: xjning@fudan.edu.cn
*Project supported by the Specialized Research Fund for the Doctoral Program of Higher Education, China (Grant No. 20130071110018) and the National Natural Science Foundation of China (Grant No. 11274073).
Recently, a condensing potential model was developed to evaluate the crystallization ability of bulk materials [Ye X X, Ming C, Hu Y C and Ning X J 2009 J. Chem. Phys.130 164711 and Peng K, Ming C, Ye X X, Zhang W X, Zhuang J and Ning X J 2011 Chem. Phys. Lett.501 330], showing that the best temperature for single crystal growth is about 0.6 Tm, where T m is the melting temperature, and for Ni–Al alloy, more than 6 wt% of Al-doping will badly reduce the crystallization ability. In order to verify these predictions, we fabricated Ni–Al films with different concentrations of Al on Si substrates at room temperature by pulsed laser deposition, and post-annealed the films at 833, 933, 1033 (∼ 0.6 Tm), 1133, and 1233 K in vacuum furnace, respectively. The x-ray diffraction spectra show that annealing at 0.6 Tm is indeed best for larger crystal grain formation, and the film crystallization ability remarkably declines with more than 6-wt% Al doping.
Compared with polycrystalline materials with the same chemical composition, single crystal materials have superior characteristics due to the clearance of boundary influences, [1– 4] and great efforts have been made to fabricate single-crystal materials with larger volumes and more perfect structures. In practice, different materials have different crystallization abilities. For example, Si single crystals can easily grow up to ∼ 1 m, but single-crystal diamond can hardly grow larger than several millimeters (∼ mm) even under extreme conditions.[1, 5, 6] Thus, in new material design, theoretical predictions of the crystallization abilities and the optimum growth conditions are very helpful for the experimental explorations, and lots of theoretical efforts have been devoted to these issues, such as the phase field theory, [7– 12] molecular dynamics (MD)[13– 15] and Monte Carlo (MC)[16– 18] simulations. Recently, a condensing potential (CP) model was proposed to evaluate the ability for materials to form single crystals.[19– 22] This model works very easily, and some of the predictions have been confirmed by MD simulations and are in agreement with available experimental observations.
In the present work, we perform experiments to test predictions of the CP model on Ni– Al alloy. Nickel-based metallic systems have already obtained wide applications ranging from metallization of integrated circuits, [23– 25] catalytic materials, [26– 29] to high temperature alloy.[30– 32] High temperature Ni-based superalloys are the first option for manufacturing advanced gas turbine blades, [33, 34] and Al as the indispensable element is doped in every kind of the superalloys to enhance the mechanical and thermal properties.[35– 37] However, heavy doping of Al will inevitably reduce the ability for the alloy to form single crystal. The prediction of CP model indicates that the crystallization ability of Al-doped Ni alloy declines monotonically with increasing the doping ratio, and more than 6 wt% doping will heavily reduce the possibility to form single crystal.[21, 22] Besides, our previous MD simulations for testing the CP model[19, 20] showed that ∼ 0.6Tm is the best temperature for pure metal to form single crystal, which is expected to be true for most materials. In this paper, we fabricate Al-doped Ni films on Si substrates at room temperature (RT) by pulsed laser deposition (PLD) method, which has been widely used in film growth, [38– 48] and post-anneal the films at different temperatures, then performed x-ray diffraction (XRD) measurement to see how the annealing temperature and the concentration of Al doping influence the crystallization ability.
In our experimental system, the beam of KrF excimer laser (Lambda Physik LPX 100), operating at a repetition rate of 3 Hz with a pulse width of ∼ 20 ns, is focused on the Ni/Ni– Al target at an angle of 45° , and the Si substrate parallel to the target was placed approximately 2 cm away. The energy density of the laser beam was approximately 5 J/cm2∼ 10 J/cm2, and the deposition was performed in a stainless steel chamber with a pressure of about 4 × 10− 4 Pa. Before being loaded into the chamber, the Si wafers were cleaned using a standard Radio Corporation of America (RCA) cleaning procedure. The deposition lasted 4 h at RT, and then was post-annealed in a vacuum tube furnace for 4 h with a pressure of about 1 Pa at temperatures ranging from 773 K to 1233 K. The temperature accuracy of the vacuum furnace is 1 K, and the heating rate is 10 K per minute. Finally, the samples were characterized by XRD (Bruker D8-A25-ADVANCE) using filtered CuKα radiation source at 40 kV and 40 mA with a wavelength of 0.1542 nm, and all the XRD spectra are normalized in the same figure according to the intensity of Si substrate.
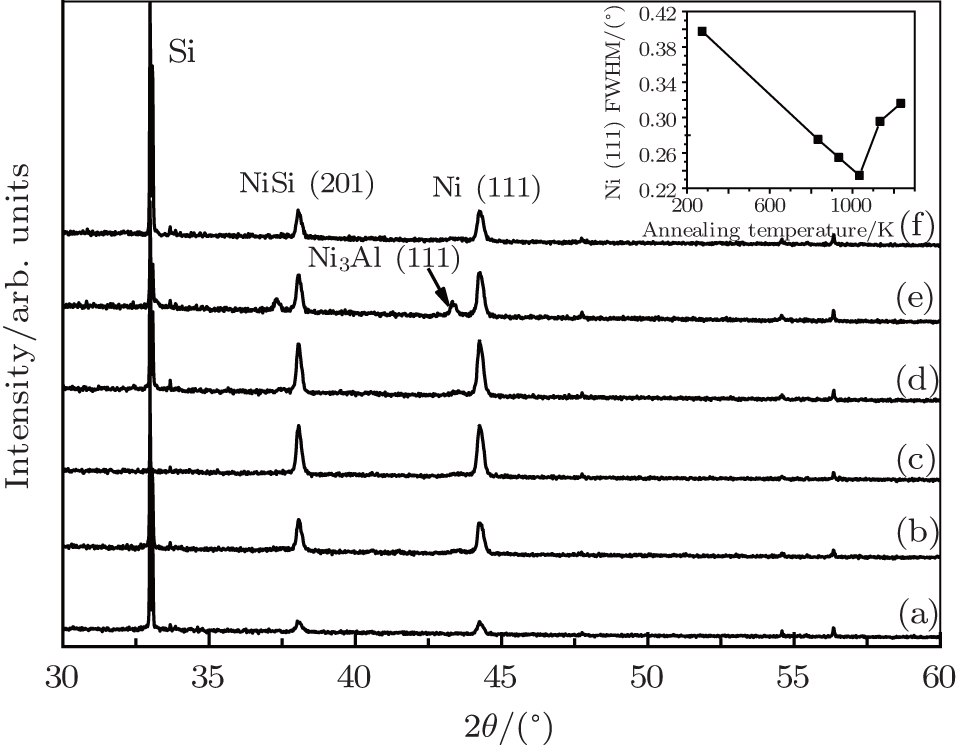
Figure 1 shows the XRD spectra of pure Ni films grown on Si (100) substrates at RT with a laser energy density of 10 J/cm2, and post-annealed at temperatures of 833, 933, 1033, 1133, and 1233 K for 4 h to examine the temperature dependence of Ni crystallization. No diffraction peak on the as-deposited sample is observed except for the Si substrate peak, and after annealing, the Ni (111) peak emerged together with NiSi peaks. With respect to the standard diffraction angle ∼ 44.51° , a little shift of the Ni (111) peak is observed at ∼ 44.23° , and the lattice constant calculated from the Bragg law is 0.354 nm, which is very close to Ni’ s lattice constant of 0.352 nm. The Ni (111) peak becomes stronger and the full width at half maximum (FWHM) becomes narrower as the annealing temperature increases from 833 to 1033 K. As the temperature increases further, the peak and FWHM weakens and widens. The inset of Fig. 1 shows that the minimum FWHM corresponds to 1033 K, about 0.6Tm of Ni. Via Scherrer’ s formula, the average sizes of the Ni crystal grain, obtained from the FWHM value, are 32.69, 35.22, 37.74, 36.09, and 34.59 nm for the annealing temperatures of 833, 933, 1033, 1133, and 1233 K, respectively. Clearly, the above results indicate that 1033 K (∼ 0.6Tm) is the optimum temperature for Ni crystallization.
 | Fig. 1. XRD spectra of as-deposited Ni films grown with a laser energy density of 10 J/cm2 (a) and post-annealed at 833 (b), 933 (c), 1033 (d), 1133 (e), and 1233 K (f) on Si (100) substrate. The inset shows the FWHM of the Ni (111) diffraction peak as a function of annealing temperature. |
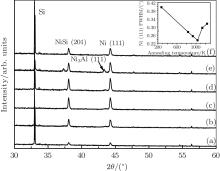
Figure 2 shows the XRD spectra of the Ni– Al films on Si (100) substrates with Al content of 3 wt% and post-annealed at different temperatures. These samples are deposited with a laser energy density of about 7 J/cm2, smaller than that for preparing the pure Ni films. After annealing, the Ni (111) peak becomes stronger and the FWHM becomes narrower as the annealing temperature increases from 833 K to 1033 K, and then becomes weaker and wider as the temperature increases further. The minimum FWHM still corresponds to the annealing temperature of about 0.6Tm of Ni. Compared with the spectrum behavior of pure Ni film (Fig. 1), the position of Ni (111) peak (44.25° ) and the lattice constant (0.354 nm) stay nearly unchanged. The average size of the Ni crystal grain, obtained from the FWHM value, are 30.83, 33.30, 36.19, 28.70, and 26.85 nm for the annealing temperatures of 833, 933, 1033, 1133, and 1233 K, respectively. Although the sizes are obviously smaller than those in the pure Ni films for the same annealing temperatures (see Table 1), the Ni (111) peak and HWFM present the same temperature dependence as shown in Fig. 1. In particular, 0.6Tm is still the best temperature for the crystallization. Unlike Fig. 1, figure 2 shows that the crystal grains of Ni and NiSi form at RT, which should be attributed to lower energy density (7 J/cm2) applied, because slower growth rate benefits the formation of perfect crystal grains.
 | Fig. 2. XRD spectra of Ni– Al films with 3 wt% Al-doping grown with a laser energy density of 7 J/cm2 and post-annealed at 833 (b), 933 (c), 1033 (d), 1133 (e), and 1233 K (f) on Si (100) substrate. The inset shows the FWHM of the Ni (111) diffraction peak as a function of the annealing temperature. |
| Table 1. Grain size (nm) dependence of annealing temperatures (K) for pure Ni and 3 wt% Al-doped Ni. |
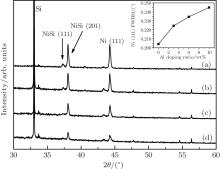
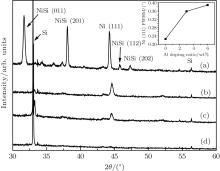
In order to test the dependence of crystallization on Al doping, we deposit Ni– Al films with different Al doping ratios (0, 3 wt%, 6 wt%, and 10 wt%) on Si (100) substrates with a laser energy density of 5 J/cm2, and post-anneal the films at the same temperature, ∼ 0.6Tm. As shown in Fig. 3, the Ni (111) peaks keep nearly the same diffraction angles as shown in Figs. 1 and 2, while the grain size becomes larger. For pure Ni, the crystal grain size is 41.58 nm, which is obviously larger than that (37.74 nm) obtained with a laser energy density of 10 J/cm2 (see the inset of Fig. 1), and for 3-wt% Al doping, the size (37.80 nm) is also larger than that (36.19 nm) with a laser energy density of 7 J/cm2 (see the inset of Fig. 2). This dependence on laser energy density was further confirmed by an experiment with the density increasing up to 10 J/cm2 and the other experimental conditions stay unchanged (see Table 2). As shown in Fig. 4, the Ni (111) peaks for 3-wt% and 6-wt% doping shift to 44.62° and 44.58° , and the grain sizes decrease to 23.71 nm and 21.85 nm, respectively, while for 10-wt% Al-doping, the Ni diffraction peak almost disappears. Clearly, figures 3 and 4 show that the crystallization ability declines due to the increase of Al doping, and more than 6 wt% of Al doping badly weakens the crystallization, which is in good agreement with the prediction of our CP model.[21, 22]
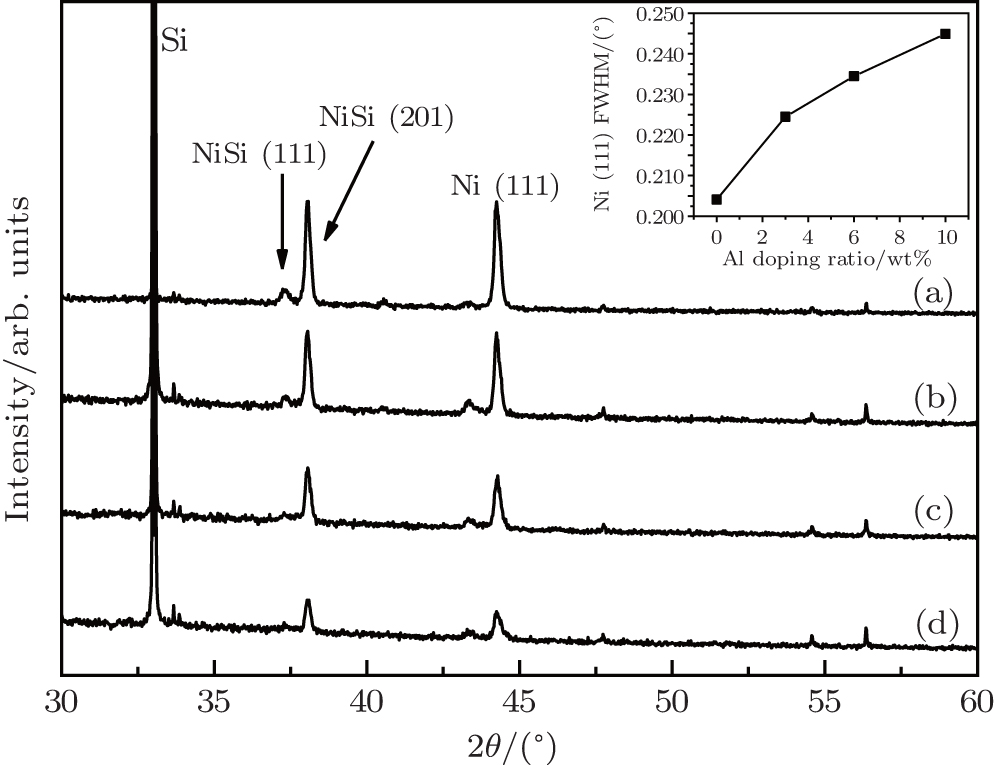 | Fig. 3. XRD spectra of Ni– Al films grown with a laser energy density of 5 J/cm2 and post-annealed at 1033 K with Al-doping of 0 (a), 3 wt% (b), 6 wt% (c), and 10 wt% (d) on Si (100) substrate. The inset shows the FWHM of the Ni (111) diffraction peak as a function of Al doping ratio. |
 | Fig. 4. XRD spectra of Ni– Al films grown with a laser energy density of 10 J/cm2 and post-annealed at 1033 K with Al-doping of 0 (a), 3 wt% (b), 6 wt% (c), and 10 wt% (d) on Si (100) substrate. The inset shows the FWHM of the Ni (111) diffraction peak as a function of Al doping ratio. |
| Table 2. Grain size (nm) dependence of Al doping ratio for different laser density energies. |
Both the experiments with pure Ni and 3-wt% Al doping show that 0.6Tm is the best temperature for crystal growth, and the experiments with different amounts of Al doping indicate that more than 6 wt% of Al doping badly reduces the crystallization, which are all in agreement with our previous theoretical predictions. Actually, in most industrial Ni-based single crystal alloys, the doping of Al is below 6 wt%. These results suggest that 0.6Tm may be an optimum temperature for most crystal growth and the CP model should find wider applications.
The authors are very grateful to Prof. Zheng Qi-Ke, Prof. Ma Li-Dun and Prof. Zhao Li for helpful discussion.
| 1 |
|
| 2 |
|
| 3 |
|
| 4 |
|
| 5 |
|
| 6 |
|
| 7 |
|
| 8 |
|
| 9 |
|
| 10 |
|
| 11 |
|
| 12 |
|
| 13 |
|
| 14 |
|
| 15 |
|
| 16 |
|
| 17 |
|
| 18 |
|
| 19 |
|
| 20 |
|
| 21 |
|
| 22 |
|
| 23 |
|
| 24 |
|
| 25 |
|
| 26 |
|
| 27 |
|
| 28 |
|
| 29 |
|
| 30 |
|
| 31 |
|
| 32 |
|
| 33 |
|
| 34 |
|
| 35 |
|
| 36 |
|
| 37 |
|
| 38 |
|
| 39 |
|
| 40 |
|
| 41 |
|
| 42 |
|
| 43 |
|
| 44 |
|
| 45 |
|
| 46 |
|
| 47 |
|
| 48 |
|