Multifold polar states in Zn-doped Sr0.9Ba0.1TiO3 ceramics
[Guo Yan-Yana) , Guo Yun-Junb) , Wei Tongc) , Liu Jun-Ming†d)  ]
]
]
|
|


†Corresponding author. E-mail: liujm@nju.edu.cn
*Project supported by the National Natural Science Foundation of China (Grant Nos. 11304158, 51431006, 51102277, and 11104118), the Scientific Research Foundation of Nanjing University of Posts and Telecommunications, China (Grant No. NY213020), and the Qing Lan Project of Jiangsu Province, China.
We investigate the effect of Zn doping on the dielectricity and ferroelectricity of a series of polycrystalline Sr0.9− xZn xBa0.1TiO3 (0.0% ≤ x ≤ 5.0%) ceramics. It is surprisingly observed that the Zn doping will produce the multifold polar states, i.e., the Zn-doped ceramic will convert a reduced polar state into an enhanced polar state, and eventually into a stabilized polar state with increasing the doping level x. It is revealed that in the background of quantum fluctuations, the competition between the Zn-doping-induced lattice contraction and the Ba-doping-induced lattice expansion is responsible for both the reduced polar state and the enhanced polar state coming into being. Also, the addition of the antiferrodistortive effect, which is the antipolar interaction originating from the opposite tilted-TiO6 octahedra rotation, represents the core physics behind the stabilized polar state.
Perovskite SrTiO3 (STO) is a well-known quantum paraelectric compound and has been receiving great research attention due to its rich physical properties.[1– 6] Below temperature T = 105 K, the room-temperature cubic perovskite phase transforms into an antiferrodistortive (AFD) tetragonal structure because one of the triply degenerate R25 modes is frozen therein.[3, 4] Further cooling leads to the rapid increasing of dielectric permittivity (ɛ ) and eventually a T-independent plateau appears below T ∼ 4 K, and no ferroelectric (FE) transition is detected even though T is down to the lowest limit value available so far.[1– 5] This effect arises from the quantum fluctuations (QFs) of ionic positions, which have a negative effect on the ordered distribution of ionic displacements, suppressing the appearance of the FE state and leading to a deviation of ɛ (T) from the Curie– Weiss law and the absence of any dielectric peak.
Massive amounts of research on tuning the QFs in STO have been reported, so that the FE instability hidden in the cloud of QFs can be disclosed in response to intrinsic and external stimulus. In fact, a number of approaches have been attempted along this line, and a series of STO-based materials has drawn substantial attention in recent decades.[2, 7– 14] Without doubt, isovalent A-site substitution has been the most frequent featured approach to induce the ferroelectricity at low T.[11– 14] It is understood that such an A-site substitution, even at low level, would induce remarkable lattice distortions, thus resulting in tremendous and attractive changes in the electric property.
A widely accepted criterion is that the small ion substitution at the A-site would lead to certain off-center ionic displacement in the tilted-TiO6 octahedron in accommodating the difference in radius between the substituting ions and A-site host ions.[11– 13] The ordering of these off-center dipole moments, if it takes place, and corresponding reorientation dynamics are considered to have a drastic influence on the electric property, such as generating a nonzero FE polarization (P). But this is not the case for the substitution of Sr by Ba since the radius of Ba2+ ion (0.135 nm) is significantly larger than that of Sr2+ (0.118 nm).[15] The lattice distortion due to the Ba2+ substitution would induce an electrical quadrupole moment instead of an off-center displacement, and these moments interact with each other and eventually the FE ordering is developed.[16– 22]
Therefore, the lattice distortions and electric properties of these doped STO systems are closely related to the radii of the substituting ions. In view of the much smaller ion radius of Zn2+ (0.74 nm), [15] one could expect that the Zn doping at the Sr site may adjust lattice distortion and allow additional off-center dipole moments, leading to the rich phenomena and physics. In this work, we pay our attention to the polar state in Zn-doped Sr0.9Ba0.1TiO3 (SBTO) in general, and to the effect of Zn doping in terms of the coupling and competition between the multifold interactions in particular. Along this line, we synthesize a series of Zn-doped SBTO samples and investigate the crystal structure, dielectric and ferroelectric properties.
A series of polycrystalline Sr0.9− xZnxBa0.1TiO3 (SZBTO) (0.0% ≤ x ≤ 5.0%) ceramics was synthesized by the conventional solid-state reaction route. According to the stoichiometric ratios, highly purified powders SrCO3 (99.99%), BaCO3 (99.99%), TiO2 (99.99%), and ZnO (99.99%) were weighed, ball-mixed for 24 h in alcohol, ground after drying, and then calcined at 1150 ° C for 10 h in air. The resulting powders were reground and further pressed under 20 MPa into disks of 20 mm in diameter and 2 mm in thickness. The samples were sintered at 1400 ° C for 6 h in air.
Room-temperature x-ray diffraction (XRD) with Cu Kα radiation was used to check the phase and structure. The diffraction data were structurally refined using the general structure analysis system (GSAS) program. Gold electrodes were sputtered on polished sample surfaces for electric measurements. The dielectric property was measured using the HP4294A impedance analyzer by inserting the samples into the Janis closed-cycle refrigerator system (Janis Research Company, Inc., USA) in a temperature range of 4 K– 300 K with a rate of 2 K/min. The test signal amplitude was 100 mV and the signal frequency varied from 100 Hz to 1 MHz. The polarization– electric field (P– E) hysteresis loops were measured using the RT6000HVS standard ferroelectric testing unit.
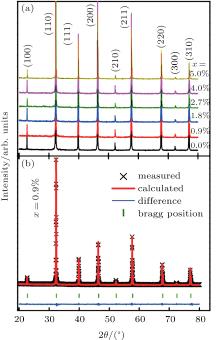
Before presenting the electrical data, we check the microstructures of all the as-prepared samples. For clarity, figure 1(a) only presents the XRD patterns for Sr0.9− xZnxBa0.1TiO3 with Zn doping levels x = 0.0%, 0.9%, 1.8%, 2.7%, 4.0%, and 5.0%. As shown in Fig. 1(a), various samples have single cubic perovskite structures at room temperature and no extra phase can be observed within the apparatus resolution. The sharp diffraction peak indicates the excellent crystallinity.
The high-precision Rietveld refinements of the XRD data are performed. A representative Rietveld refining is plotted in Fig. 1(b) for x = 0.9%. The difference between the measured spectrum and calculated one is small, indicating they are in good agreement with each other (Rp = 5.08%, Rwp = 7.26%). For the other samples, the obtained Rp and Rwp are at a similar level. Furthermore, one can evaluate the lattice parameters and volume from the structure refinement data. Table 1 displays the lattice parameters and volumes for SZBTO samples with x = 0.0%, 0.9%, 1.8%, 2.7%, 4.0%, and 5.0%. In comparison with SBTO (x = 0.0%) itself, the lattice parameters (a, b, and c) gradually decrease with increasing the value of x as identified in Table 1. A resulting decrease in volume is also observed, indicating the lattice shrinkage. This is reasonable due to the small ionic radius of Zn2+ .[15] This fact is crucial for understanding the doping-induced change in electric property, and presented below.
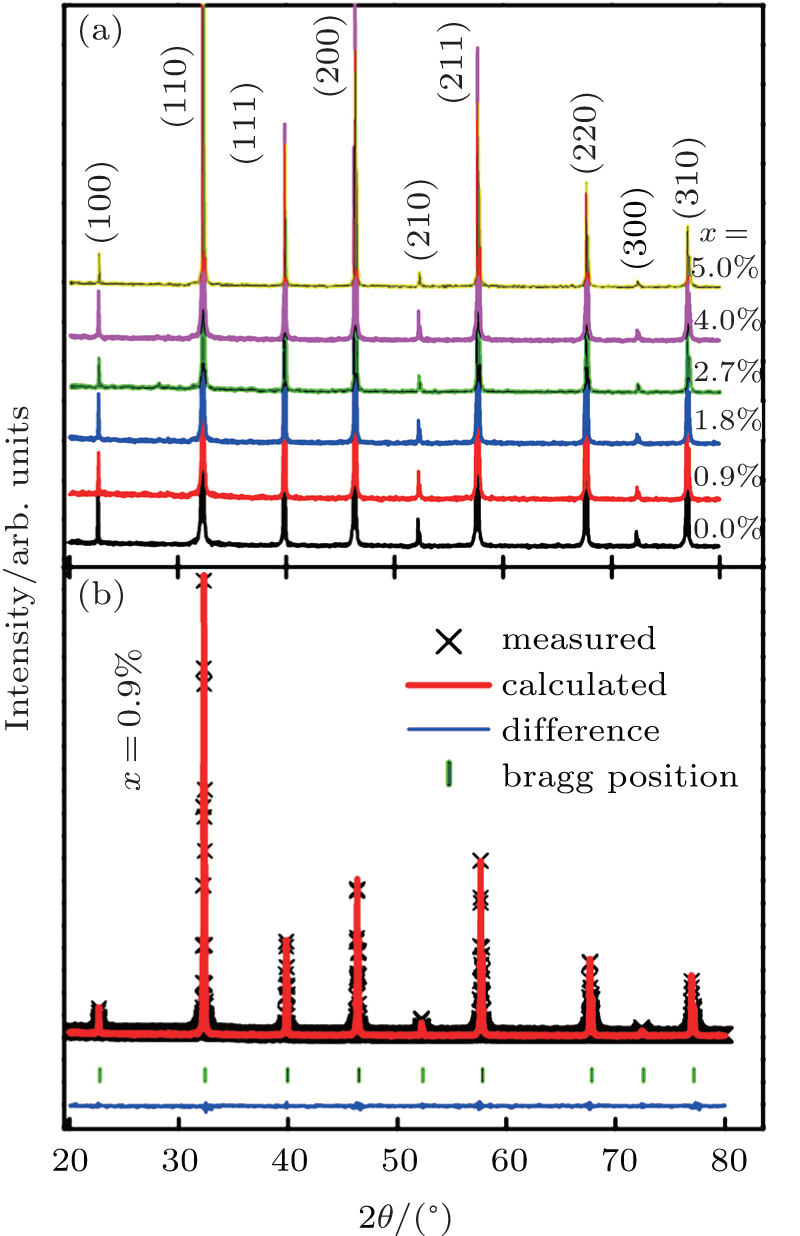 | Fig. 1. (a) Room temperature x-ray diffraction patterns for some SZBTO samples with Zn doping levels x= 0.0%, 0.9%, 1.8%, 2.7%, 4.0%, and 5.0%. (b) The Rietveld refinement for the x = 0.9% sample. |
| Table 1. Lattice parameters and volumes for SZBTO samples with x = 0.0%, 0.9%, 1.8%, 2.7%, 4.0%, and 5.0%. |
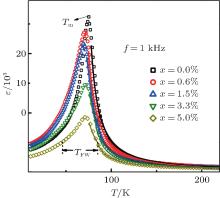
Figure 2 displays the variations of dielectric permittivity ɛ with T for samples x = 0.0%, 0.6%, 1.5%, 3.3%, and 5.0%, measured at a frequency f = 1 kHz of the ac-signal. The temperature of the dielectric constant maximum Tm is taken as the phase transition temperature as shown in Fig. 2. As is well known, ɛ (T) of SrTiO3 increases monotonically with T decreasing and subsequently exhibits a broad plateau without dielectric anomaly, which is a typical quantum para-electric behavior.[1– 5] However, for SBTO (x = 0.0%), a sharp dielectric anomaly at TC ∼ 74 K is observed in Fig. 2, which is corresponding to the FE transition and consistent with the earlier experimental result.[16] It reveals that the Ba doping does induce FE behavior.[17, 18]
 | Fig. 2. Measured T-dependences of dielectric constant ɛ at 1 kHz for SZBTO with x = 0.0%, 0.6%, 1.5%, 3.3%, and 5.0%. The solid curves represent the fitting results from the Barrett equation. |
Now, we focus on the effect of Zn doping on ɛ (T) as plotted in Fig. 2. The evolution of ɛ (T) is characterized by the following features. With increasing x, the dielectric permittivity ɛ is continuously suppressed in amplitude. Most intriguingly, with increasing substitution level x, the dielectric peak position Tm shifts towards the low-T side, then towards the high-T side, and finally becomes unchanged. Furthermore, the variation of the dielectric peak width is also interesting. As a quantitative measure, we evaluate the full width at half maximum of dielectric peak TFW as shown in Fig. 2.
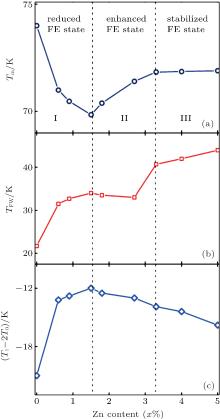
For a clearer illustration of the Zn-doping effect, we plot parameters Tm and TFW as a function of x for all the samples in Figs. 3(a) and 3(b). It is seen that the effect of Zn-doping on ɛ can be reflected by three distinct regions. In region I, roughly between 0.0% < x < 1.5%, Tm decreases gradually and TFW increases gradually with increasing x. This indicates that a small amount of Zn doping will suppress the FE ordering. We refer to this region as the reduced FE state. In region II, roughly between 1.5% < x < 3.3%, one can clearly observe a remarkable increase of Tm and a small reduction of TFW with increasing x, suggesting that the FE state is gradually enhanced. With further increasing x (3.3% < x < 5.0%), TFW increases gradually in this region III. However, Tm is found to become independent of the concentration x, suggesting that the FE state in region III is stabilized. The above phenomena illustrate clearly the fact that for SBTO (x = 0.0%), a system with a favored FE state, the Zn doping at the Sr site will lead to the occurrence of a multifold polar state, i.e., a reduced FE state is converted into an enhanced FE state, and eventually into the stabilized FE state with increasing substitution level x.
To quantitatively understand the variations of multifold polar states, we consult the Barrett equation on dielectric behavior:[23]

where C is the Curie constant, T1 represents the tunneling integral, and T0 is the transition temperature where the lattice instability would occur in the absence of QFs. The excellent fittings of the ɛ (T) data are given by the solid lines in Fig. 2 and the fitted parameter (T1– 2T0) is plotted in Fig. 3(c) as a function of Zn content x. One can observe a significant increase of (T1– 2T0) with x until x = 1.5%, at which (T1– 2T0) reaches its maximum, followed by a continual decrease. For SBTO (x = 0.0%), the negative (T1– 2T0) is an indication of the FE state, while the Zn doping favors the growth of (T1– 2T0), suggesting the FE ordering becomes weak compared with QFs.[1, 12, 23] Therefore, we conclude that a small amount of Zn doping could reduce the FE ordering in SZBTO (1.5% > x > 0.0%). However, when the doping content of Zn continues to increase, (T1– 2T0) shows a continual reduction as shown in Fig. 3(c). This suggests that as x increases (5.0% > x > 1.5%), the FE ordering becomes stronger compared with QFs.[1, 12, 23]
 | Fig. 3. (a) Evaluated dielectric peak position Tm, (b) evaluated full width at half maximum of dielectric peak TFW, and (c) Barrett equation parameter (T1– 2T0), each as a function of Zn content x. |
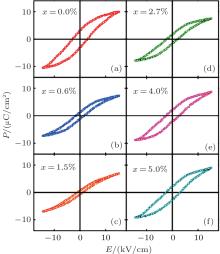
The polar nature is further confirmed by measuring the ferroelectric hysteresis loops. Figure 4 shows the measured P-E loops for samples with x = 0.0%, 0.6%, 1.5%, 2.7%, 4.0%, and 5.0% at T = 30 K. Compared with SBTO (x = 0.0%) (Fig. 4(a)), the ferroelectricity could be gradually suppressed by Zn doping as shown in Figs. 4(b) and 4(c), with x increasing up to 1.5%, where the thin P– E loops are observed with reducing saturated polarization PS, remnant polarization Pr and coercivity Ec. It is interesting that further increasing x, however, results in the increases of both PS and Pr, indicating the gradual enhancement of polar state with further increasing x. Moreover, one can observe that the difference in P– E loop between sample x = 4.0% and sample x = 5.0% is very small, suggesting that the FE state is stabilized for high substitution level x. These results are self-consistent with the above dielectric data.
 | Fig. 4. Measured P– E loops at T = 30 K for various samples with Zn-doping levels labeled in panels (a)– (f), respectively. |
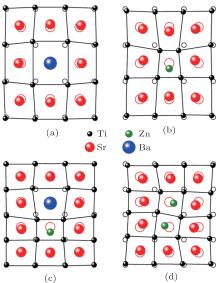
To understand the phenomena revealed above, one may consult to the possible underlying mechanisms. A widely accepted viewpoint now is that the FE behavior in the SBTO system is associated with quadrupole moments.[16– 22] More specifically, besides the expansions of Ba-doped STO cells, the Ba doping at the Sr site could also cause the surrounding lattice to expand due to the large ionic radius of Ba as shown in Fig. 5(a). The expansions of Ba-doped cells and the surrounding lattice could induce quadrupole moments, which contribute to the FE ordering.[16– 22] In the same way, the smaller Zn doping at the Sr site would result in the contractions of the lattices, which could induce off-center dipole moments[11– 13] as presented in Fig. 5(b). As a result, the lattice expansion induced by Ba doping would be gradually weakened and released by the lattice contraction induced by Zn doping, and vice versa, as shown in Fig. 5(c). Therefore, the corresponding FE ordering induced by the whole lattice distortions will decrease. Note that the mutual offset effect weakens the lattice distortions, which does slightly affect the quadrupole in Ba-doped cells and the off-center dipole in Zn-doped cells. Thus it could be argued that in region I (1.5% > x > 0.0%), the very low-level Zn doping just slightly reduces the ferroelectricity of the system. As x increases (3.3% > x > 1.5%), the effect of lattice contraction induced by Zn doping will exceed lattice expansion induced by Ba doping, resulting in the whole lattice contraction. Furthermore, the lattice contraction degree intensifies with increasing x as identified in the above xray diffraction patterns (Fig. 1(a)) and the refinement data (Table 1). Meanwhile, the off-center dipole ordering originating from the contractions of Sr-doped cells becomes also stronger and stronger with increasing x. Therefore, the FE ordering of the system is gradually enhanced again with increasing x, and characterized by the upward shifting of Tm and the narrowed peak width of ɛ (T) as a function of doping level x (Figs. 3(a) and 3(b)).
 | Fig. 5. Sketch graphs for lattice distortions in Ba-doped and Zn-doped STO lattice, showing (a) Ba-doping-induced lattice expansion, (b) Zn-doping-induced lattice contraction, (c) mutual offset effect between Zn-doping-induced lattice contraction and Ba-doping-induced lattice expansion, and (d) two neighboring Zn-doped cells with the TiO6 octahedra tilted in opposite directions. |
If the substitution level x is not high, the dopant ions are spatially separated and thus the interdopant correlation is negligible. However, the further increasing of x would lead to the neighboring of these dopant cells and thus the interdopant interaction can no longer be ignored, which must be taken into account in the high-x range (5.0% > x > 3.3%). As reported in our previous article, [24] the two neighboring TiO6 octahedra may intend to rotate in the opposite directions so as to maintain the stability of the lattice, i.e., an energy minimum. Such an opposite rotation of tilted-TiO6 octahedra can be seen as a local AFD effect, which would induce an antipolar cluster in the neighboring dopant cells and suppress the FE ordering, as shown in Fig. 5(d). Consequently, in region III (5.0% > x > 3.3%), the AFD effect originating from the antipolar interaction between the neighboring dopant cells competes with the FE ordering in the background of QFs. Eventually, the FE state is stabilized, and characterized by the almost constant Tm and the broadened dielectric peak (Figs. 3(a) and 3(b)).
In this work, we synthesize a series of Zn-doped SBTO ceramics by the conventional solid-state reaction route and perform the crystal structure, dielectric and ferroelectric properties measurements. The Zn-occupied Sr site surprisingly induces the multifold polar states to appear, i.e., a reduced FE state is converted into the enhanced FE state, and eventually into the stabilized FE state when increasing substitution level x. The core physics behind the reduced FE state is the mutual offset effect reflected in the whole lattice distortions. The Zn-doping-induced off-center dipole ordering is responsible for the enhanced polar state. The addition of the antiferrodistortive effect in the high-x range, which is the antipolar interaction originating from the opposite rotations of tilted-TiO6 octahedra, represents the core physics behind the stabilized polar state.
| 1 |
|
| 2 |
|
| 3 |
|
| 4 |
|
| 5 |
|
| 6 |
|
| 7 |
|
| 8 |
|
| 9 |
|
| 10 |
|
| 11 |
|
| 12 |
|
| 13 |
|
| 14 |
|
| 15 |
|
| 16 |
|
| 17 |
|
| 18 |
|
| 19 |
|
| 20 |
|
| 21 |
|
| 22 |
|
| 23 |
|
| 24 |
|