


Magnetocaloric effects in RTX intermetallic compounds ( R = Gd–Tm, T = Fe–Cu and Pd, X = Al and Si)
[Zhang Hu†a), b)  , Shen Bao-Gen‡
b) ]
, Shen Bao-Gen‡]
|
|


†Corresponding author. E-mail: zhanghu@ustb.edu.cn
‡Corresponding author. E-mail: shenbg@aphy.iphy.ac.cn
*Project supported by the National Natural Science Foundation of China (Grant Nos. 51371026, 11274357, and 51327806) and the Fundamental Research Funds for the Central Universities (Grant Nos. FRF-TP-14-011A2 and FRF-TP-15-002A3).
The magnetocaloric effect (MCE) of RTSi and RT Al systems with R = Gd–Tm, T = Fe–Cu and Pd, which have been widely investigated in recent years, is reviewed. It is found that these RTX compounds exhibit various crystal structures and magnetic properties, which then result in different MCE. Large MCE has been observed not only in the typical ferromagnetic materials but also in the antiferromagnetic materials. The magnetic properties have been studied in detail to discuss the physical mechanism of large MCE in RTX compounds. Particularly, some RTX compounds such as ErFeSi, HoCuSi, HoCuAl exhibit large reversible MCE under low magnetic field change, which suggests that these compounds could be promising materials for magnetic refrigeration in a low temperature range.
Nowadays, magnetic materials have been widely used and impact almost every aspect in our society from household appliances to aerospace sciences. The functional magnetic materials, in particular, such as permanent magnets, soft magnets, and magnetic shape memory alloys, have played an essential role in the development of modern society. In recent years, magnetic refrigeration based on the magnetocaloric effect (MCE) has been demonstrated to be a novel application of functional magnetic materials. Compared with conventional gas compression-expansion refrigeration, magnetic refrigeration has attracted considerable attention due to its great advantages in many aspects such as energy saving and environmental friendliness.[1– 3] As the core part of magnetic refrigeration technique, the magnetocaloric properties of magnetic materials greatly affect the performance of a magnetic refrigerator, and thus, it is important to develop magnetic refrigerants with large MCE.
Since the discovery of giant MCE in Gd5(Si1– xGex)4, [4] a great deal of effort has been made to find suitable refrigerants for room temperature magnetic refrigeration.[5– 13] On the other hand, it is also significant to search for suitable materials exhibiting large MCE at low temperature, due to their potential applications in gas liquefaction and scientific research.[2, 14] Usually, the magnitude of MCE can be characterized by magnetic entropy change (Δ SM) and/or adiabatic temperature change (Δ Tad) upon the variation of magnetic field. Thermodynamic analysis reveals that the maximum magnetic entropy value (SM) per mole of magnetic ions is equal to SM = R ln(2J + 1), where R is the universal gas constant and J is the total angular momentum of a magnetic ion.[1] Therefore, a large Δ SM can be usually expected in the heavy rare earth-based materials due to the high magnetic moments of heavy rare-earth atoms.
In the past few years, many different rare earth (R) — transition metal (T) intermetallic systems have been reported to exhibit large MCE in a wide temperature range.[14– 16] Among them, the ternary intermetallic RTX compounds (R = rare earth, T = transitional metal, X = p-block metal) have been studied extensively due to their interesting physical properties and large MCE. It has been found that the magnetic moments of RTX compounds are mainly contributed by the rare earth atoms, while the T and X atoms hardly contribute to the magnetic moments due to the hybridization between d states of T and p states of X atoms. However, the crystallographic structure would change with the variation of either T or X atoms, thus also affecting the magnetic properties and MCE of RTX compounds. Very recently, Gupta et al.[17] reviewed the magnetic and related properties of RTX compounds, and briefly discussed the MCE. In the present paper, we give a comprehensive overview of the studies on the MCE of RTX intermetallic compounds (R = Gd– Tm, T = Fe– Cu and Pd, X = Al and Si), and this would be highly beneficial for the future research on the MCE of RTX compounds.
Table 1 lists the nature of magnetic ground state, the ordering temperature Tord, and the magnetocaloric properties for RTSi (R = Gd– Er, T = Fe– Cu) compounds. It is seen that the RFeSi and RCoSi compounds order ferromagnetically except HoFeSi, while the RNiSi and RCuSi compounds exhibit antiferromagnetic (AFM) ground state. The ordering temperature Tord decreases with the rare earth atom sweeping from Gd to Er. In contrast, the MCE increases greatly with the variation of rare earth atom from Gd to Er. It is interesting that large MCE can be observed not only in ferromagnetic (FM) RTSi but also in AFM RTSi compounds, which show field-induced metamagneic transition from AFM to FM states.
| Table 1. Magnetocaloric properties of RTSi (R = Gd– Er, T = Fe– Cu) compounds. |
In the following sections, the magnetocaloric properties of RTSi compounds, especially the ones with large MCE, will be discussed in detail.
The crystal structure of CeFeSi and related compounds was first investigated by Bodak et al. in 1970, [18] and they found that these compounds crystallize in the tetragonal CeFeSi-type structure (space group P4/nmm). In 1992, Welter et al.[19] studied the magnetic properties of RFeSi (R = La– Sm, Gd– Dy) compounds by susceptibility measurements and neutron diffraction studies. It was found that the RFeSi (R = Gd, Tb, and Dy) exhibit the FM state below their respective TC. Later, Napoletano et al.[20] reported that GdFeSi undergoes a FM-paramagnetic (PM) transition around 118 K and presents a large – Δ SM of 22.3 J/kg· K and Δ Tad of 4.5 K for a high field change of 9 T. Especially, it shows a giant refrigerant capacity (RC) value of 1940 J/kg in the 10 K– 160 K temperature range for a field change of 9 T. Recently, Zhang et al.[14, 21, 22] investigated the magnetic properties and MCE of RFeSi (R = Gd– Er) compounds systematically. The maximum – Δ SM values of GdFeSi are 6.0 J/kg· K and 11.3 J/kg· K for the field changes of 2 T and 5 T, respectively. In addition, the RC value, calculated by integrating numerically the area under the Δ SM– T curve with defining the temperatures at half maximum of peak as the integration limits, [23] is obtained to be 373 J/kg for a field change of 5 T.
Figure 1 shows the temperature (T) dependence of zero-field-cooling (ZFC) and field-cooling (FC) magnetizations (M) under 0.05 T for RFeSi (R = Gd-Er) compounds.[14, 21, 22] An obvious difference between ZFC and FC curves appears below the ordering temperature for RFeSi compounds except GdFeSi, which may be due to the domain-wall-pinning effect as usually observed in materials with low ordering temperature and high anisotropy.[14, 24] The RFeSi (R = Tb and Dy) compounds experience a second-order FM– PM transition around the respective TC of 110 K and 70 K for TbFeSi and DyFeSi, which are quite close to the liquefaction temperatures of natural gas (111 K) and nitrogen (77 K).[21] In addition, an unusual discrepancy between ZFC and FC curves can be observed in PM state of RFeSi (R = Tb and Dy) compounds, suggesting the existence of short-range FM correlations just above TC.[25] The magnetic entropy change SM of RFeSi (R = Tb and Dy) was calculated from the magnetization isotherms by using the Maxwell relation 
 | Fig. 1. Temperature dependence of ZFC and FC magnetizations under 0.05 T for RFeSi (R = Gd– Er) compounds. The inset shows a close view of the M– T curves of TbFeSi and DyFeSi in the PM state.[14, 21, 22] |
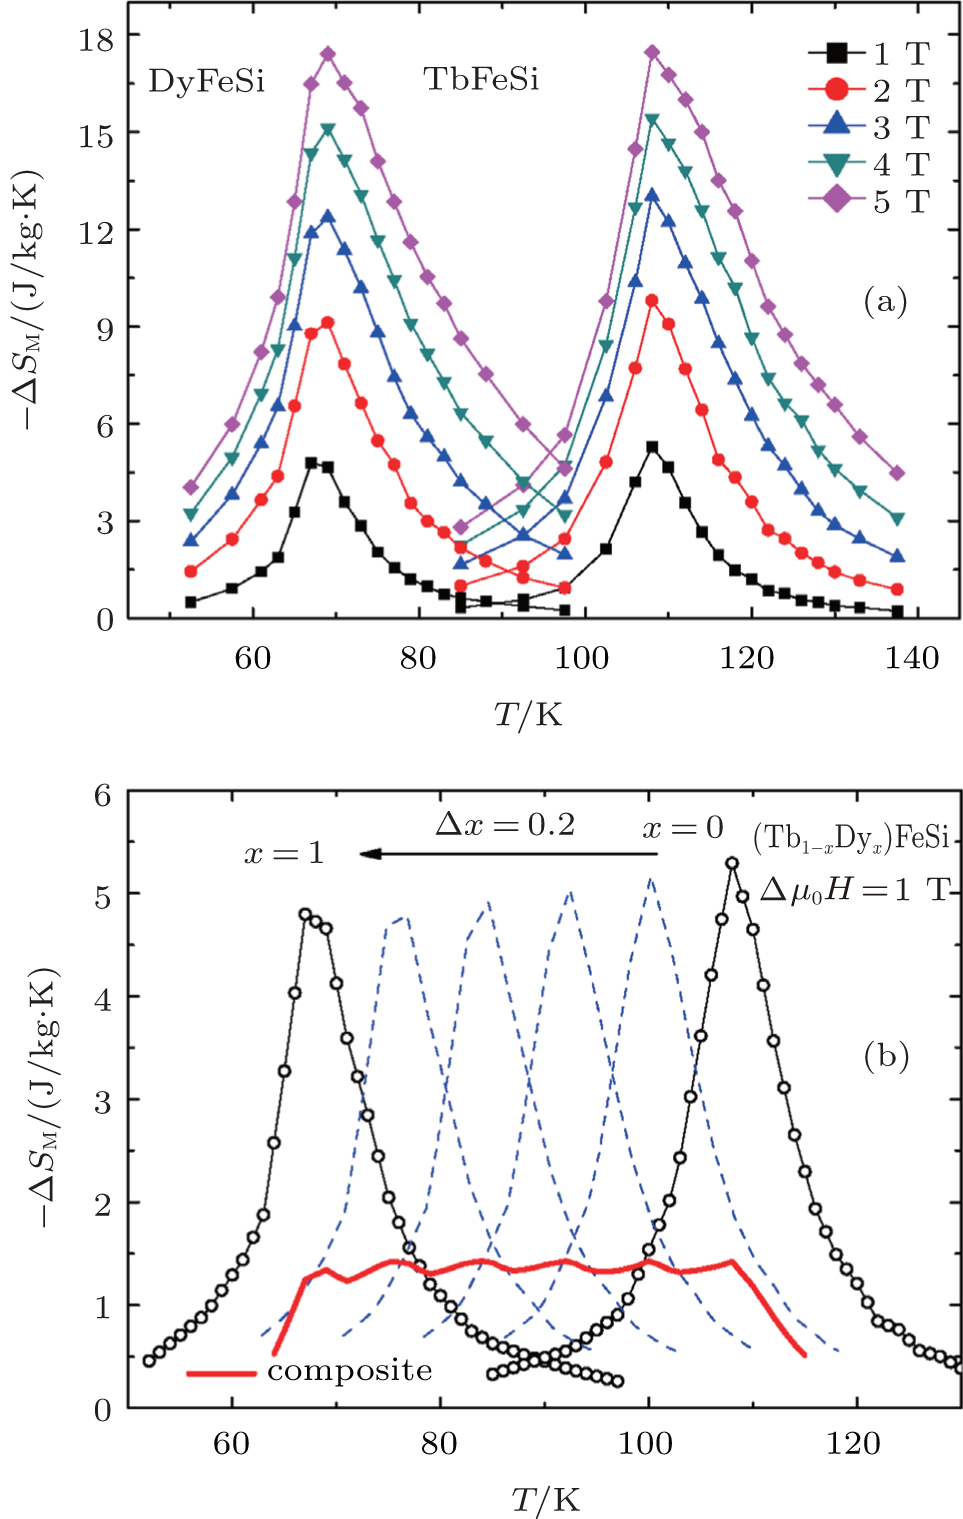 | Fig. 2. (a) Temperature dependence of Δ SM for RFeSi (R = Tb and Dy) under different magnetic field changes up to 5 T. (b) Temperature dependence of calculated Δ SM for (Tb1− xDyx)FeSi (x = 0– 1) compounds and the composite material under a magnetic field change of 1 T.[21] |
Figure 2(b) shows the temperature dependence of calculated Δ SM of (Tb1– xDyx)FeSi compounds for a field change of 1 T.[21] Furthermore, a composite material can be formed based on this series of (Tb1– xDyx)FeSi compounds and the optimum mass ratio yi of each component, determined by using a numerical method, [27] is as follows: y1 = 19.43 wt%, y2 = 13.32 wt%, y3 = 13.47 wt%, y4 = 13.74 wt%, y5 = 15.08 wt%, and y6 = 24.96 wt% for x = 0, 0.2, 0.4, 0.6, 0.8, and 1.0, respectively. The Δ SM of this composite is estimated by using the equation 
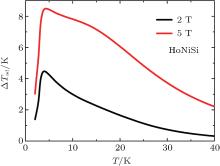
Figure 3 shows the temperature dependence of Δ SM and Δ Tad of ErFeSi for different magnetic field changes.[14] Here, the Δ Tad was calculated from the heat capacity (CP) curves by using the equation Δ Tad (Δ H, T) = [T(S)H − T(S)0]S. [26] For a magnetic field change of 5 T, the maximum values of – Δ SM and Δ Tad around the TC = 22 K are 23.1 J/kg· K and 5.7 K, respectively. Particularly, the – Δ SM and RC reach as high as 14.2 J/kg· K and 130 J/kg, respectively, for a relatively low field change of 2 T. This large MCE around liquid hydrogen temperature (20.3 K) indicates that ErFeSi could be a promising material for magnetic refrigeration of hydrogen liquefaction.
 | Fig. 3. Temperature dependence of (a) Δ SM and (b) Δ Tad for ErFeSi under different magnetic field changes.[14] |
Unlike other RFeSi compounds with FM ground state, HoFeSi exhibits a complex magnetic structure with FM and AFM/ferrimagnetic (FIM) moments at low temperatures. With the decrease of temperature, HoFeSi undergoes a PM– FM transition at TC = 29 K. Besides, another anomaly is found at Tt = 20 K, which indicates that some magnetic moments in HoFeSi may experience an FM– AFM/FIM transition around Tt.[22]
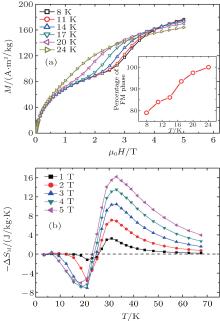
Figure 4(a) shows the magnetization isotherms of HoFeSi in the temperature range of 8 K– 24 K.[22] It is seen that the magnetization below 20 K increases greatly at first with increasing magnetic field, corresponding to the typical FM behavior. A field-induced metamagnetic transition occurs at critical field with further increase of field, suggesting the possible presence of AFM or FIM components at low temperatures in HoFeSi compound. The fraction of FM components, estimated by extrapolating the plateau of FM state to 5 T, is about 79% at 8 K and reaches nearly 100% when temperature increases to 24 K (see inset of Fig. 4(a)). The temperature dependence of Δ SM for HoFeSi under different magnetic field changes is shown in Fig. 4(b).[22] It is noted that HoFeSi presents negative Δ SM peak (normal MCE) around TC as well as positive Δ SM (inverse MCE) around Tt. For a relatively low field change of 2 T, the Δ SM values are 5.6 J/kg· K at Tt and – 7.1 J/kg· K at TC, respectively. This special feature of successive inverse and normal MCE in HoFeSi could be applied in some refrigerators with special designs and functions, which other materials with only normal MCE cannot satisfy.[28]
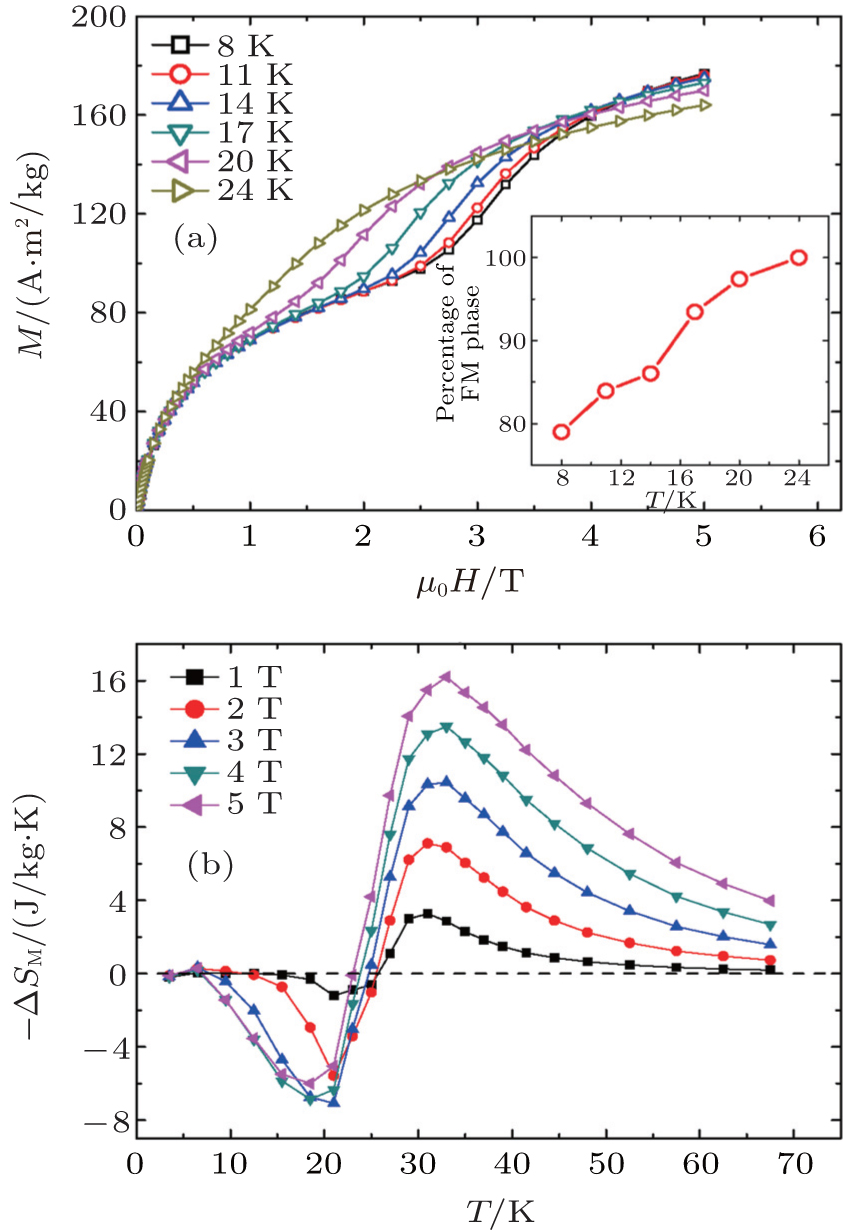 | Fig. 4. (a) Magnetization isotherms of HoFeSi compound in the temperature range of 8 K– 24 K. The inset shows the fraction of FM phase as a function of temperature estimated from magnetization isotherms. (b) Temperature dependence of magnetic entropy change Δ SM for HoFeSi compound under different magnetic field changes up to 5 T.[22] |
The crystal structures and magnetic properties of RCoSi compounds vary with the rare earth elements. Neutron diffraction studies reveal that RCoSi (R = Gd and Tb) crystallize in the tetragonal structure of CeFeSi-type (space group P4/nmm) and order antiferromagnetically below TN of 175 K and 140 K for R = Gd and Tb, respectively.[29] However, RCoSi (R = Dy, Ho, and Er) compounds have been reported to crystallize in the orthorhombic TiNiSi-type crystal structure and exhibit PM– FM transition at low temperatures.[30– 32] Leciejewicz et al.[31] investigated the magnetic structure of HoCoSi by neutron diffraction and found that the magnetic moments order ferromagnetically below TC = 13 K. Besides, the magnetic moments of Ho atoms form a conical spiral at 1.7 K, leading to the coexistence of the collinear FM structure and helicoidal structure.
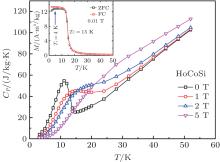
In 2012, Xu et al.[32] further investigated the MCE of HoCoSi compound systematically by magnetization and heat capacity measurements. Figure 5 displays the heat capacity (CP) curves for HoCoSi under different magnetic fields.[32] A distinct λ -type peak is observed around 11.2 K in zero field, corresponding to the second-order FM– PM transition. In addition, another anomaly is observed at Tt = 4 K in the thermomagnetic curve (inset of Fig. 5), corresponding to the critical temperature of the coexistence of the collinear FM structure and helicoidal structure. With the increase of magnetic field, the peak gradually becomes broader and lower while it also moves to a slightly higher temperature, suggesting the typical characteristic of ferromagnet.[1] Based on the theory of thermodynamics, the Δ SM and Δ Tad values can be calculated from the CP curves by using the following equations 
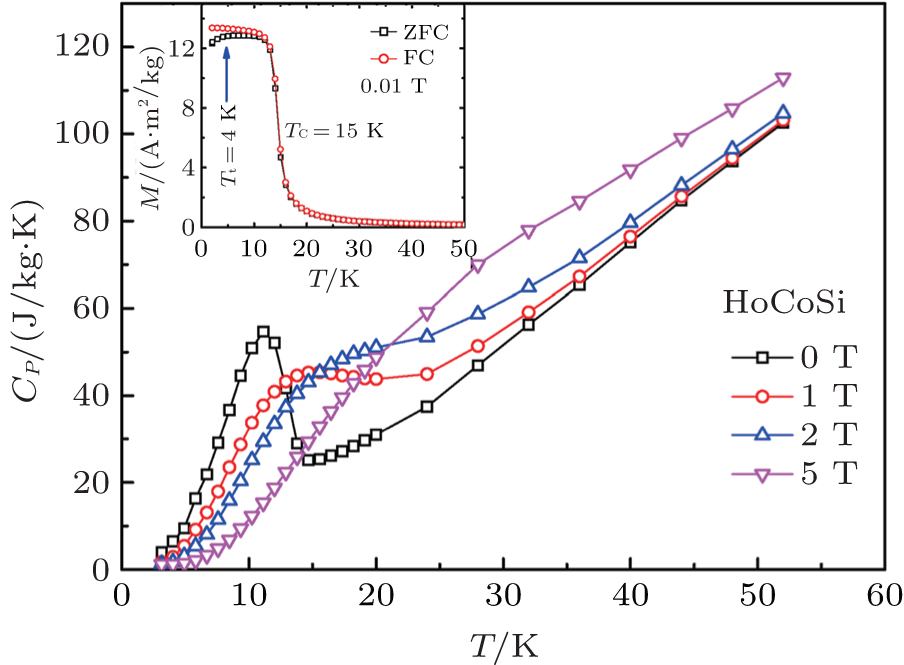 | Fig. 5. Heat capacity (CP) curves for HoCoSi under different magnetic fields. The inset shows the temperature dependence of ZFC and FC curves for HoCoSi under the magnetic field of 0.01 T.[32] |
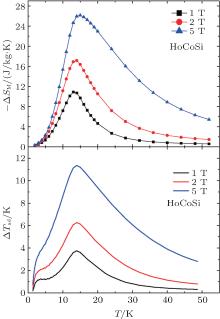
 | Fig. 6. Temperature dependence of (a) Δ SM and (b) Δ Tad for HoCoSi under different magnetic field changes.[32] |
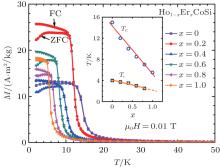
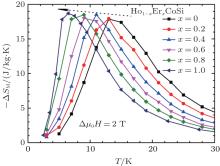
Xu et al.[32] further studied the effect of Er substitution on the magnetic and magnetocaloric properties in (Ho1– xErx)CoSi compounds. Figure 7 shows the temperature dependence of ZFC and FC magnetizations under 0.01 T for (Ho1– xErx)CoSi compounds.[32] In addition to the FM– PM transition around TC, all (Ho1– xErx)CoSi compounds except ErCoSi exhibit another anomaly at lower temperature Tt, which is related to the presence of magnetic helicoidal structure. It is clearly seen that the transition temperatures decrease linearly with the Er content increasing from 0 to 1 (inset of Fig. 7). Figure 8 shows the temperature dependence of Δ SM for (Ho1– xErx)CoSi compounds under a field change of 2 T.[32] For a field change of 2 T, the maximum – Δ SM values are 17.9, 17.9, 18.2, 18.0, 18.5, and 18.7 J/kg· K for x = 0, 0.2, 0.4, 0.6, 0.8, and 1, respectively. It can be seen that (Ho1– xErx)CoSi compounds exhibit nearly the same magnitude of MCE with increasing Er content. Meanwhile, the TC decreases from 15 K to 5.5 K with the variation of x from 0 to 1. Therefore, a composite material can be constructed based on this series of (Ho1– xErx)CoSi compounds and exhibits a constant Δ SM in the temperature range of 5.5 K– 15 K, satisfying the requirement of Ericsson-cycle magnetic refrigeration. Similar research has also been carried out in (Ho1– xDyx)CoSi compounds.[32] However, single phase with tetragonal CeFeSi-type structure can not be obtained when Dy content is higher than 0.4, due to the presence of DyCo2Si2 phase impurity. It is found that the TC decreases from 15 K for x = 0 to 5 K for x = 0.4 in (Ho1– xDyx)CoSi compounds.
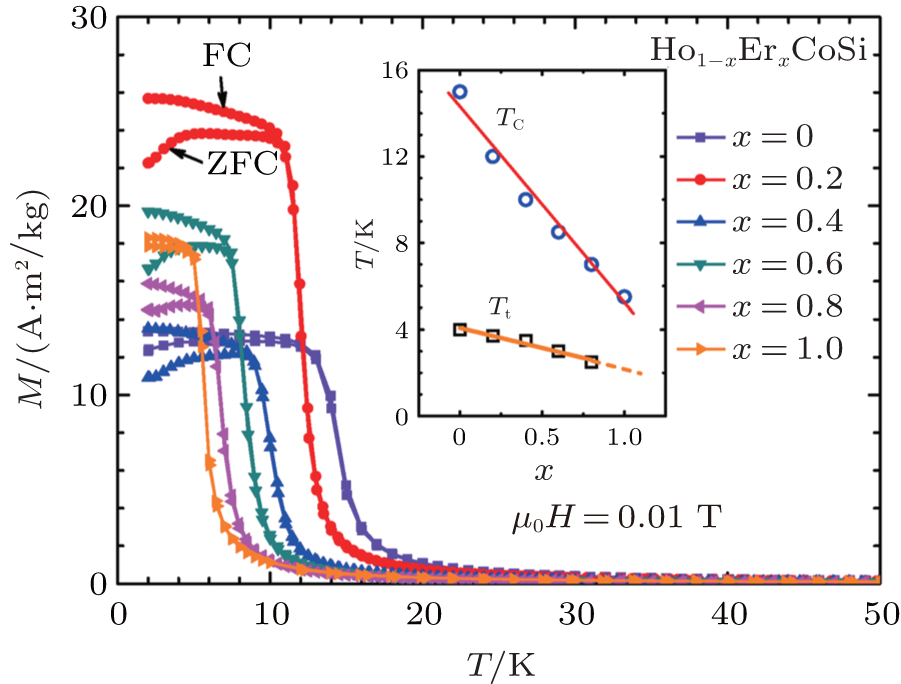 | Fig. 7. Temperature dependence of ZFC and FC magnetizations under 0.01 T for (Ho1– xErx)CoSi compounds. The inset shows the transition temperatures as a function of as a function of x.[32] |
 | Fig. 8. The temperature dependence of Δ SM for (Ho1– xErx)CoSi compounds under a magnetic field change of 2 T.[32] |
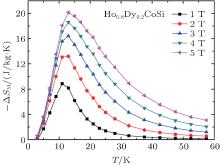
Figure 9 shows the temperature dependence of Δ SM for Ho0.8Dy0.2CoSi compound under different magnetic field changes.[32] For a magnetic field change of 5 T, Ho0.8Dy0.2CoSi exhibits a maximum – Δ SM value of 20.2 J/kg· K around TC = 12 K. The reduction of MCE is due to the fact that the introduction of Dy atoms would result in the competition of FM coupling of Ho moments and AFM coupling of Dy moments, thus lowering the saturation magnetization and MCE of (Ho1– xDyx)CoSi compounds.
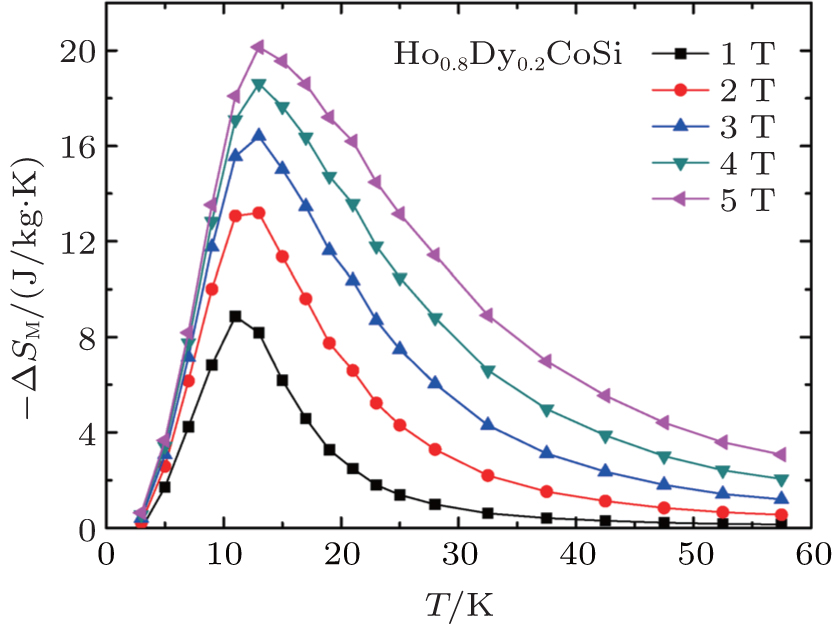 | Fig. 9. Temperature dependence of Δ SM for Ho0.8Dy0.2CoSi under different magnetic field changes.[32] |
In 1974, Bodak et al.[34] reported that all RNiSi (R = Gd– Lu) compounds crystallize in the orthorhombic TiNiSi-type crystal structure. In 1999, Szytula et al.[35] further investigated the magnetic properties of RNiSi (R = Tb– Er) compounds by neutron diffraction and magnetometric measurement studies. It was found that all RNiSi (R = Tb– Er) compounds show AFM ordering with strong magnetocrystalline anisotropy at low temperatures. In addition, the neutron diffraction studies reveal that another ordering change of magnetic moments from sine to square-modulated structure occurs below TN. Very recently, the MCE of RNiSi (R = Tb– Er) compounds have been investigated by different researchers.[36– 38] Among these materials, HoNiSi exhibits the largest MCE due to the field-induced metamagnetic transition.[36]
Zhang et al.[37] recently reported giant rotating MCE in textured DyNiSi polycrystalline material that is larger than those of most rotating magnetic refrigerants reported so far. Figure 10 shows the temperature dependence of ZFC and FC magnetizations for DyNiSi at 0.05 T along the parallel and perpendicular directions, respectively.[37] It is seen that both thermomagnetic curves show similar trend but with different magnetizations. With the decrease of temperature, DyNiSi undergoes a PM– AFM transition at TN of 8.8 K. In addition, another anomaly is found around the transition temperature Tt = 4 K, which is likely attributable to the ordering change of magnetic moments from sine to square-modulated structure, based on neutron diffraction studies.[35] The magnetization was measured by rotating the DyNiSi sample in the magnetic field of 0.05 T as shown in the inset of Fig. 10. Here, the rotation angle θ is defined as 0° when the longitudinal direction of columnar grains is parallel to the magnetic field. It can be clearly seen that the magnetization decreases gradually by rotating the sample from parallel to perpendicular direction, indicating that the easy magnetization axis is consistent with the preferred crystalline orientation.
 | Fig. 10. Temperature dependence of ZFC and FC magnetizations for DyNiSi at 0.05 T along the parallel and perpendicular directions, respectively. The inset shows the magnetization as a function of rotation angle at 20 K under 0.05 T.[37] |
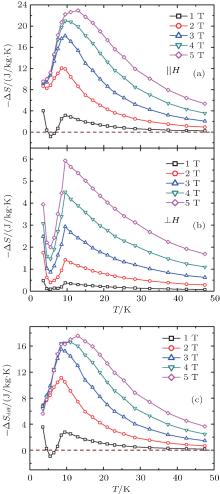
Figures 11(a) and 11(b) show the temperature dependence of Δ S for DyNiSi for different magnetic field changes along parallel and perpendicular directions, respectively.[37] It can be seen that DyNiSi exhibits a giant anisotropic MCE, e.g., the maximum − Δ S values are 22.9 J/kg· K and 5.9 J/kg· K for a field change of 5 T along parallel and perpendicular directions, respectively. A small negative − Δ S value (inverse MCE) is observed below TN at 1 T along the parallel direction because of the presence of the AFM state, while it becomes positive with the increase of magnetic field. Such a sign change of − Δ S is due to the field-induced AFM– FM metamagnetic transition.[39] In addition, another − Δ S peak is found around Tt for both directions. It is speculated that the transition from sine to square-modulated structure may lead to some unstable moments below Tt. Therefore, an applied magnetic field will turn these AFM components into FM ordering, which exhibits a magnetically more ordered configuration, and then result in a positive − Δ S peak. Figure 11(c) shows the difference of Δ S for DyNiSi between different directions as a function of temperature for different magnetic field changes.[37] For the field changes of 2 T and 5 T, the − Δ Sdiff peak reaches as high as 11.1 J/kg· K at 8.5 K and 17.6 J/kg· K at 13 K due to the giant anisotropy of MCE. This result indicates that a large rotating MCE can be obtained by rotating the sample from perpendicular to parallel.
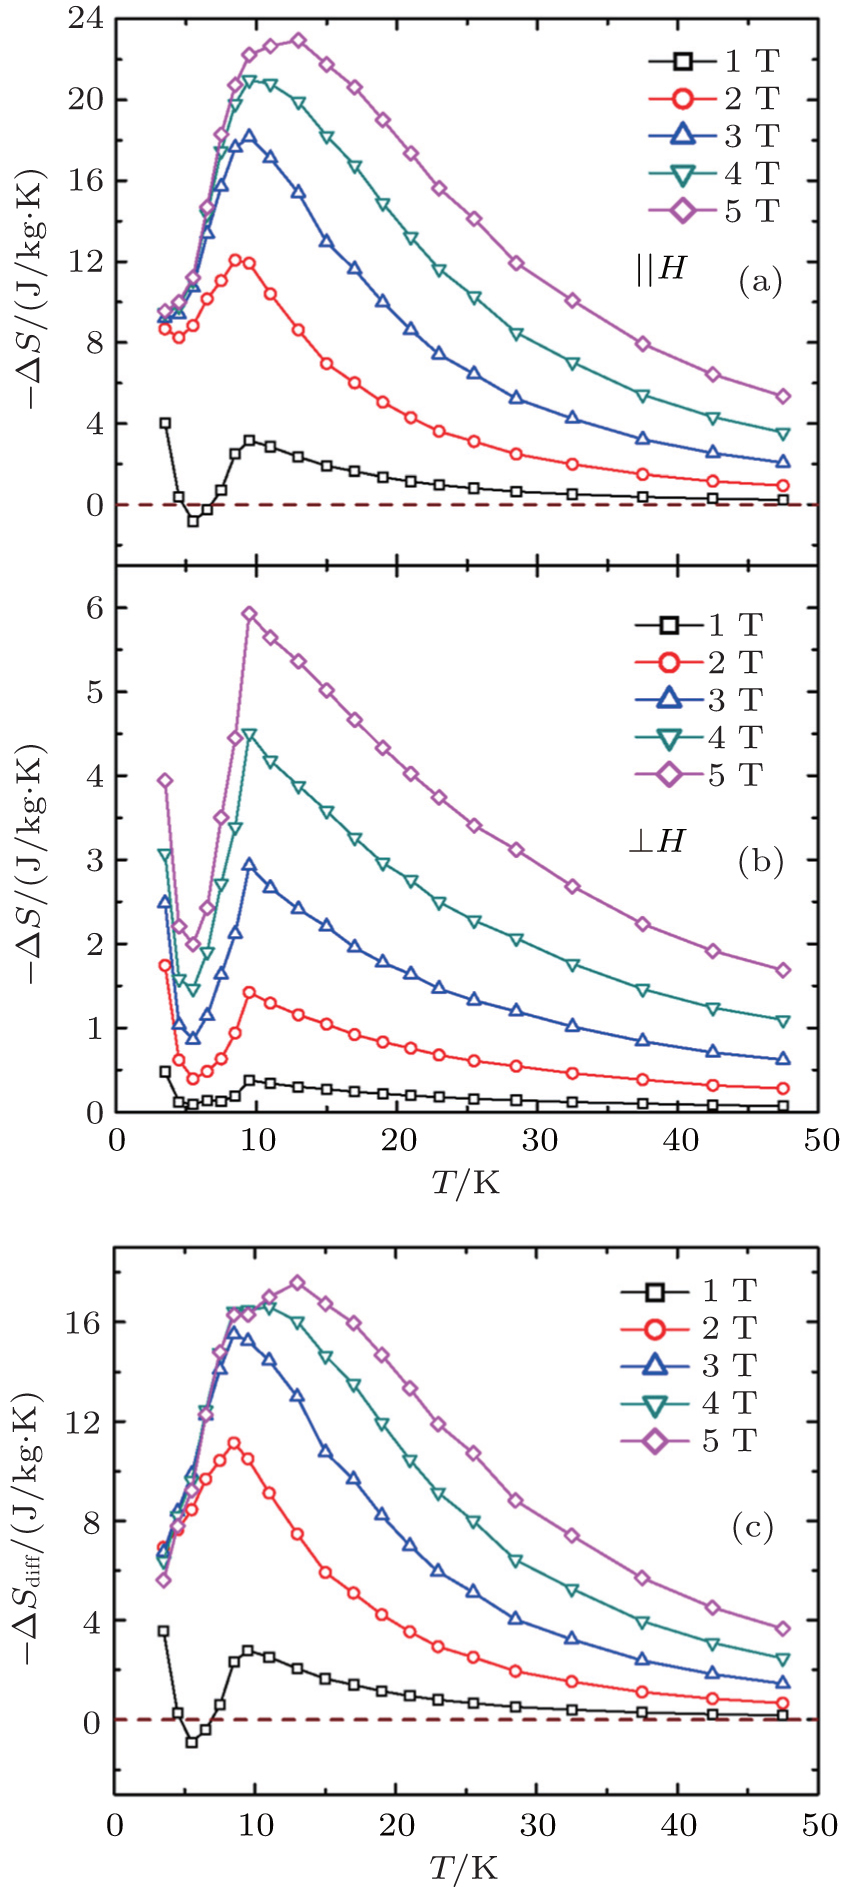 | Fig. 11. Temperature dependence of Δ S for DyNiSi for different magnetic field changes along (a) parallel and (b) perpendicular directions, respectively. (c) The difference of Δ S for DyNiSi between different directions as a function of temperature for different magnetic field changes.[37] |
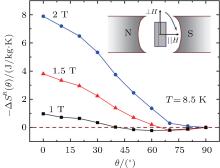
Furthermore, the isothermal magnetization curves at 8 K and 9 K were measured for DyNiSi under applied fields up to 2 T by rotating the sample from perpendicular (90° ) to parallel (0° ) with a step of 10° as shown in the inset of Fig. 12.[37] By defining the rotating entropy change Δ SR(90° ) as zero, the Δ SR(θ ) value at 8.5 K can be obtained based on the magnetization curves by using the following equation:
 | Fig. 12. The Δ SR(θ ) of DyNiSi as a function of rotation angle for different magnetic field changes. The inset describes the rotation of sample from perpendicular (90° ) to parallel (0° ) direction in magnetic field.[37] |
Figure 12 shows the Δ SR(θ ) as a function of rotation angle for different magnetic field changes.[37] It is noted that small negative − Δ SR(θ ) value is observed under relatively low fields near the perpendicular direction. This can be understood that the disordering of magnetic moments in AFM sublattice is enhanced under low fields when the rotation just starts, and thus it leads to a positive entropy change. Further rotating the sample closer to parallel, the majority of spins in the AFM sublattice could orient along the field direction, which then increases the spin ordering and results in the positive − Δ SR(θ ) value. Under the magnetic field of 2 T, the − Δ SR(θ ) value increases gradually and reaches a maximum value of 7.9 J/kg· K as the sample is rotated from perpendicular to parallel.
Figures 13(a) and 13(b) show the temperature dependence of ZFC and FC magnetizations for HoNiSi[36] and ErNiSi under 0.05 T. It is seen that HoNiSi and ErNiSi undergo an AFM– PM transition around the Né el temperature TN = 3.8 K and 4 K, respectively, which are just around the critical temperature of liquid helium (4 K), suggesting the potential application of RNiSi (R = Ho and Er) for helium liquefaction. Besides, no obvious discrepancy between ZFC and FC curves is observed, indicating good thermomagnetic reversibility of the magnetic transition. The temperature dependence of magnetization in various magnetic fields is shown in the inset of Figs. 13(a) and 13(b). It can be seen that RNiSi (R = Ho and Er) exhibit typical AFM– PM transition under low fields. However, the magnetization at low temperatures increases greatly with increasing field, revealing the occurrence of a field-induced AFM– FM metamagnetic transition below TN. In addition, a step-like behavior of M– T curves above TN is also observed when field is larger than 0.3 T for HoNiSi and 0.7 T for ErNiSi, respectively, corresponding to the FM– PM transition.[40]
 | Fig. 13. Temperature dependence of ZFC and FC magnetizations for (a) HoNiSi[36] and (b) ErNiSi under 0.05 T. Inset shows the temperature dependence of magnetization in various magnetic fields for HoNiSi[36] and ErNiSi, respectively. |
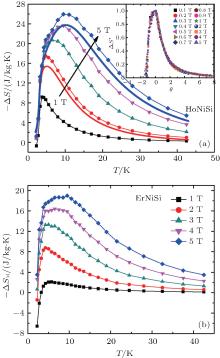
Figures 14(a) and 14(b) show the temperature dependence of Δ SM for HoNiSi[36] and ErNiSi under different magnetic field changes up to 5 T. It is well known that the Δ SM values can be calculated either from the magnetization isotherms by using the Maxwell relation 

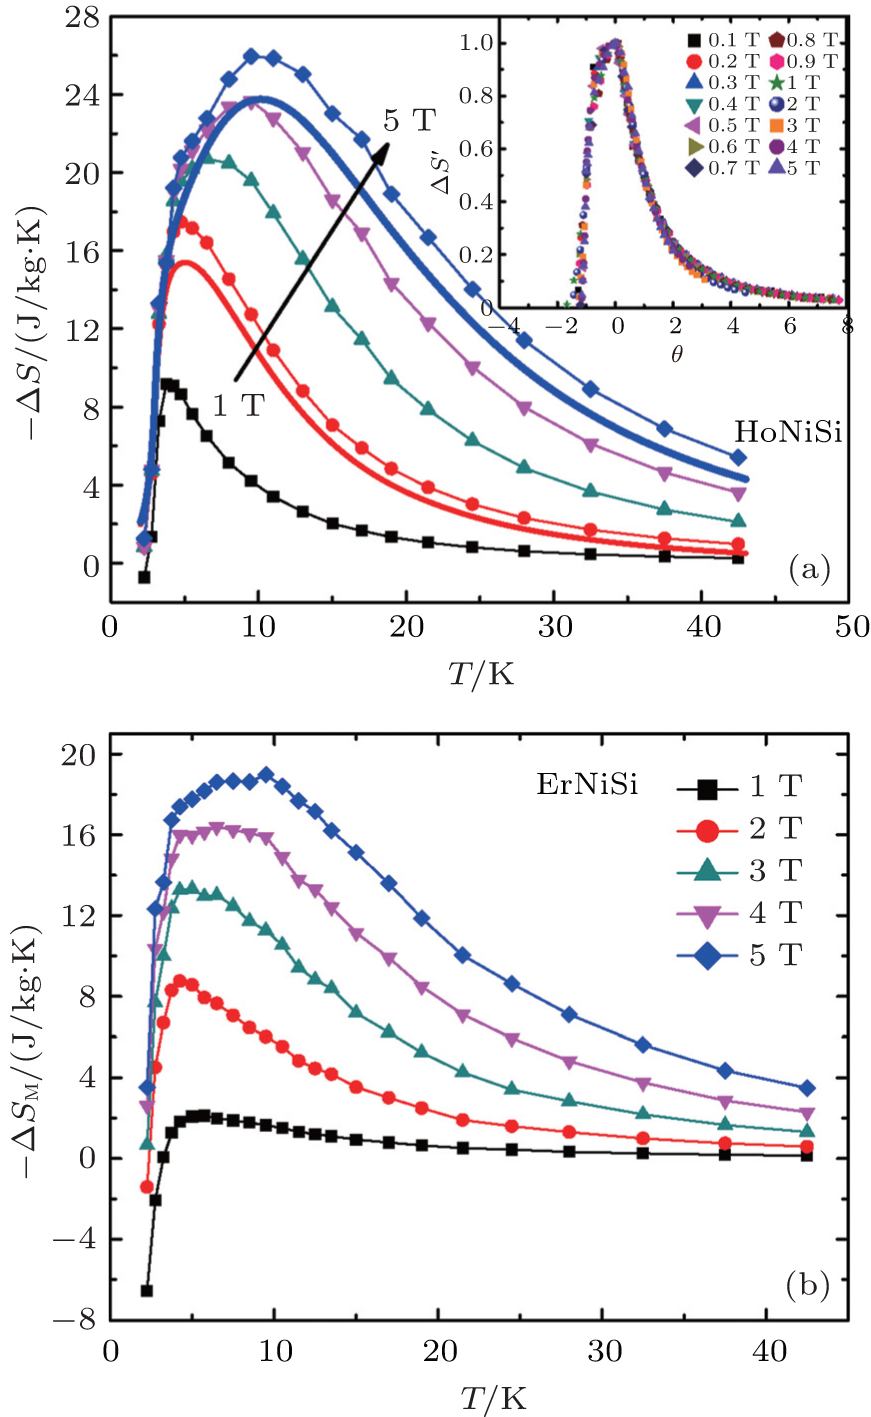 | Fig. 14. Temperature dependence of Δ SM for (a) HoNiSi[36] and (b) ErNiSi under different magnetic field changes up to 5 T. The Δ SM of HoNiSi was calculated from magnetizations (open symbols) and heat capacity measurements (full symbols). Inset shows the universal curve of Δ SM for HoNiSi compound under various magnetic field changes. |
Recently, Franco et al.[42, 43] proposed a phenomenological procedure to construct the universal curve of Δ SM for materials with second-order FM– PM transition. However, the applicability of this universal curve has not been proven for AFM materials. As shown in the inset of Fig. 14(a), Zhang et al.[36] were first to construct the universal curve of Δ SM for HoNiSi by using this phenomenological procedure. The normalized Δ S′ is defined as 
where Tr1 and Tr2 are the temperatures of the two reference points which correspond to 
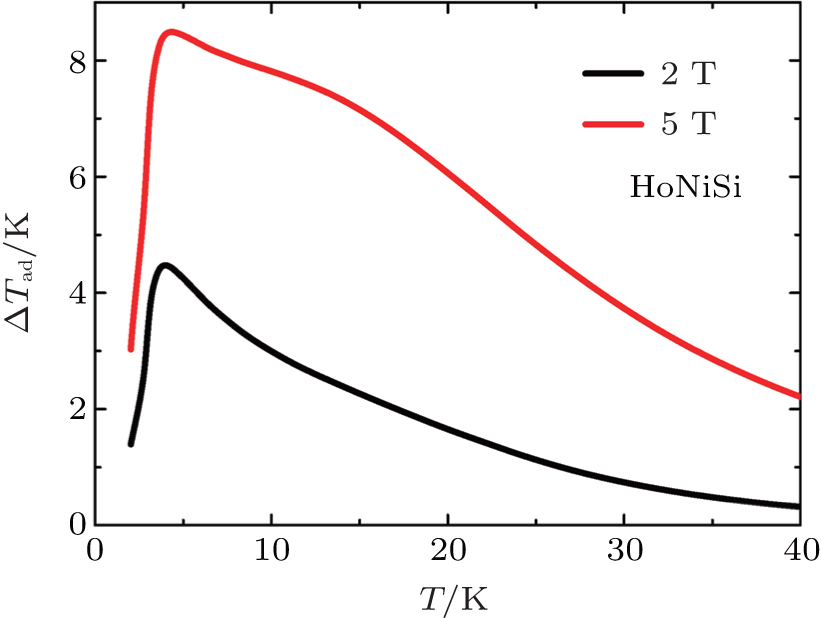
Figure 15 displays the temperature dependence of Δ Tad for HoNiSi under different magnetic field changes.[36] HoNiSi exhibits large Δ Tad values of 4.5 K and 8.5 K for the field changes of 2 T and 5 T, respectively, which is attributed to the field-induced metamagnetic transition from weak AFM to FM states.[15] In addition, it is found that both Δ SM and Δ Tad peaks for HoNiSi compound broaden asymmetrically towards high temperatures with increasing field, indicating the presence of FM ordering above TN induced by magnetic field.[44] Moreover, this broad distribution of Δ SM peak of HoNiSi leads to a high RC value of 471 J/kg for a field change of 5 T.
The series of ternary intermetallic RCuSi compounds have been investigated extensively in the past few decades due to the interesting physical properties. It has been reported that these compounds crystallize within two types of crystal structure depending on the annealing temperature. The high-temperature phase crystallizes in the AlB2-type structure (space group P6/mmm) with R atoms at 1a: (0, 0, 0) and Cu/Si atoms statistically at 2d: (1/3, 2/3, 1/2).[45] The low-temperature phase adopts the Ni2In-type structure (space group P63/mmc) with R at 2a: (0, 0, 0), Cu at 2c: (1/3, 2/3, 1/4), and Si at 2d: (1/3, 2/3, 3/4), respectively.[46, 47] The magnetic properties of RCuSi vary greatly with the change of crystal structure and rare earth element. According to the magnetic susceptibility measurements, Kido et al.[48] suggested that the AlB2-type RCuSi compounds with R = Ce, Nd order antiferromagnetically while those with R = Gd, Ho order ferromagnetically. As for the RCuSi compounds with Ni2In-type structure, neutron diffraction studies reveal that RCuSi compounds with R = Tb, Dy, Ho, and Er orders antiferromagnetically below TN = 16 K, 11 K, 9 K, and 6.8 K respectively.[49– 52]
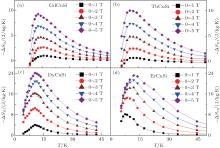
In 2010, Chen et al.[15, 53, 54] investigated systematically the magnetic properties and MCE of RCuSi (R = Gd– Er) with Ni2In-type structure. It was found that these compounds show weak AFM ground state at low temperatures, which could be easily induced into FM state by magnetic field, and thus lead to large MCE. Figure 16 shows the temperature dependence of ZFC and FC magnetizations under the magnetic field of 0.01 T for RCuSi (R = Gd, Tb, Dy, and Er) compounds.[54] It can be found that the RCuSi compounds undergo an AFM– PM transition at TN = 14, 11, 10, and 7 K for R = Gd, Tb, Dy, and Er, respectively. The ZFC and FC curves are completely reversible above TN, suggesting good thermomagnetic reversibility of the magnetic transition. However, a small discrepancy is observed below TN, which is likely related to the domain-wall-pinning effect. In ZFC mode, the domain walls are pinned and the thermal energy is not strong enough to overcome the energy barriers, and this leads to the low magnetization at low temperatures. However, in FC mode, the magnetic field during the cooling prevents the pinning effect and therefore, the magnetization at low temperatures is higher than that in ZFC mode. Figure 17 shows the temperature dependence of Δ SM for RCuSi (R = Gd, Tb, Dy, and Er) compounds under different magnetic field changes.[54] It is clearly seen that that RCuSi (R = Gd, and Tb) compounds exhibit a small negative Δ SM value at a lower temperature, but the Δ SM changes to positive value with increasing magnetic field, corresponding to the field-induced metamagnetic transition from AFM to FM states. This sign change of Δ SM is not observed in DyCuSi and ErCuSi, indicating that the weak AFM coupling in RCuSi (R = Dy and Er) could be easily induced into FM state under lower field. Moreover, a large MCE can be obtained due to the field-induced metamagnetic transition. For a magnetic field change of 5 T, the maximum – Δ SM values are 9.2, 10.0, 24.0, and 23.1 J/kg· K for R = Gd, Tb, Dy, and Er, respectively.
 | Fig. 16. Temperature dependence of ZFC and FC magnetizations under the magnetic field of 0.01 T for RCuSi (R = Gd, Tb, Dy, and Er) compounds.[54] |
 | Fig. 17. Temperature dependence of Δ SM for RCuSi (R = Gd, Tb, Dy, and Er) compounds under different magnetic field changes.[54] |
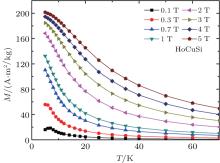
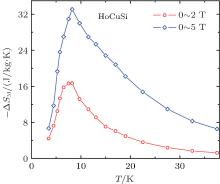
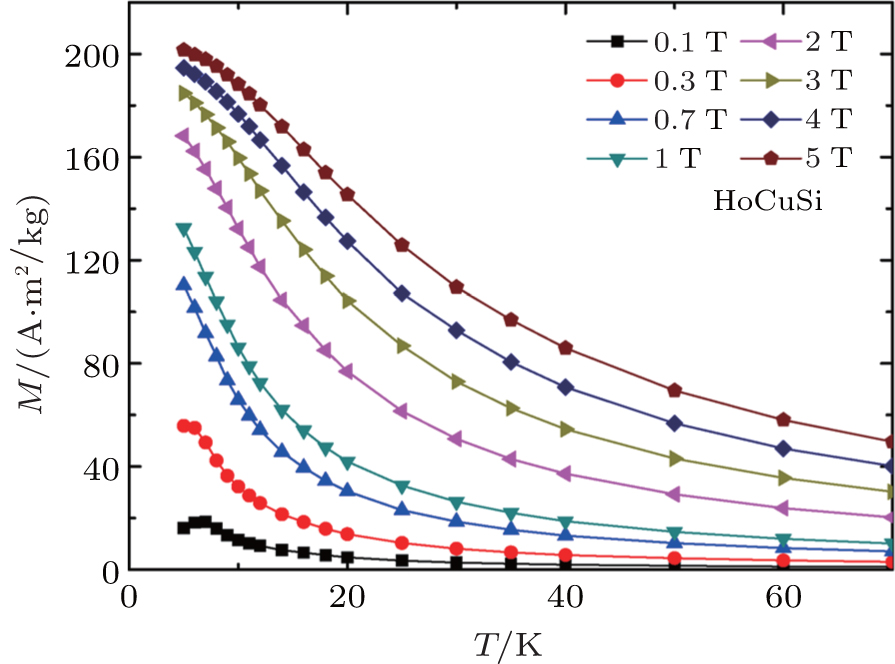
Figure 18 shows the temperature dependence of magnetization for HoCuSi under various magnetic fields.[15] It is seen that HoCuSi undergoes an AFM to PM transition around TN of 7 K under low fields. With the increase of magnetic field, the magnetization at low temperatures increases greatly, indicating the occurrence of a field-induced metamagnetic transition from AFM to FM states. In addition, a stepwise behavior of the M– T curves above TN is observed when the field is higher than 0.3 T, corresponding to the FM– PM transition. The Δ SM of HoCuSi as a function of temperature for different magnetic field changes is shown in Fig. 19.[15] The maximum – Δ SM and RC values are obtained to be 33.1 J/kg· K and 385 J/kg, respectively for a magnetic field change of 5 T, which are comparable with or even higher than those of other refrigerant materials in a similar temperature range. Particularly, the – Δ SM reaches as high as 16.7 J/kg· K for a relatively low field change of 2 T, making HoCuSi attractive candidate for magnetic refrigeration materials in the low temperature range.
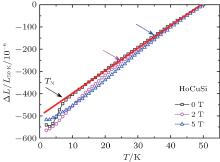
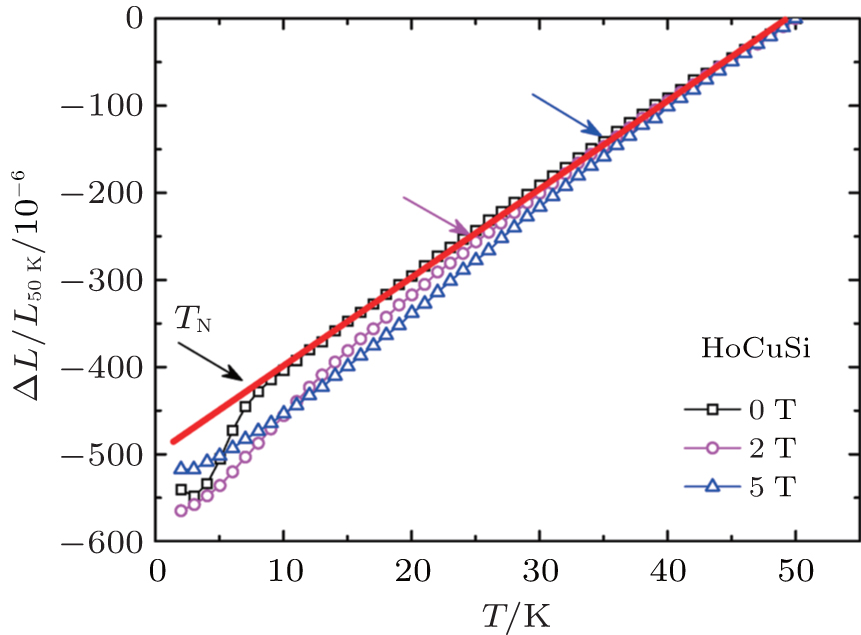
The large MCE in HoCuSi compound is mainly attributed to the following reasons: (i) the high saturation magnetization (MS∼ 9.47∼ μ B), [15] (ii) the field-induced metamagnetic transition from AFM to FM states, [55] and (iii) the large change in lattice volume around TN.[51] In order to investigate the change of lattice volume, the thermal expansion data (Δ L/L(50 K)) under different fields has been measured by the means of strain gauge method[56] and is shown in Fig. 20.[54] The (Δ L/L(50 K)) value decreases linearly with decreasing temperature above TN but drops abruptly around TN in zero magnetic field. This result confirms the occurrence of abrupt thermal expansion around TN, which is caused by the change of lattice constants. In addition, it is noted that the abrupt thermal expansion shifts to higher temperature with the increase of field, leading to the asymmetrical broadening of the – Δ SM peak.
The nature of magnetic ground state, the ordering temperature Tord, and the magnetocaloric properties for RTAl (R = Gd– Tm, T = Fe– Cu and Pd) compounds are summarized in Table 2. Similar to the RTSi compounds with T = Fe, Co, Ni, RFeAl and RCoAl compounds order ferri-/ferro-magnetically, and RNiAl compounds exhibit AFM or AFM + FM ground state. Unlike RCuSi compounds exhibiting AFM ground state, RCuAl compounds order ferromagnetically at low temperatures. It is worth noting that RTAl (T = Fe and Pd) compounds could exist in various crystallographic structures depending on the different heat treatment techniques, and that would result in rich variety of magnetic properties and MCE. Among these materials, the largest MCE can be often observed in RTAl compounds with R = Ho due to the high value of total angular momentum J. In the following sections, the magnetocaloric properties of different series of RTAl compounds will be discussed in detail.
| Table 2. Magnetocaloric properties of RTAl (R = Gd– Tm, T = Fe– Cu and Pd) compounds. |
It has been reported that all RFeAl (R = Gd– Dy) compounds crystallize in the hexagonal MgZn2-type structure (space group P63/mmc) when quenched after annealing.[57– 60] However, Klimczak et al.[57] found that GdFeAl crystallizes in cubic MgCu2-type structure (space group Fd3m) when cooled slowly, which exhibits lower saturation magnetic moments than that of GdFeAl with MgZn2-type structure. In 1973, Oesterreicher et al.[61] reported that both GdFeAl and TbFeAl with MgZn2-type structure order ferrimagnetically below the transition temperatures of 260 K and 195 K, respectively. In addition, an S-shape of the M– H curve is observed in TbFeAl compound at low temperatures, which was ascribed to the partial chemical disorder of Fe and Al atoms as well as high magnetocrystalline anisotropy.[61, 62] Similar results have also been observed by Kastil et al.[59] In recent years, the MCE of RFeAl (R = Gd– Dy) have been reported by different researchers, and it is found that these compounds show reversible MCE in a wide temperature range, leading to a high RC value.[58– 60]
In 2009, Dong et al.[58] were first to investigate the MCE of GdFeAl compound with MgZn2-type structure. Figure 21(a) shows the temperature dependence of magnetization for GdFeAl under 0.1 T.[58] The transition temperature TC is 265 K, defined as the minimum value of dM/dT curve. This TC is close to room temperature, indicating the possible application of GdFeAl compound for magnetic refrigeration near room temperature. The isothermal magnetization at 5 K is presented in Fig. 21(b).[58] The saturation magnetization μ S is determined to be 5.8 μ B per formula, which is lower than the theoretical gJ value of 7 μ B for a free Gd3+ ion. This lower value of μ S is attributed to the AFM coupling between the magnetic moments of Gd and Fe sublattices.[63]
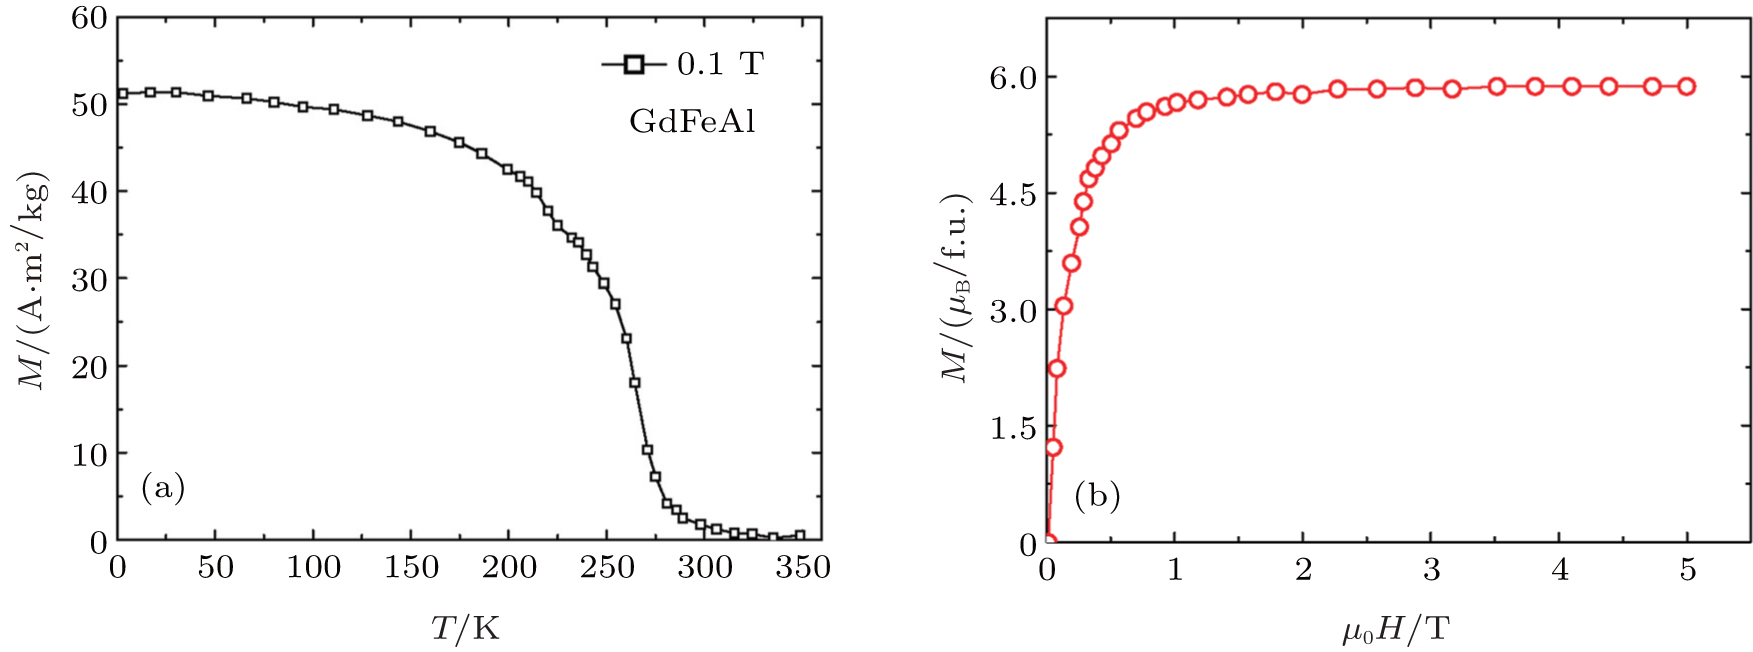 | Fig. 21. (a) Temperature dependence of magnetization for GdFeAl under a field of 0.1 T. (b) The magnetization curve at 5 K for GdFeAl compound.[58] |
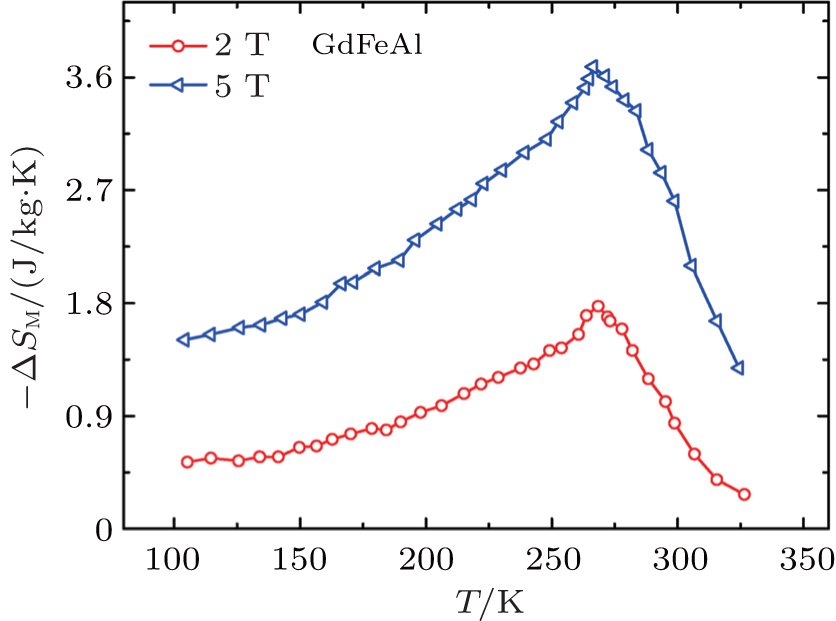
Figure 22 displays the temperature dependence of Δ SM for GdFeAl under the magnetic field changes of 2 T and 5 T, respectively.[58] The maximum – Δ SM value is 3.7 J/kg· K for a field change of 5 T, which is lower than those of most magnetic refrigerants in the same temperature range. However, the Δ SM peak spreads out over a wide temperature range and the full width at half maximum of the peak is 159 K. This broad distribution of Δ SM peak results in a high RC value of 420 J/kg for a field change of 5 T. In addition, a perfect magnetic reversibility around the transition temperature is observed in the M– H curves with the field increasing and decreasing modes, corresponding to the typical second-order magnetic transition. This result indicates that the detrimental effects for fast-cycling refrigerators of hysteresis losses and slow kinetics do not exist in GdFeAl. Very recently, Kastil et al.[59] also studied the MCE of RFeAl (R = Gd, Tb) and observed large relative cooling power (RCP) of 348 J/kg and 350 J/kg over a wide temperature region for GdFeAl and TbFeAl, respectively. Li et al.[60, 64] reported the MCE of RFeAl (R = Dy, Ho, and Er) and found that the RC of DyFeAl reaches the largest value of 832 J/kg for a field change of 7 T in this series of compounds.
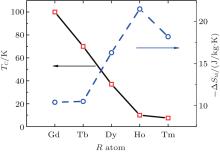
RCoAl compounds have been reported to crystallize in the hexagonal MgZn2-type structure (space group P63/mmc) which is a close-packed Laves phase.[65] In 2000, Jarosz et al.[66] investigated the crystallographic, electronic structure and magnetic properties of GdCoAl compound systematically, and reported that GdCoAl undergoes a typical FM– PM transition at TC = 100 K. Later, Zhang et al.[67] studied the magnetic entropy change of RCoAl (R = Gd - Ho) compounds in the temperature range of 10 K– 100 K. Figure 23 presents the TC and Δ SM for a field change of 5 T as a function of R atom type. It is found that the TC decreases linearly with the rare earth atom varying from Gd to Tm. In contrast, the Δ SM has been reported to increase with the R atom changing from Gd to Tm. For a field change of 5 T, the HoCoAl exhibits the largest – Δ SM of 21.5 J/kg· K around TC = 10 K. In addition, a table-like Δ SM peak was observed over the temperature range of 70 K– 105 K in GdCoAl compound. Although the – Δ SM of 10.4 J/kg· K is relatively low for GdCoAl, this flat Δ SM peak over a wide temperature range satisfies the requirement of a magnetic refrigerator based on an ideal Ericsson cycle, and also makes GdCoAl an attractive candidate material to fill the gap near 100 K in the Δ SM– T profile required by an eight-stage magnetic refrigerator.[68] In 2010, Chelvane et al.[69] also investigated the magnetic and magnetocaloric properties of DyCoAl compound by magnetization and neutron diffraction measurements. It was found that DyCoAl has a collinear ferromagnetic structure where Dy moments lie in the ab plane at 10 K. A reversible MCE with – Δ SM of 18 J/kg· K for a field change of 9 T is obtained in DyCoAl around 37 K.
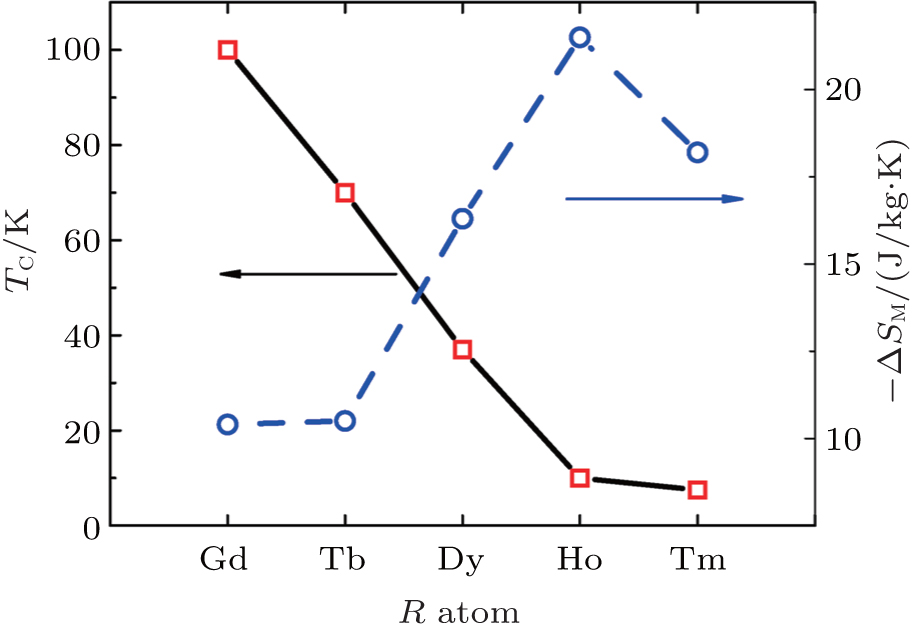 | Fig. 23. The TC and SM for a field change of 5 T as a function of R atom for RCoAl compounds. |
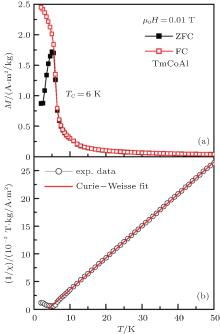
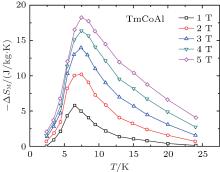
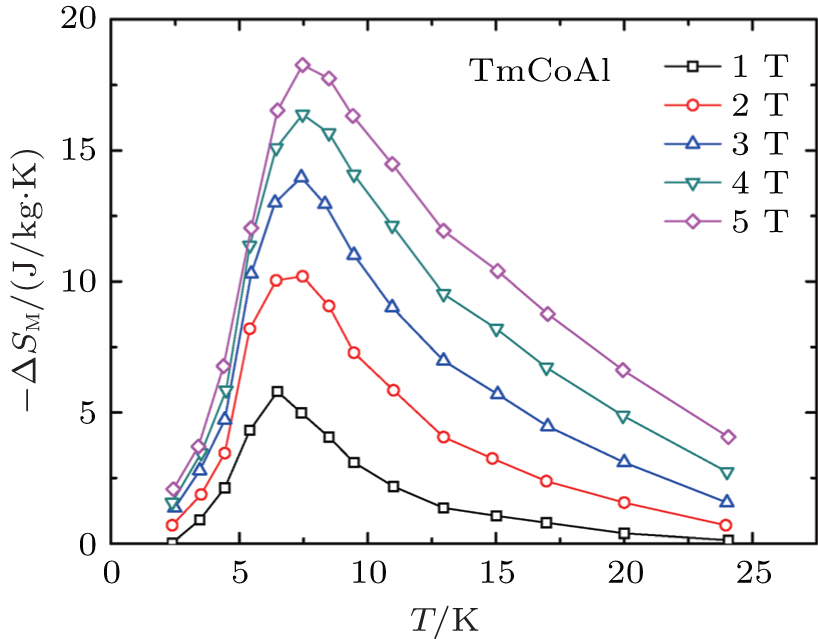
Very recently, Mo et al.[70] further studied the MCE of TmCoAl. Figure 24(a) shows the temperature dependence of magnetization under the magnetic field of 0.01 T for TmCoAl.[70] It can be found that TmCoAl undergoes a typical second-order magnetic transition from FM to PM states around TC = 6 K, which is just above the boiling temperature of helium. A significant thermomagnetic irreversibility can be clearly seen below TC, which likely arises from the narrow domain-wall-pinning effect. The inverse dc susceptibility (χ − 1) under 0.01 T and the Curie– Weiss fit to the experimental data for TmCoAl are plotted in the Fig. 24(b).[70] The inverse susceptibility above TC obeys the Curie– Weiss law χ – 1 = (T− θ P)/C, where θ P is the paramagnetic Curie temperature and C is the Curie– Weiss constant. Based on the calculation of Curie– Weiss fit, the values of θ P and effective magnetic moment (μ eff) for TmCoAl are obtained to be 4 K and 5.93 μ B/Tm3+ , respectively. The μ eff value is lower than the theoretical magnetic moment 
 | Fig. 24. (a) Temperature dependence of ZFC and FC magnetizations for TmCoAl compound under the magnetic field of 0.01 T. (b) Temperature variation of the inverse dc susceptibility fitted to the Curie– Weiss law for TmCoAl.[70] |
The RNiAl alloys have been intensively studied for their complex magnetic structures and related interesting physical properties.[66, 71– 74] All RNiAl compounds crystallize in the ZrNiAl-type hexagonal structure (space group 
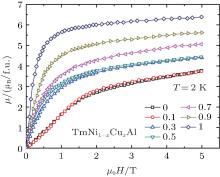
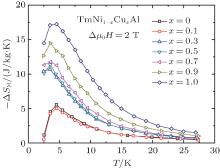
In order to investigate the effect of Cu doping on the magnetic and magnetocaloric properties in the TmNiAl compound, Mo et al.[81] also studied the TmNi1– xCuxAl compounds. Figure 26 displays the isothermal magnetization curves of TmNi1– xCuxAl compounds as a function of magnetic field measured at 2 K in applied fields up to 5 T.[81] The magnetization increases linearly with increasing magnetic field in low-field ranges when x < 0.3, suggesting the existence of AFM ground state, and then exhibits a sharp increase at a critical field, confirming the field-induced metamagnetic transition from AFM to FM states. However, with increasing Cu-concentration in the x ≥ 0.3, the magnetization increases rapidly with magnetic field and tends to be saturated at 5 T, which corresponds to the typical FM nature. The variation of ground state is attributed to the rotation of Tm magnetic moments from basal plane to c axis, and thus leading to the canted AFM structure with larger projected moments along the c axis near Tord. Meanwhile, the Tord decreases from 4 K for x = 0 to 2.8 K for x = 1. Figure 27 shows the Δ SM as a function of temperature for TmNi1– xCuxAl compounds under a magnetic field change of 2 T.[81] It is found that the – Δ SM value increases largely with the increase of Cu content, e.g., the – Δ SM value of 10.7 J/kg· K for TmNi0.7Cu0.3Al compound is almost twice that of TmNiAl compound (5.5 J/kg· K). The MCE of TmNi1– xCuxAl compounds with x ≥ 0.3 are much higher than those of many magnetic refrigerant materials with a similar transition temperature.
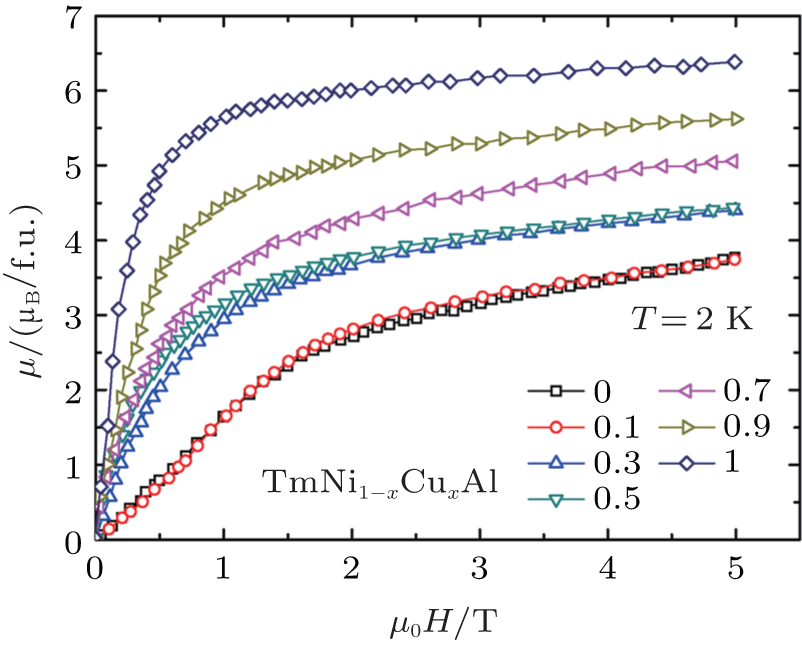 | Fig. 26. Isothermal magnetization curves of TmNi1– xCuxAl compounds as a function of magnetic field measured at 2 K in applied fields up to 5 T.[81] |
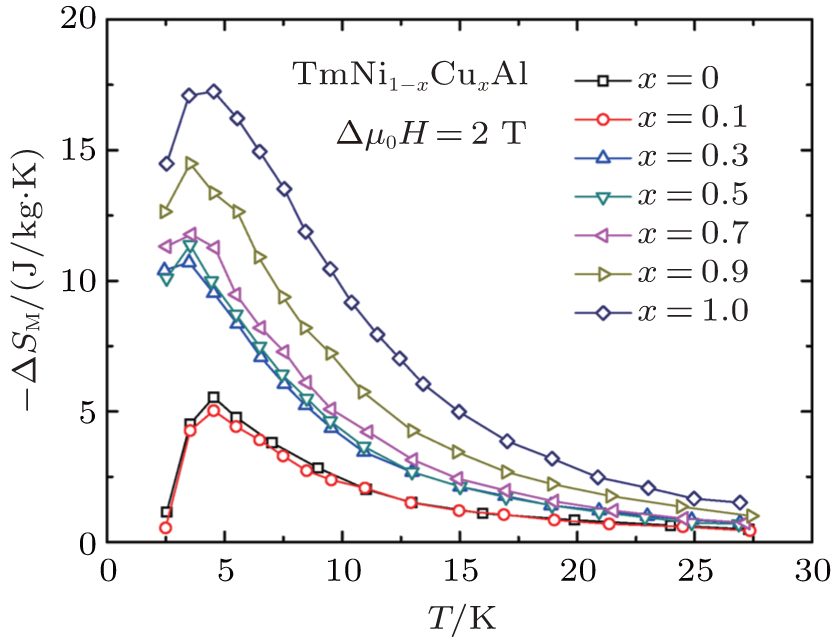 | Fig. 27. The Δ SM as a function of temperature for TmNi1– xCuxAl compounds under a magnetic field change of 2 T.[81] |
In 2015, Cui et al.[82] reported the magnetic properties and MCE in HoNi1– xCuxAl compounds. The temperature dependence of magnetization for HoNi1– xCuxAl compounds under the magnetic field of 0.01 T is displayed in Fig. 28. The HoNi1– xCuxAl compounds with x ≤ 0.1 exhibit two magnetic transitions, which are speculated to be a PM– FM + AFM transition followed by an AFM– AFM transition. These complex magnetic transitions are induced by the combination and competition between FM and AFM orderings. Increasing Cu content further, the compounds with x = 0.2– 0.7 undergo a single AFM– PM transition, and the ones with x = 0.8∼ 1 are found to show a FM ground state at low temperatures. For comparison, Figure 29 shows the Δ SM as a function of temperature for HoNi1– xCuxAl with x = 0.3 and 0.8 under different magnetic field changes.[82] A small negative value of – Δ SM was observed for a low magnetic field change of 1 T in x = 0.3 compound, corresponding to the presence of AFM state at low temperatures. In contrast, the compound with x = 0.8 exhibits positive – Δ SM for all magnetic field changes, which is due to the typical FM– PM transition. Large – Δ SM values of 12.3 J/kg· K and 9.4 J/kg· K for a low field change of 2 T are obtained in HoNi1– xCuxAl with x = 0.3 and 0.8, respectively.
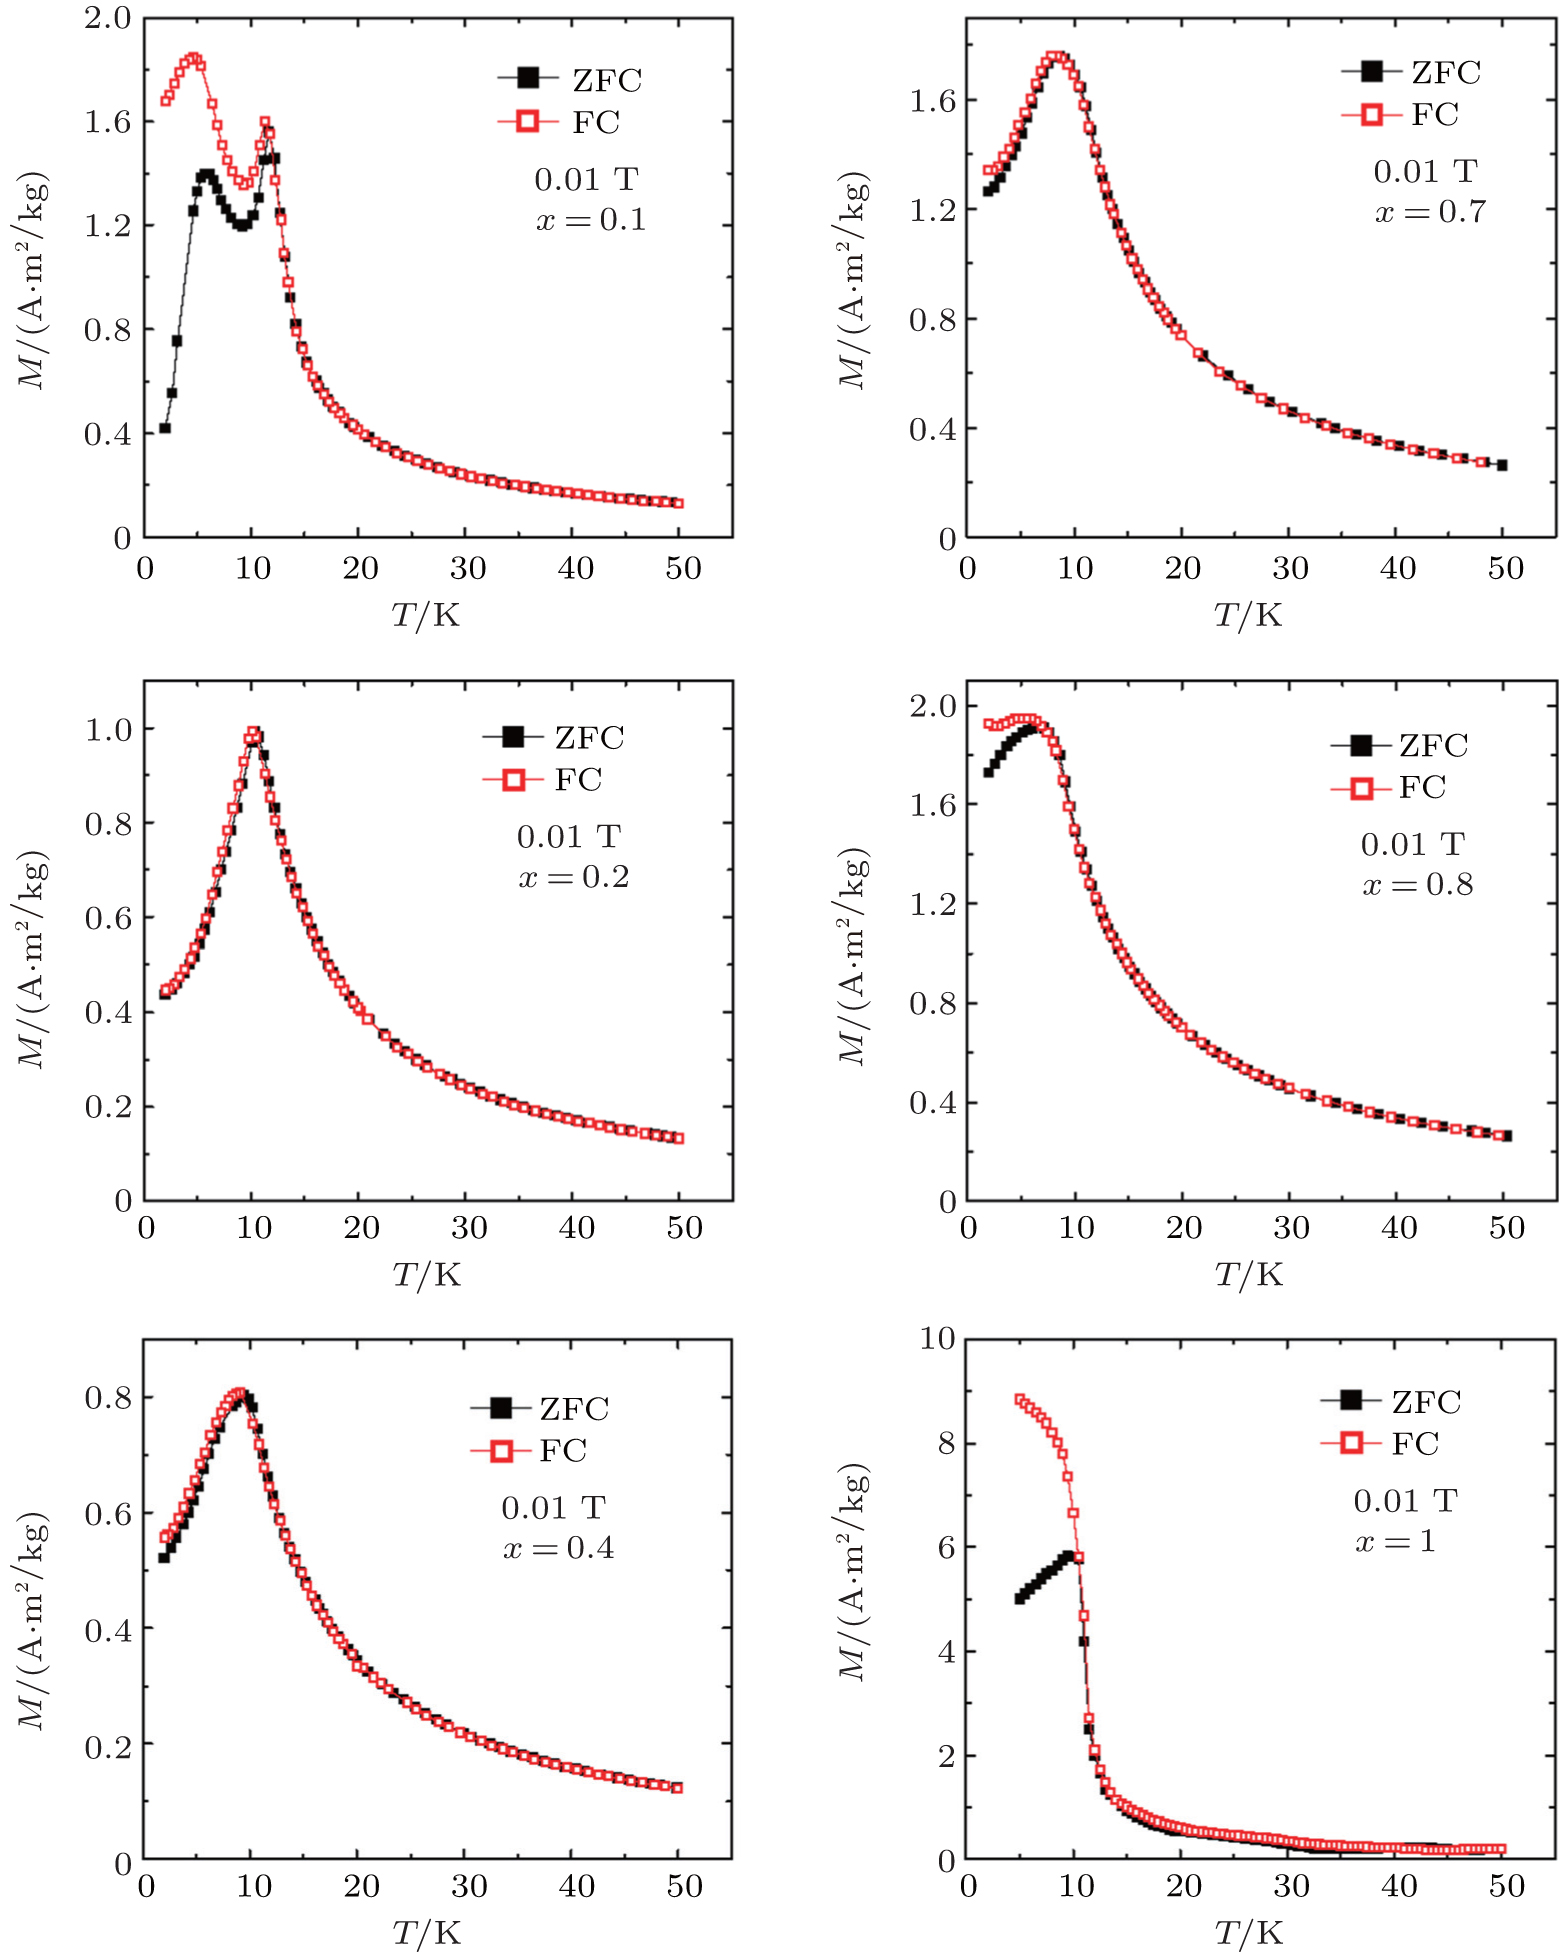 | Fig. 28. Temperature dependence of magnetization for HoNi1– xCuxAl compounds under the magnetic field of 0.01 T.[82] |
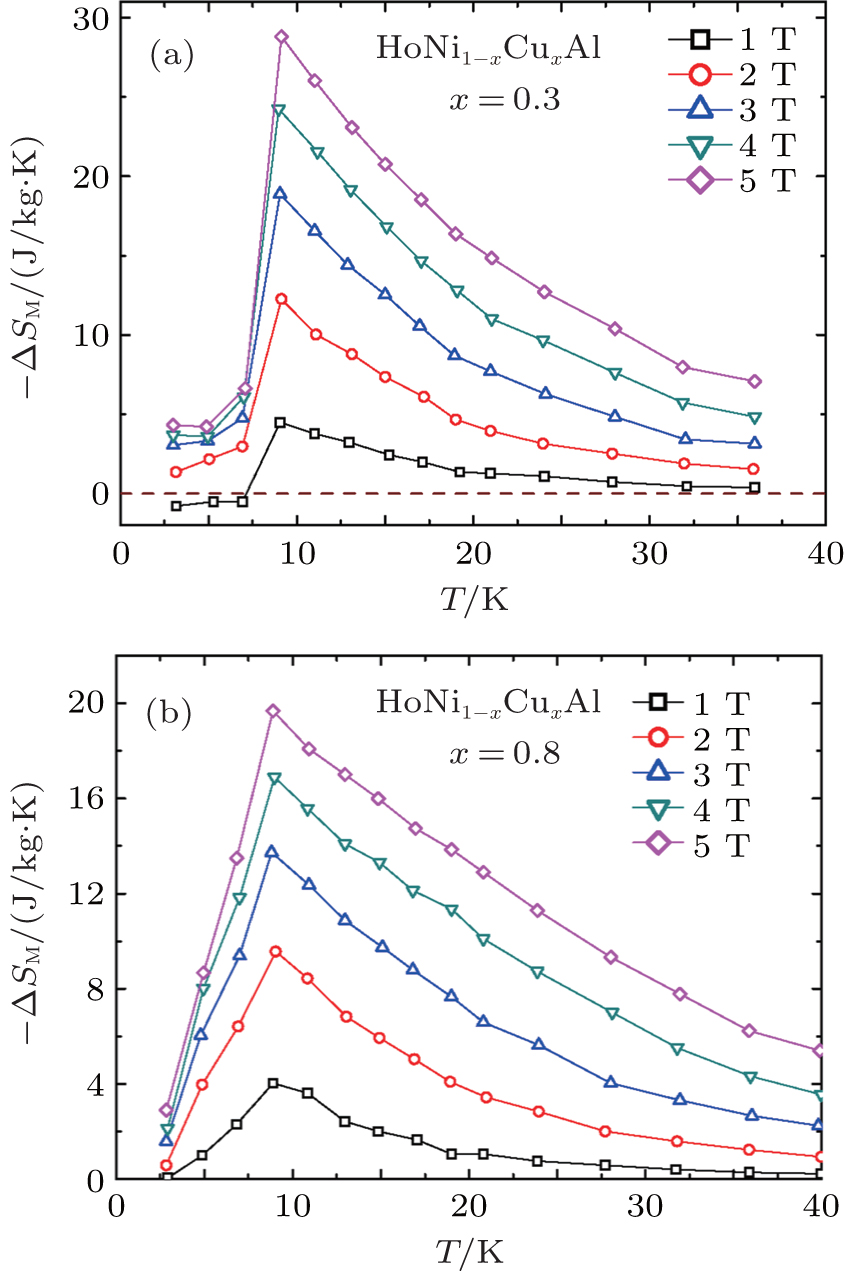 | Fig. 29. Temperature dependence of SM for HoNi1– xCuxAl with x = (a) 0.3 and (b) 0.8 under different magnetic field changes.[82] |
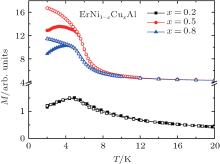
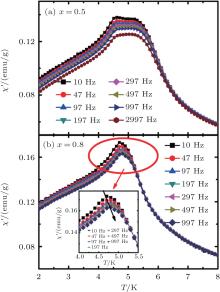
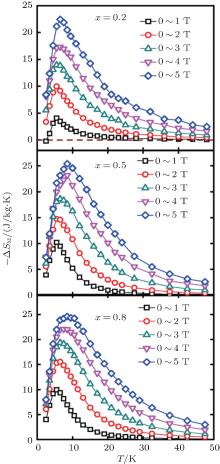
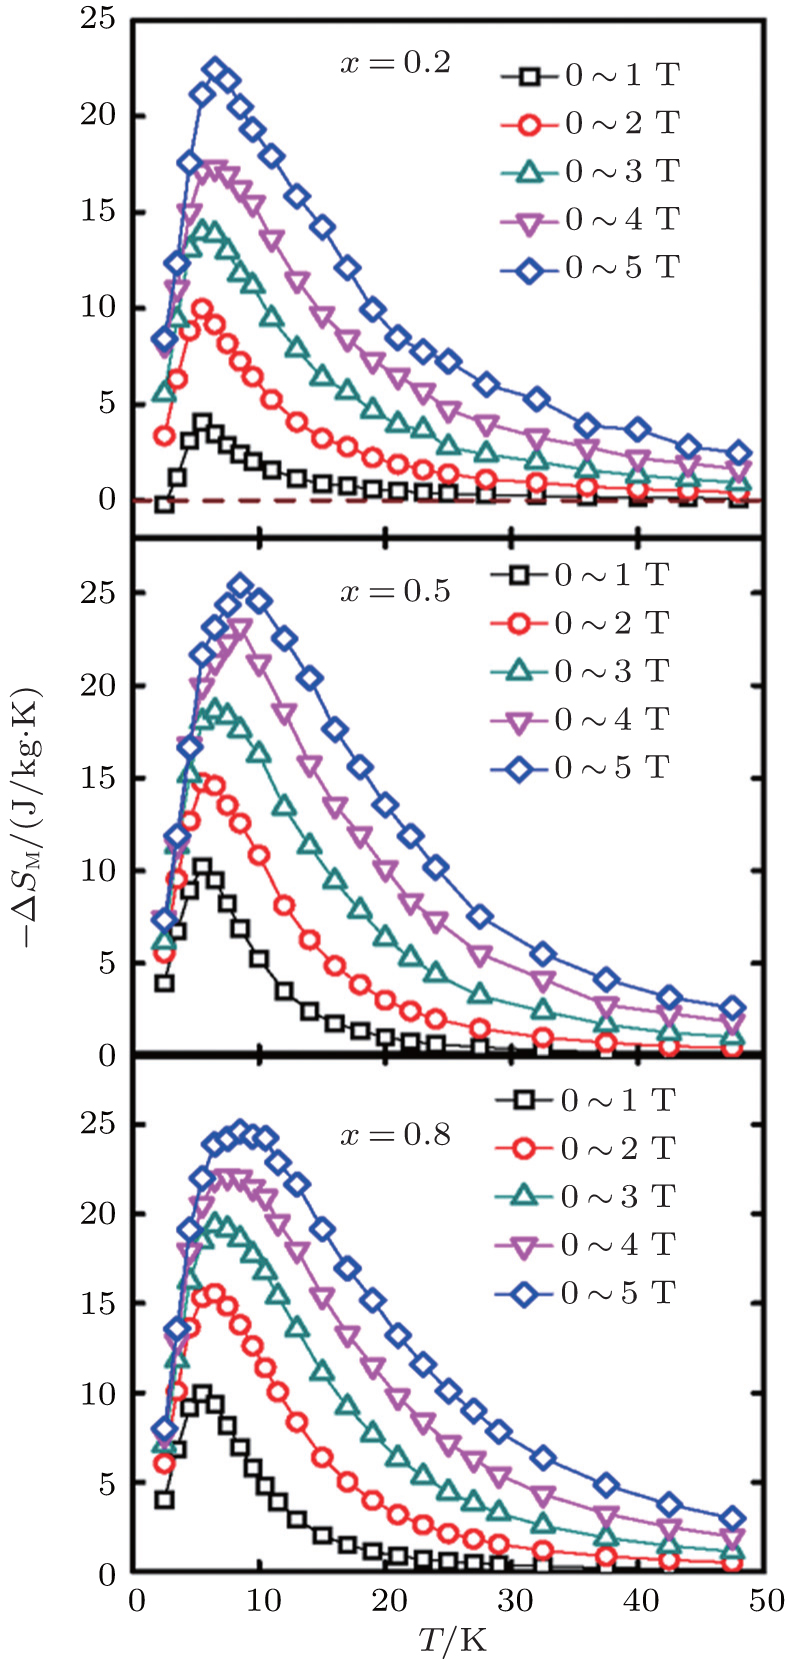
Wang et al.[83, 84] also reported similar work on ErNi1– xCuxAl compounds. Figure 30 shows the temperature dependence of magnetization for ErNi1– xCuxAl compounds with x = 0.2, 0.5, and 0.8, respectively.[83] It is found that the sample with x = 0.2 orders antiferromagnetically below the TN = 4.6 K, while the one with x = 0.5 orders ferromagnetically around the TC = 5.8 K. A quasi Curie-like magnetic transition is observed at Ttrs = 5.5 K for the x = 0.8 sample. In order to further investigate the nature of this magnetic transition, the ac susceptibilities in different frequencies for the samples with x = 0.5 and 0.8 were measured and plotted in Fig. 31.[83] It is clearly seen that the peak position of ac susceptibilities for x = 0.5 is independent of frequency. On the contrary, the peak for x = 0.8 shifts toward higher temperatures with increasing the frequency as shown in the inset of Fig. 31(b), which suggests the possible existence of short-range order. Figure 32 shows temperature dependence of – Δ SM under different magnetic field changes for ErNi1– xCuxAl with x = 0.2, 0.5, and 0.8, respectively.[83] The sample with x = 0.2 presents a small negative value of – Δ SM below TN under a low magnetic field change of 1 T, corresponding to the nature of AFM state at low temperatures. With the increase of magnetic field, the field-induced metamagnetic transition leads to a large positive – Δ SM for compound with x = 0.2. For a relatively low field change of 2 T, the maximum – Δ SM values are 10.1, 14.7, and 15.7 J/kg· K for x = 0.2, 0.5, and 0.8, respectively, and this large MCE under low field change is favorable for practical applications.
 | Fig. 30. Temperature dependence of magnetization for ErNi1– xCuxAl compounds with x = 0.2, 0.5, and 0.8, respectively.[83] |
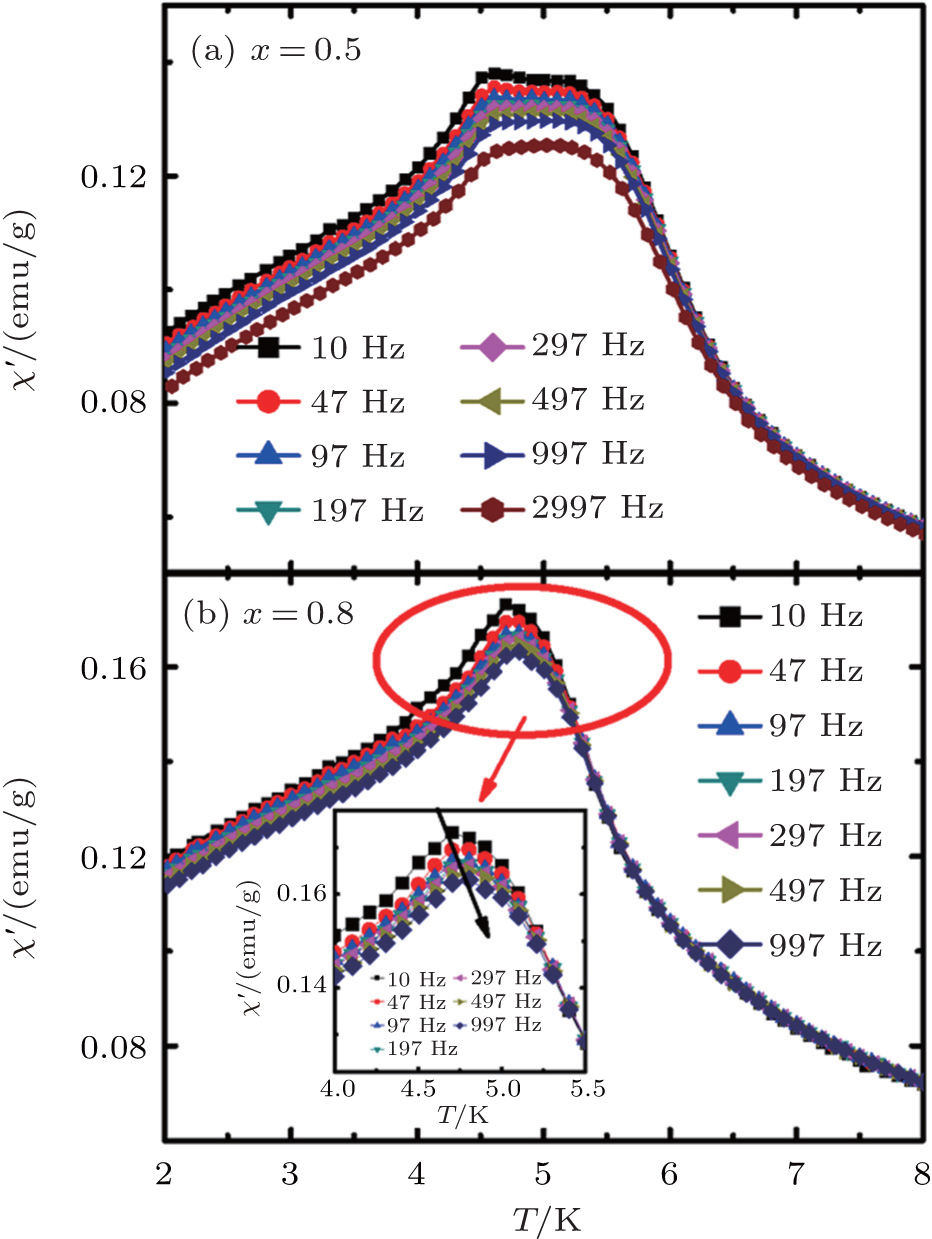 | Fig. 31. Temperature dependences of real part of ac magnetic susceptibility for (a) x = 0.5 and (b) x = 0.8 samples, respectively. The inset shows the corresponding enlarged part of peak position at different frequencies for x = 0.8 sample.[83] |
The RCuAl compounds, like RNiAl compounds, crystallize in the ZrNiAl-type hexagonal structure (space group 
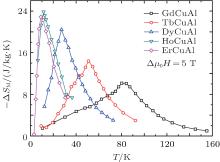
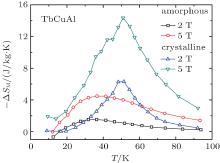
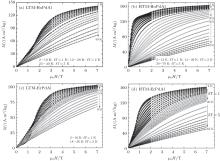
Recently, Dong et al.[85, 86, 89– 91] studied the MCE of RCuAl compounds systematically. Figure 33 shows the temperature dependence of ZFC and FC magnetizations for crystalline RCuAl (R = Gd– Er) compounds under 0.1 T and 0.05 T. These compounds undergo a typical FM– PM transition, and the TC decreases monotonically with the R atom-type varying from Gd to Er as usually seen in other RTX compounds. Figure 34 displays the temperature dependence of Δ SM for crystalline RCuAl (R = Gd– Er) compounds under a magnetic field change of 5 T. It can be seen that the Δ SM value increases gradually with the R atom changing from Gd to Er, and reaches the maximum as high as 23.9 J/kg· K for HoCuAl. The large MCE of RCuAl (R = Gd– Er) compounds suggests them as promising candidates of magnetocaloric materials in the low temperature range. In addition, Dong et al.[89, 90] compared the magnetic and magnetocaloric properties of amorphous and crystalline RCuAl (R = Gd, Tb) alloys. Figure 35 shows the temperature dependence of magnetization for (a) amorphous and (b) crystalline TbCuAl alloy under 0.1 T.[90] The crystalline TbCuAl undergoes an FM– PM transition at TC = 52 K while the amorphous counterpart shows a small cusp centered at 20 K, which is attributed to a spin-glass transition. Different MCE was also observed in the amorphous and crystalline TbCuAl alloys due to the different nature of magnetic transitions. As shown in Fig. 36, [90] the maximum – Δ SM value is obtained to be 4.5 J/kg· K around 36 K under a field change of 5 T for amorphous TbCuAl alloy. However, – Δ SM peak reaches 14.4 J/kg· K around 52 K under the same field change for crystalline TbCuAl alloy, which is much larger than that of amorphous alloy.
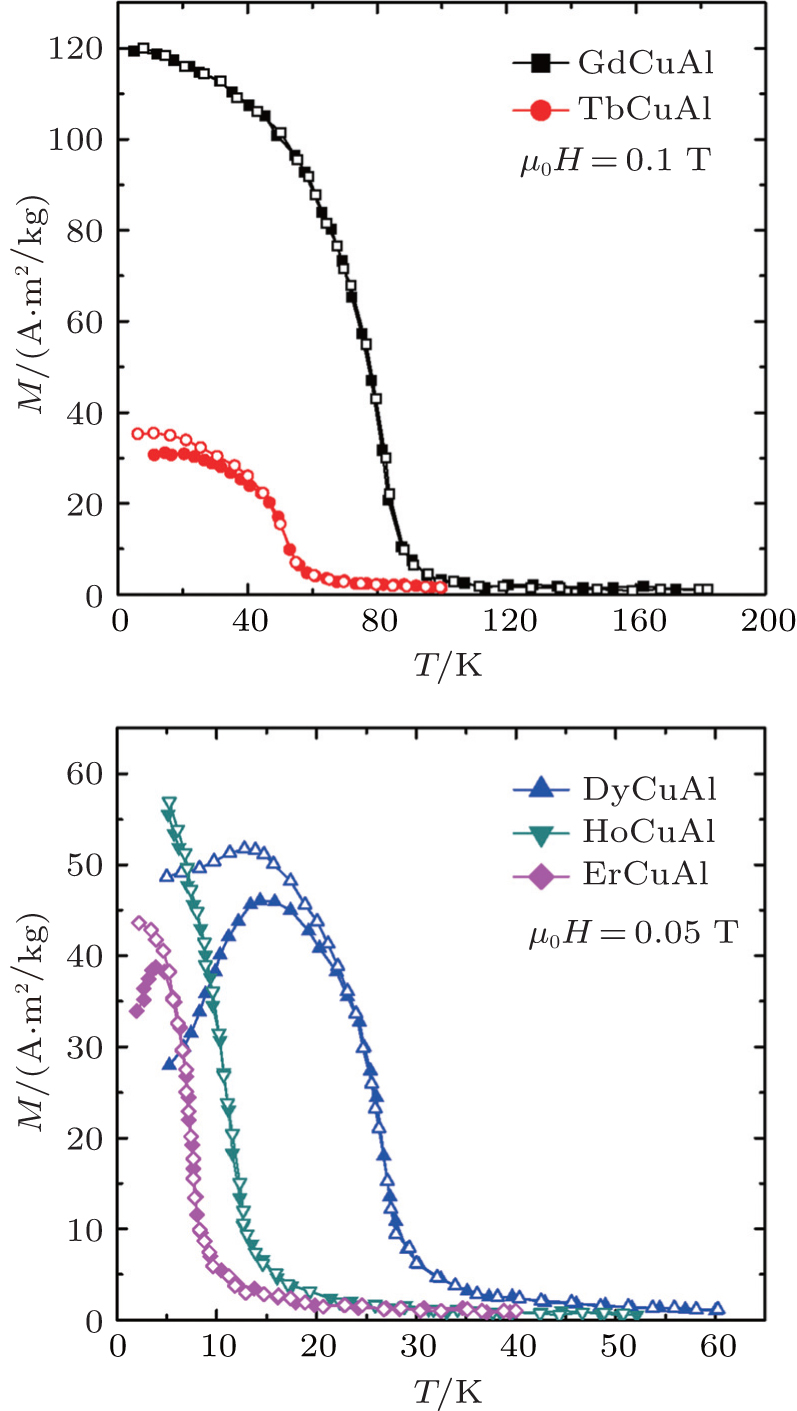 | Fig. 33. Temperature dependence of ZFC and FC magnetizations for crystalline RCuAl (R = Gd– Er) compounds under 0.1 and 0.05 T.[85, 86, 89, 90] |
 | Fig. 34. Temperature dependence of Δ SM for crystalline RCuAl (R = Gd– Er) compounds under a magnetic field change of 5 T.[85, 86, 89, 90] |
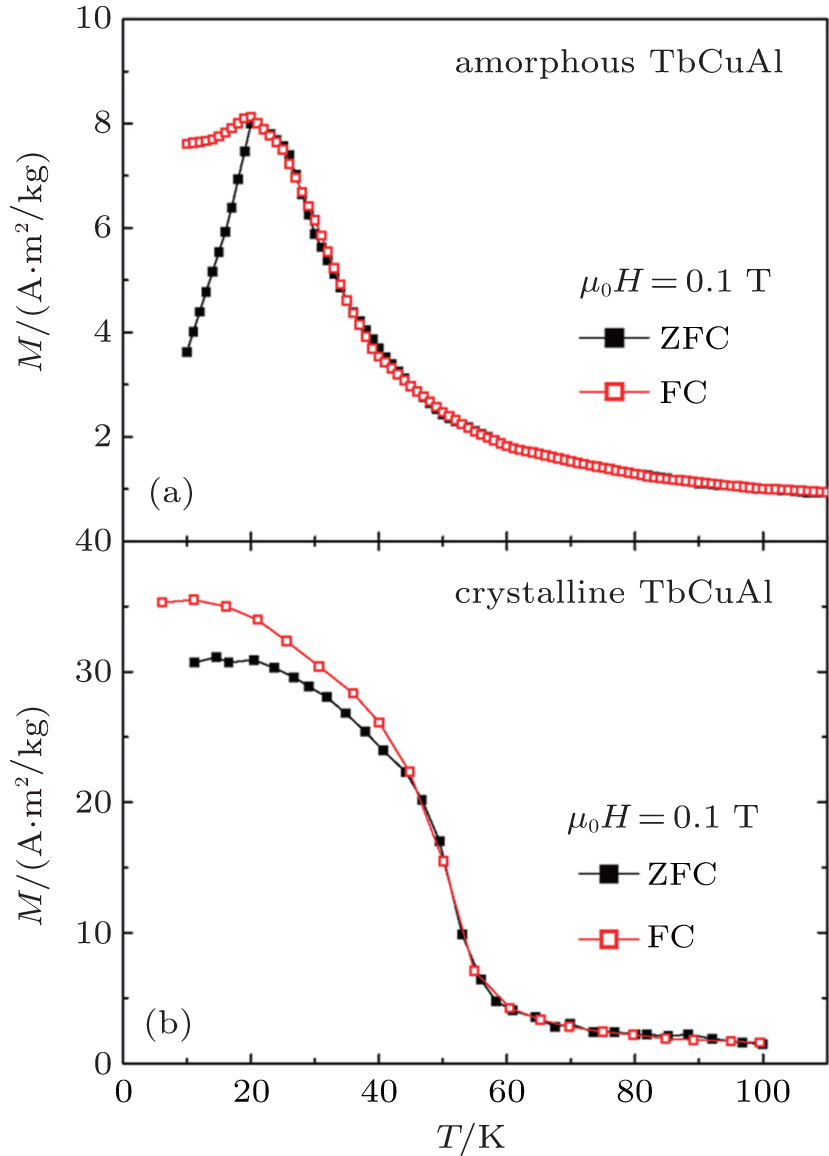 | Fig. 35. The temperature dependence of magnetization for (a) amorphous and (b) crystalline TbCuAl alloys under 0.1 T.[90] |
 | Fig. 36. Temperature dependence of Δ SM for amorphous and crystalline TbCuAl alloys under different magnetic field changes.[90] |
Since Dong et al.[86] did not obtain the pure HoCuAl compound, and therefore, the existence of impurity phase may influence the MCE. Later, Wang et al.[91] successfully synthesized pure HoCuAl compound and studied the magnetic properties and MCE in detail. Figure 37(a) shows the temperature dependence of magnetization for HoCuAl compound under 0.01 T.[91] The HoCuAl experiences an FM to PM transition around TC = 11.2 K, which is consistent with the data from an impure sample (12 K).[86] The ZFC and FC curves show a distinct discrepancy below TC as often observed in other RTX compounds. Taking into account the magnetic anisotropy and low TC for HoCuAl, this thermomagnetic irreversibility is likely attributable to the domain-wall-pinning effect. Figure 37(b) shows the Δ SM as a function of temperature for HoCuAl under different magnetic field changes.[91] For a relatively low field change of 2 T, the maximum – Δ SM value for the pure HoCuAl compound is as high as 17.5 J/kg· K at TC = 11.2 K, which is 25% higher than that of an impure sample (14.0 J/kg· K). This large – Δ SM is also deemed as the highest – Δ SM value in RTAl (R = Gd– Tm) system reported so far.
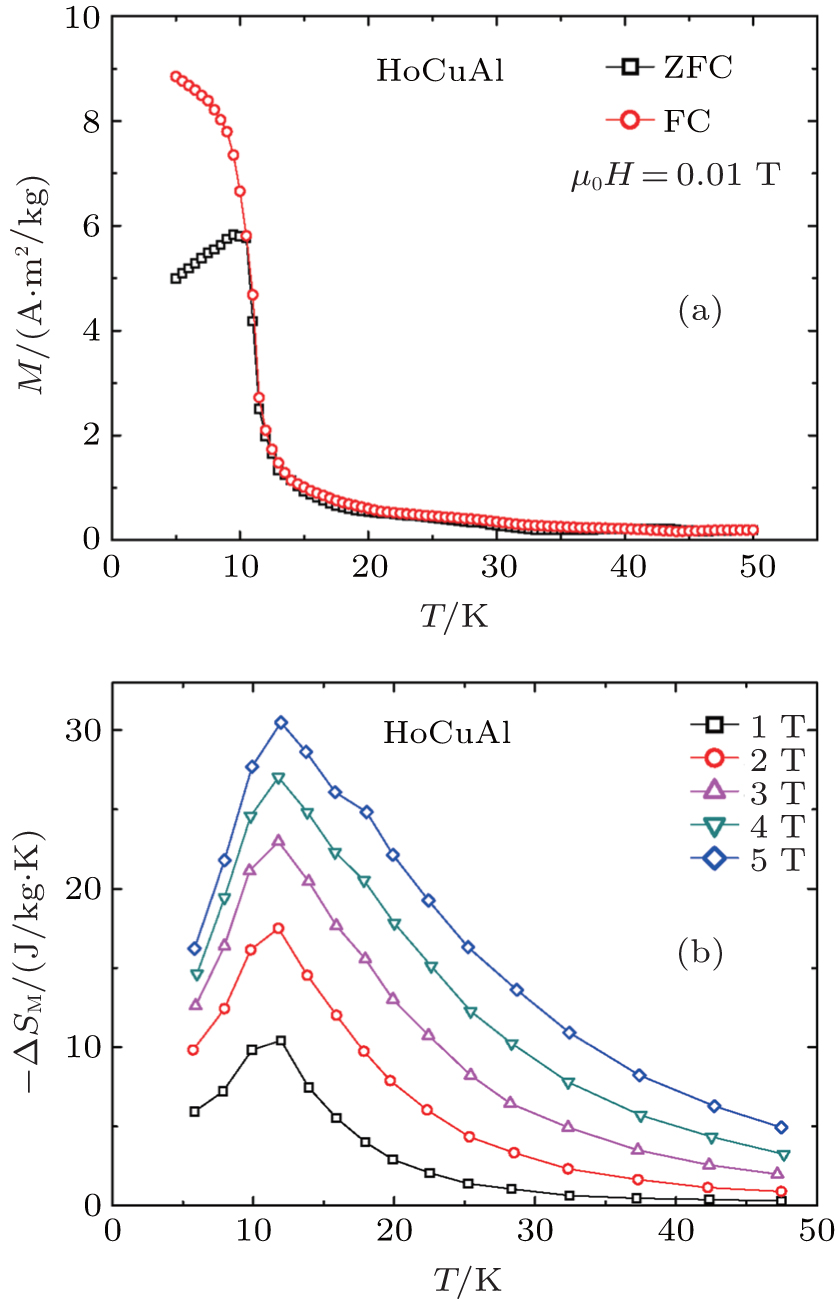 | Fig. 37. (a) Temperature dependence of magnetization for HoCuAl compound under 0.01 T. (b) The SM as a function of temperature for HoCuAl under different magnetic field changes.[91] |
In 2013, Mo et al.[16] reported a low-field induced giant MCE in TmCuAl compound. With the decrease of temperature, TmCuAl exhibits a transition from PM to FM state at TC = 2.8 K, which likely corresponds to the presence of a longitudinal spin wave magnetic structure according to the neutron diffraction studies.[92] Figure 38 displays the temperature dependence of – Δ SM and Δ Tad for TmCuAl under different magnetic field changes.[16] Large reversible MCE under low field change can be observed around the TC, e.g., the – Δ SM and Δ Tad values of TmCuAl are 17.2 J/kg· K and 4.6 K for a field change of 2 T, respectively. Particularly, the – Δ SM reaches as high as 12.2 J/kg· K for a low field change of 1 T, which can be applied by a permanent magnet. This giant MCE without thermal and magnetic hysteresis indicates that TmCuAl could be an attractive magnetic refrigerant around the helium liquefaction temperature.
It has been found that different crystal structures can be formed in RPdAl compounds depending on the variation of heat treatment technique. RPdAl compounds crystallize in a hexagonal ZrNiAl-type structure as metastable high-temperature modification (HTM) through a high-temperature (∼ 1050 ° C) annealing and rapid cooling process, while they crystallize in an orthorhombic TiNiSi-type structure as stable low-temperature modification (LTM) by a low-temperature (∼ 750 ° C) annealing process.[93] In addition, an isostructural phase transition from a high-temperature HTM I phase to a low-temperature HTM II phase was observed in GdPdAl and TbPdAl with a metastable HTM.[94, 95]
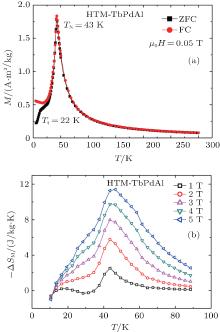
The RPdAl (R = Gd, Tb, Dy) compounds with the hexagonal ZrNiAl-type HTM were reported to exhibit two magnetic transitions with the variation of temperature.[94– 96] Shen et al.[97] studied the MCE of HTM-TbPdAl compound by magnetization measurements. Figure 39(a) shows the temperature dependence of ZFC and FC magnetizations under a magnetic field of 0.05 T for HTM-TbPdAl compound. It can be seen that the TbPdAl undergoes a PM– AFM transition around TN = 43 K. In addition, another anomaly is observed at Tt = 22 K, which is associated with an AFM structure transition of frustrated Tb moments from purely commensurate AFM to incommensurate AFM magnetic structure.[98, 99] Moreover, the discrepancy between ZFC and FC curves below 30 K is likely related to the frustration effects of the magnetic structures. Figure 39(b) shows the temperature dependence of Δ SM for HTM-TbPdAl under different magnetic field changes.[97] A small positive Δ SM value can be observed below TN under relatively low magnetic field changes, which is due to the disordered magnetic sublattices antiparallel to the applied magnetic field. But the Δ SM gradually changes to negative value with the increase of magnetic field. Such a sign change of Δ SM indicates the occurrence of field-induced AFM– FM magnetic transition, which leads to a more ordered magnetic configuration. It is found that the Δ SM– T curve shows a small peak around Tt, which is associated with AFM structure transition of frustrated Tb moments. In addition, a large – Δ SM value of 11.4 J/kg· K for a field change of 5 T is obtained around TN, which is due to the field-induced AFM– FM transition. Moreover, the Δ SM peak expands in a wide temperature range, leading to a high RC value of 350 J/kg for a field change of 5 T.
 | Fig. 39. (a) Temperature dependence of ZFC and FC magnetizations under a magnetic field of 0.05 T for HTM-TbPdAl compound. (b) Temperature dependence of Δ SM for HTM-TbPdAl under different magnetic field changes.[97] |
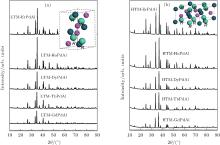
Recently, Xu et al.[100, 101] systematically investigated the magnetic properties and MCE of RPdAl (R = Gd– Er) compounds with different crystal structures, and found that the magnetic properties and MCE could be affected significantly by the variation of crystal structure. Two series of RPdAl compounds were annealed at 750 ° C for 50 days and at 1050 ° C∼ 1080 ° C for 10∼ 12 days, respectively. Figure 40 shows the XRD patterns and crystal structures of these two series of RPdAl compounds at room temperature.[32, 100] The XRD measurements confirm that the low-temperature annealed samples crystallize in an orthorhombic TiNiSi-type structure as stable LTM (space group Pnma) while the high-temperature annealed compounds crystallize in a hexagonal ZrNiAl-type structure as metastable HTM (space group 
 | Fig. 40. XRD patterns and crystal structures of (a) LTM-RPdAl and (b) HTM-RPdAl compounds at room temperature, respectively.[32, 100] |
| Table 3. The lattice parameters and unit cell volumes of LTM- and HTM-RPdAl compounds determined from the Rietveld refinement.[32, 100] |
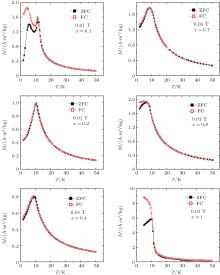
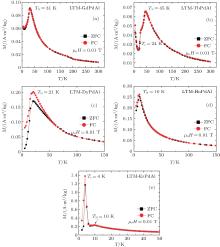
Figure 41 displays the temperature dependence of magnetization under a magnetic field of 0.01 T for LTM-RPdAl compounds.[32, 100] It is found that all LTM-RPdAl (R = Gd– Er) compounds order antiferromagnetically with the decrease of temperature, and the TN is determined to be 31, 45, 21, 10, and 10 K for R = Gd, Tb, Dy, Ho, and Er, respectively. Besides, TbPdAl and ErPdAl exhibit another AFM– AFM magnetic transition around Tt = 24 K and 4 K, respectively. However, the magnetic structures and properties turn out to be much different in HTM-RPdAl compounds. Figure 42 shows the temperature dependence of magnetization for HTM-RPdAl compounds.[32, 100] It can be found that all compounds, except ErPdAl exhibiting a single AFM– PM transition at TN = 5 K, show two successive magnetic transitions with the variation of temperature.
It is seen from Fig. 42(a) that the HTM-GdPdAl undergoes an FM– PM transition at TC = 49 K followed by a spin reorientation at TSR = 16 K. In addition, it is interesting that HTM-GdPdAl experiences an isostructural phase transition around 180 K from a high-temperature HTM I phase to a low-temperature HTM II phase, which leads to changes of lattice parameters, electrical resistance, magnetic susceptibility, etc.[95] With the decrease in temperature, HTM-TbPdAl undergoes a PM– AFM transition around TN = 43 K followed by an AFM structure transition at Tt = 22 K, which is in a good agreement with the result of Shen et al.[97] In HTM-TbPdAl with hexagonal ZrNiAl-type structure, one-third of the Tb moments (Tb2) are highly frustrated in the temperature range of TN and Tt, and this geometrical frustration of Tb2 spins results in an AFM structure transition from a purely commensurate AFM structure at higher temperature to a purely incommensurate AFM magnetic structure when T < Tt. Besides, two-third of the non-frustrated Tb moments (Tb1 and Tb3) exhibit commensurate AFM ordering below TN. HTM-DyPdAl undergoes two successive magnetic phase transitions with a decrease of temperature: a PM– FM transition at TC = 22 K followed by a spin reorientation transition at TSR = 14 K. These transition temperatures are a little lower than the data (TC = 25 K and TSR = 17 K) obtained by AC susceptibility and electrical resistance measurements.[96, 102] The isostructural phase transition from HTM I phase to HTM II phase is not observed in HTM-DyPdAl compound. The x-ray photoelectron spectroscopy (XPS) studies reveal that the localization of the Pd 4d orbitals and the hybridization processes contribute to the coupling of the system in HTM II phase, and thus the disappearance of HTM II phase is likely related to the weak molecular field and absence of such coupling.[96, 103] Talik et al.[102] found that the single crystal HTM-DyPdAl exhibits distinct magnetic hysteresis and several metamagnetic transitions with the magnetic field applied along a axis, while it exhibits perfect magnetic reversibility along c axis. This fact indicates that HTM-DyPdAl may have a canted magnetic structure with an AFM moment component along the a axis. It can be seen from Fig. 42(d) that HTM-HoPdAl undergoes a PM– AFM transition at TN = 12 K. Besides, another transition is observed around Tt = 4 K, which corresponds to an AFM– AFM transition. Similar to HTM-DyPdAl, Talik et al.[104] found that the overlap of 4d orbitals of neighboring Pd atoms in HTM-HoPdAl is also reduced due to the formation of a narrow Pd 4d band. Therefore, the coupling of the system in HTM II phase is weakened with the reduction of the localization of Pd 4d orbitals and the hybridization processes, and thus isostructural phase transition from HTM I phase to HTM II phase cannot occur in HTM-HoPdAl. In addition, the magnetic measurements on single crystal reveal that HTM-HoPdAl exhibits high magnetocrystalline anisotropy. The AFM characteristic can be found in the thermal variation of magnetization along a axis, and it correlates with the increase of lattice parameter a. Along the c axis, HTM-HoPdAl exhibits an FM characteristic accompanied by a shrinkage of lattice parameter c.
 | Fig. 41. Temperature dependence of magnetization under a magnetic field of 0.01 T for LTM-RPdAl compounds.[32, 100] |
 | Fig. 42. Temperature dependence of magnetization under low magnetic field for HTM-RPdAl compounds.[32, 100] |
Figure 43 shows the magnetization isotherms and the temperature dependence of Δ SM under different magnetic field changes for HTM-RPdAl (R = Gd, Tb, and Dy) compounds.[32, 100] The magnetization of HTM-GdPdAl below TC increases rapidly at low fields and tends to saturate with increasing field, corresponding to typical FM behavior. In addition to the Δ SM peak at TC, another Δ SM peak can be observed around TSR = 16 K. These two successive peaks result in a table-like Δ SM– T curve between TC and TSR, which is favorable to the Ericsson-cycle magnetic refrigeration. For the field changes of 2 T and 5 T, the maximum – Δ SM values of HTM-GdPdAl are 5.3 J/kg· K and 9.2 J/kg· K, respectively. A field-induced metamagnetic transition from AFM to FM states is observed below TN in HTM-TbPdAl as seen in Ref. [97], and the negative slope of Arrott plots below TN confirms that the nature of this metamagnetic transition is of first-order. The critical field for metamagnetic transition is obtained to be 0.55 T at 9 K, and this relatively low critical field suggests the possible large MCE in HTM-TbPdAl compound. The maximum – Δ SM values for the magnetic field changes of 2 T and 5 T are 5.8 J/kg· K and 11.4 J/kg· K, respectively, which are consistent with the results of Shen et al.[97] Compared with GdPdAl and HoPdAl, the HTM-DyPdAl is much harder to magnetize to saturation even with the application of 14 T. Since the PM– FM and SR transitions take place closely, the two Δ SM peaks overlap with each other and then lead to a single Δ SM peak. A similar phenomenon has also been observed in other systems, such as ErGa[105] and Ho3Al2.[106] For the field changes of 2, 5, and 7 T, the maximum – Δ SM values of HTM-DyPdAl are 7.8, 14.7, and 17.8 J/kg· K, respectively. The Δ SM peak broadens asymmetrically towards high temperature with increasing field, suggesting the possible presence of short-range FM correlations in the PM region.
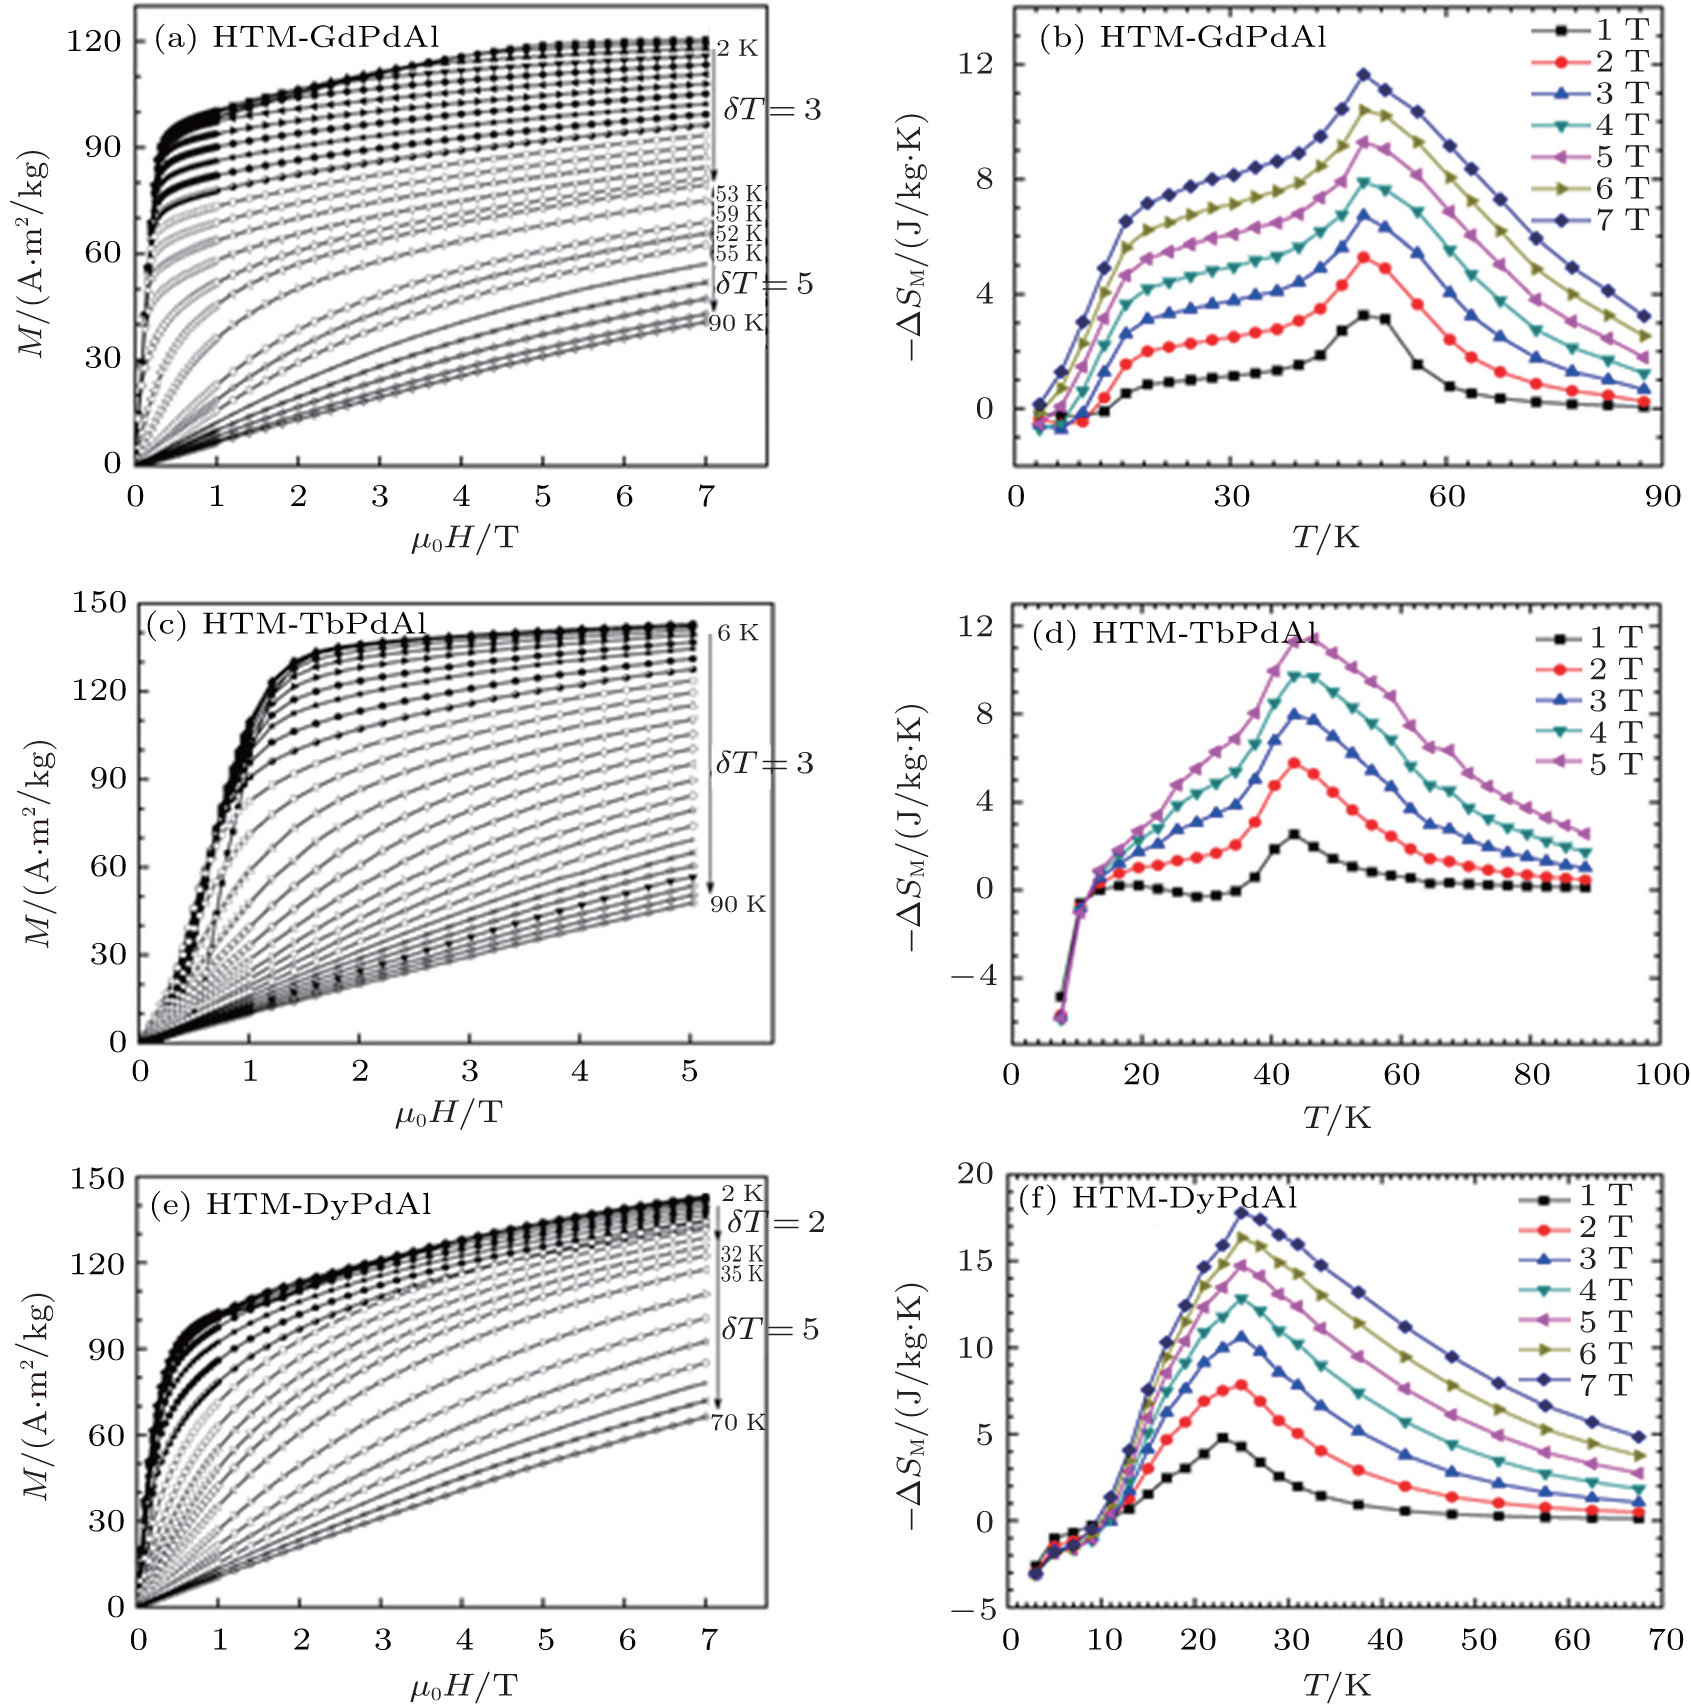 | Fig. 43. Magnetization isotherms and the temperature dependence of Δ SM under different magnetic field changes for HTM-RPdAl (R = Gd, Tb, and Dy) compounds.[32, 100] |
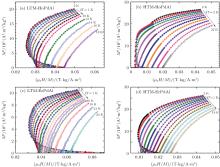
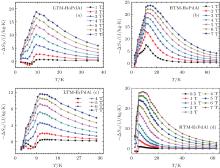
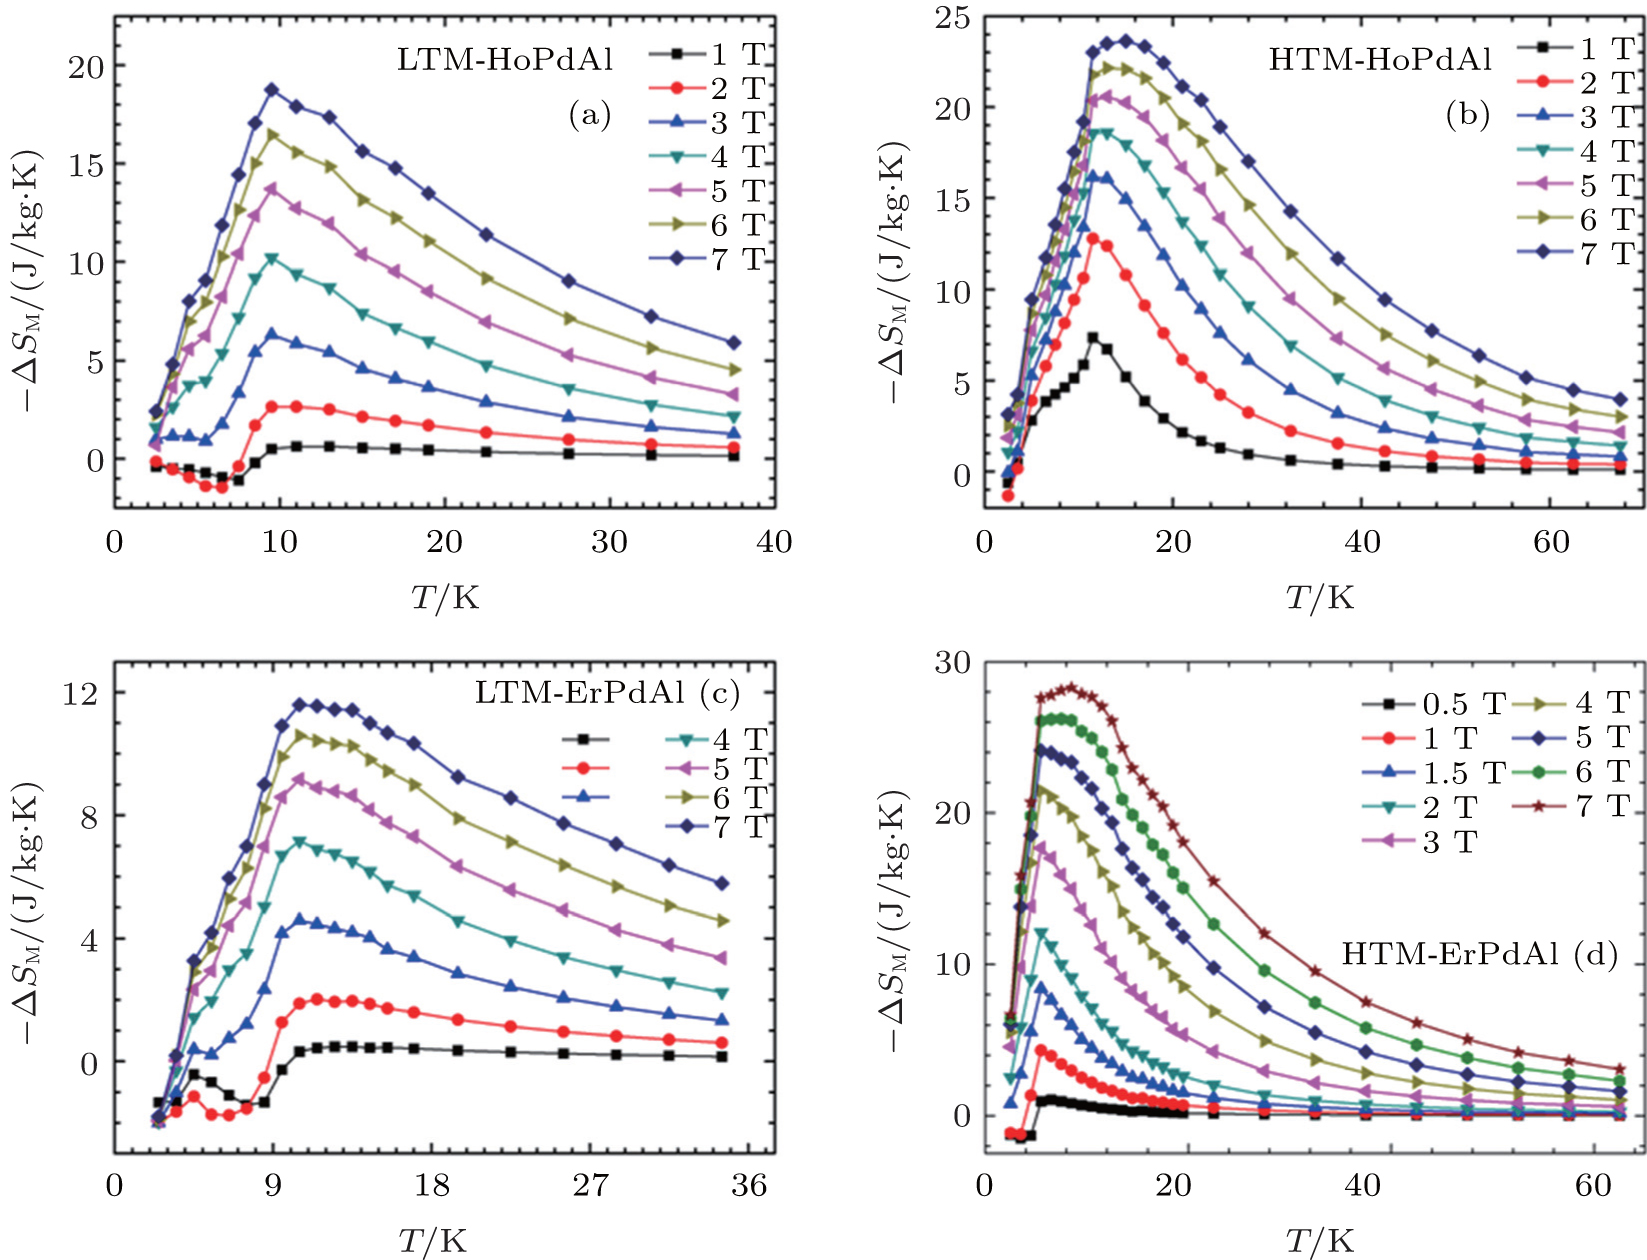
The magnetization isotherms of LTM-RPdAl and HTM-RPdAl (R = Ho and Er) under applied fields up to 7 T are displayed in Fig. 44.[100, 101] For LTM-RPdAl (R = Ho and Er) compounds, a field-induced metamagnetic transition from AFM to FM states can be clearly seen below TN with the increase of magnetic field. On the contrary, HTM-RPdAl (R = Ho and Er) compounds exhibit a weak metamagnetic transition at lower fields and then tend to saturation with a higher magnetization in comparison with that of LTM-RPdAl. For example, the Hcr and M7 T at 2 K are 1.5 T and 141 A/m2· kg for LTM-HoPdAl, and 0.15 T and 163 A/m2· kg for HTM-HoPdAl, respectively.[101] This fact indicates that the AFM coupling in LTM-RPdAl is much stronger than that in HTM-RPdAl compounds. Figure 45 shows the Arrott plots of LTM-RPdAl and HTM-RPdAl (R = Ho and Er) compounds.[100, 101] According to the Banerjee criterion, [107] a magnetic transition is considered as first-order when the Arrott plots exhibit negative slope or inflection point; otherwise it is expected to be of second-order when the Arrott plots exhibit positive slope. It is clearly seen that the slope of Arrott plots below TN is negative for all compounds, further confirming the first-order AFM– FM metamagnetic transition. On the other hand, the positive slope of all Arrott plots above TN proves the nature of a field-induced second-order PM– FM transition. The temperature dependence of Δ SM for LTM-RPdAl and HTM-RPdAl (R = Ho and Er) compounds under different magnetic field changes are shown in Fig. 46.[100, 101] A small positive value of Δ SM is observed at low temperatures and low fields, but it gradually changes to negative value with the increase of magnetic field. Such a sign change of Δ SM is due to the field-induced metamagnetic transition from AFM to FM states. For the field changes of 2, 5, and 7 T, the maximum – Δ SM values are 12.8, 20.6, and 23.6 J/kg· K for of HTM-HoPdAl, and 12.0, 24.3, and 28.4 J/kg· K for HTM-ErPdAl, respectively. These Δ SM values are comparable with or even larger than those of some magnetocaloric materials in the same temperature range.[67, 79, 108– 110] However, the maximum – Δ SM values for a field change of 5 T are 13.7 and 11.6 J/kg· K for LTM-HoPdAl and LTM-ErPdAl compounds, respectively. This lower MCE is attributed to the strong AFM coupling in LTM-RPdAl compounds. Consequently, the MCE of LTM-RPdAl and HTM-RPdAl are summarized in Table 2. The relatively high Δ SM and RC values for HTM-RPdAl suggest them as promising materials for magnetic refrigeration in low temperature range.
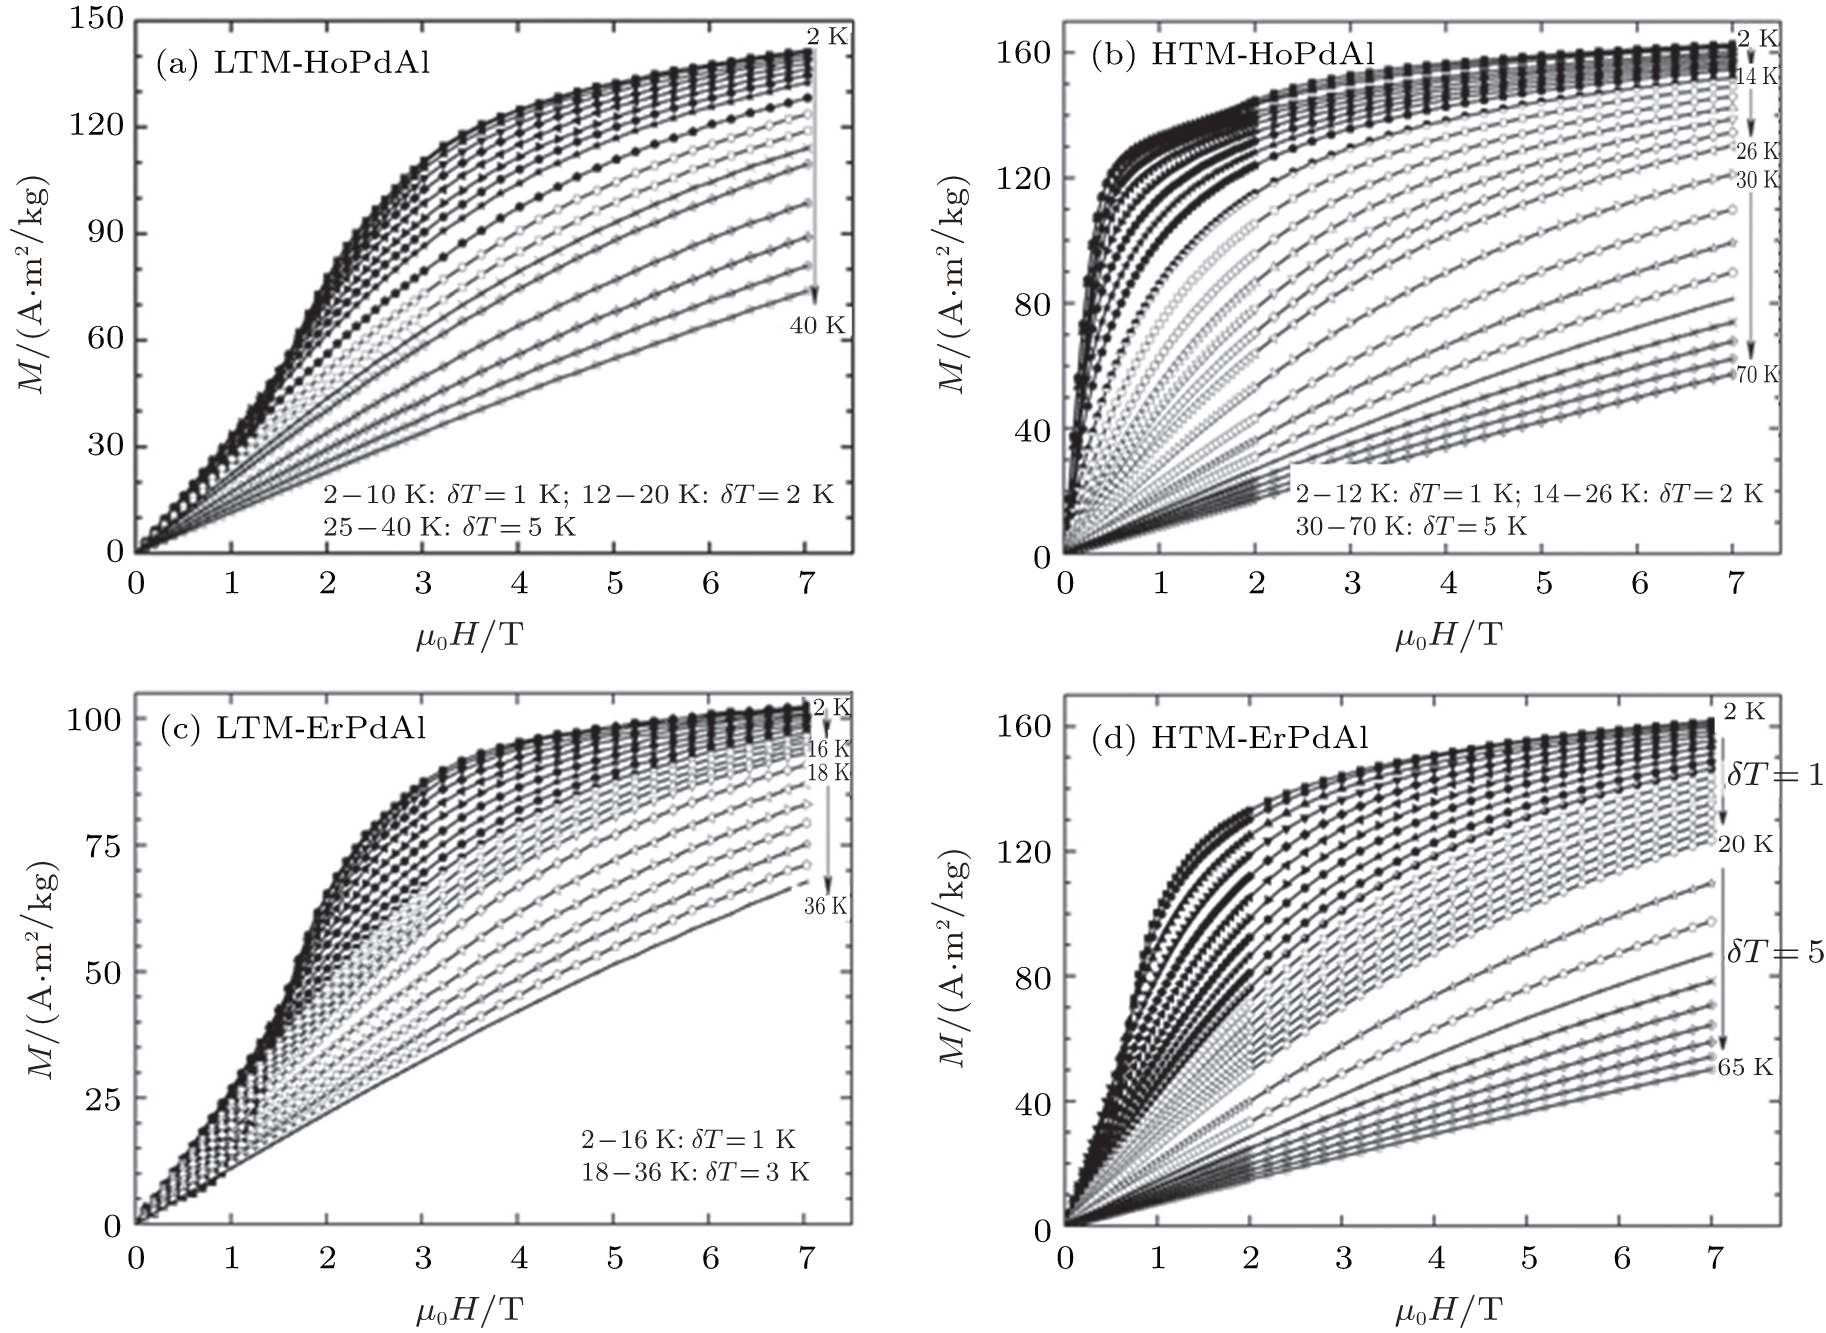 | Fig. 44. Magnetization isotherms of LTM-RPdAl and HTM-RPdAl (R = Ho and Er) under applied fields up to 7 T.[100, 101] |
The MCE of RTX (R = Gd– Tm, T = Fe– Cu and Pd, X = Al and Si) intermetallic compounds have been reviewed, and it is found that these compounds exhibit various magnetic properties and different MCE in a relatively low temperature range. Generally, the crystal structure and the magnetic ground state will not change with the variation of R atom-type from Gd to Tm. However, the transition temperature decreases with the R atom-type sweeping from Gd to Tm, indicating that the magnetic interactions (mainly RKKY interaction) may be strengthened. Meanwhile, the MCE increases with varying R atom from Gd to Tm and usually reaches the maximum value in Ho-based compounds, which is likely related to the high angular momentum J of Ho3+ ion. Usually, the T and X atoms do not contribute to the magnetic moments, due to the hybridization between d states of T and p states of X atoms. However, the change of either T atom or X atom results in different crystal and magnetic structures, affecting the MCE of RTX compounds. In addition, the crystal structures and magnetic properties of some RTX, such as RCuSi, RFeAl, and RPdAl, can be influenced by different treatment processes, leading to a large difference in MCE. Particularly, note that some of RTX compounds exhibit large reversible MCE, especially under low magnetic field change, making them promising candidates for magnetic refrigeration materials in a low temperature range, such as the liquefaction temperatures of helium, hydrogen, and nitrogen.
Although the MCE of many RTX compounds have been investigated systematically in the past decades, a lot of important problems, such as the regulatory mechanism of giant MCE, the relationship between heat treatment and physical properties, etc, have not been addressed sufficiently. In addition, other key issues closely related to the practical application of magnetic refrigeration, such as mechanical properties, corrosion behavior, preparation technique, etc, also need to be taken into account. Indeed, studies have revealed that RTX compounds exhibit large MCE in low temperature ranges, suggesting them as promising materials for low-temperature magnetic refrigeration. However, we still have a long way to go to realize the practical application of these materials in magnetic refrigeration.
| 1 |
|
| 2 |
|
| 3 |
|
| 4 |
|
| 5 |
|
| 6 |
|
| 7 |
|
| 8 |
|
| 9 |
|
| 10 |
|
| 11 |
|
| 12 |
|
| 13 |
|
| 14 |
|
| 15 |
|
| 16 |
|
| 17 |
|
| 18 |
|
| 19 |
|
| 20 |
|
| 21 |
|
| 22 |
|
| 23 |
|
| 24 |
|
| 25 |
|
| 26 |
|
| 27 |
|
| 28 |
|
| 29 |
|
| 30 |
|
| 31 |
|
| 32 | [Cited within:14] |
| 33 |
|
| 34 |
|
| 35 |
|
| 36 |
|
| 37 |
|
| 38 |
|
| 39 |
|
| 40 |
|
| 41 |
|
| 42 |
|
| 43 |
|
| 44 |
|
| 45 |
|
| 46 |
|
| 47 |
|
| 48 |
|
| 49 |
|
| 50 |
|
| 51 |
|
| 52 |
|
| 53 |
|
| 54 | [Cited within:4] |
| 55 |
|
| 56 |
|
| 57 |
|
| 58 |
|
| 59 |
|
| 60 |
|
| 61 |
|
| 62 |
|
| 63 | [Cited within:1] |
| 64 |
|
| 65 |
|
| 66 |
|
| 67 |
|
| 68 |
|
| 69 |
|
| 70 |
|
| 71 |
|
| 72 |
|
| 73 |
|
| 74 |
|
| 75 |
|
| 76 |
|
| 77 |
|
| 78 |
|
| 79 |
|
| 80 | [Cited within:1] |
| 81 |
|
| 82 |
|
| 83 |
|
| 84 |
|
| 85 |
|
| 86 |
|
| 87 |
|
| 88 |
|
| 89 |
|
| 90 |
|
| 91 |
|
| 92 |
|
| 93 |
|
| 94 |
|
| 95 |
|
| 96 |
|
| 97 |
|
| 98 |
|
| 99 |
|
| 100 |
|
| 101 |
|
| 102 |
|
| 103 |
|
| 104 |
|
| 105 |
|
| 106 |
|
| 107 |
|
| 108 |
|
| 109 |
|
| 110 |
|