


First-principles simulation of Raman spectra and structural properties of quartz up to 5 GPa*
[Liu Lei†a)  , Lv Chao-Jia
a) , Zhuang Chun-Qiangb) , Yi Lia) , Liu Honga) , Du Jian-Guoa) ]
, Lv Chao-Jia|
|


†Corresponding author. E-mail: liulei@cea-ies.ac.cn
*Project supported by the Key Laboratory of Earthquake Prediction, Institute of Earthquake Science, China Earthquake Administration (CEA) (Grant No. 2012IES010201) and the National Natural Science Foundation of China (Grant Nos. 41174071 and 41373060).
The crystal structure and Raman spectra of quartz are calculated by using first-principles method in a pressure range from 0 to 5 GPa. The results show that the lattice constants ( a, c, and V) decrease with increasing pressure and the a-axis is more compressible than the c axis. The Si–O bond distance decreases with increasing pressure, which is in contrast to experimental results reported by Hazen et al. [Hazen R M, Finger L W, Hemley R J and Mao H K 1989 Solid State Communications725 507–511], and Glinnemann et al. [Glinnemann J, King H E Jr, Schulz H, Hahn T, La Placa S J and Dacol F 1992 Z. Kristallogr.198 177–212]. The most striking changes are of inter-tetrahedral O–O distances and Si–O–Si angles. The volume of the
Vibrational property of mineral as a function of pressure, temperature, and composition has many applications in geosciences. Mechanical, elastic properties and phase transitions of materials can be studied by probing the vibrational dynamics. High-pressure Raman spectra are useful in characterizing materials of geological and geophysical interest. The analysis of vibrational spectra may be conducive to the understanding of the thermodynamic properties of solids at pressures that are beyond the range of direct thermochemical measurements.
Quartz is the second most abundant mineral after feldspar in the continental crust. Therefore, vibrational spectrum of quartz has been extensively studied.[1, 2] For example, the room temperature high-pressure Raman modes of quartz[3– 7] and the temperature dependence of the Raman spectra of quartz at atmospheric pressure[1, 4, 8– 13] were investigated experimentally. Nevertheless, there are evident discrepancies among the different studies.
Theoretical simulations can establish a link between the experimentally observed peaks in the spectra and the underlying atomic dynamics and structure. First principles methods have been successfully applied to geosciences and material science.[14– 19] They have also been used in calculating the Raman spectroscopic properties of SiO2.[20, 21] However, first-principles investigations of the high-pressure Raman spectra of quartz are rarely reported. This study aims to fill this gap by investigating the lattice deformation, and the structural and Raman spectral properties of quartz at high pressure using first-principles simulations.
Quartz belongs to the trigonal crystal system. It has two enantiomorphs with space groups P3121 and P3221, respectively, and nine atoms per unit cell (Z = 3).[22] Quartz is made of a continuous framework of Si– O tetrahedron 
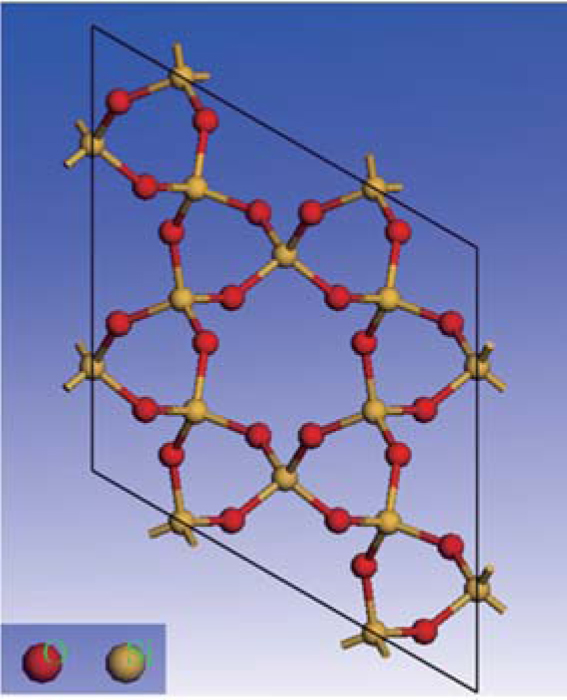 | Fig. 1. Atomic structure of quartz crystal (view from (001)). |
Vibrational spectra of crystalline solids can be interpreted by using the factor group analysis.[23] The irreducible representation of the optical vibrations of quartz for the D3 factor group is written as

where A1 is the Raman-active mode, A2 is the infrared-active mode, and E is the Raman- and infrared-active mode.
First-principles calculations were performed by using the density functional perturbation theory (DFPT), [24] the density functional theory (DFT), [25, 26] and the plane-wave pseudopotential technique as implemented in the CASTEP code.[27] Local density approximation (LDA) with CA– PZ parameterization[28, 29] was used for describing the exchange-correlation interaction. Norm-conserving pseudopotentials[30] were used to model the electron-ion interaction. A 6 × 6 × 5 Monkhorst– Pack grid of k points was adopted for sampling the Brillouin zone. The total-energy convergence criterion of 5 × 10− 7 a.u. (The unit a.u. is short for arbitrary units) was used in the self-consistent field calculations. The energy cutoff for the plane-wave basis was chosen to be 830 eV.
Within the plane-wave pseudopotential framework, the unit-cell stress tensor can be directly calculated by using the stress theorem.[31] The structure and Raman spectroscopic properties of quartz at pressure were calculated by simultaneously optimizing the lattice constants and atomic positions based on the principle that the Hellmann– Feynman forces and stresses act on the nuclei, and the lattice parameters were minimized.[31] The convergence criteria for the force and stress are 0.01 eV/Å and 0.02 GPa, respectively.
The spatial derivatives of the macroscopic polarization were numerically calculated along the eigenvectors of each Raman active phonon mode by calculating the polarization for each displacement through using the linear response formalism.[32] Once these derivatives are known, the Raman cross section can be calculated through appropriate space averaging. Computational and theoretical details of Raman spectra by using DFT can be found in the work of Porezag and Pederson[33] and Refson, et al.[24]
To assess the performances of the DFT and DFPT total-energy approach used here, test calculations of the cell parameters, elastic constants and frequencies of the Raman spectra of quartz are carried out under 0 K.
The differences between the calculated values of cell volumes, lattice parameters a and c and experimentally measured corresponding values[22, 34– 37] are 3.7%, 1.3%, and 1.1%, respectively. The inter- and intra-tetrahedral distances, angles, and volume of 

| Table 1. Selected interatomic distances and angles of quartz under ambient condition. |
The elastic constants are calculated by using the stress-strain approach. A total of 6 strains (– 0.005, – 0.003, – 0.001, 0.001, 0.003, 0.005) are used in calculating. Our DFT calculation reproduces the quartz elastic constants reasonably well under ambient condition (Table 2). The Raman frequencies of quartz are calculated at 0 GPa and compared with the experimental data to evaluate the performances of the DFT and DFPT method. The calculated frequencies show good agreement with previous experimental values (Table 3). The differences between the calculated and experimental frequencies[2, 4, 5] are less than 4.1% (mostly less than 1%), with the exception of 8.4% for the 206 cm− 1 mode. This bigger difference (8.4%) may come from the effect of pressure. The pressure derivative (dν i/dP) of 206 cm− 1 mode is the biggest (18.6 cm− 1/GPa as shown below) in all the modes of quartz, and we obtain the frequency under 0 GPa, but the experimental results are acquired under atmospheric conditions.
| Table 2. Some reported elastic parameters of quartz crystals under ambient condition. |
| Table 3. Frequencies of the Raman spectrum of quartz. |
For checking the precision of calculated plan, the structure, elastic constant and Raman frequency under higher energy cutoffs with 900 eV, 950 eV, 1000 eV, 1050 eV, 1100 eV, and 1200 eV are calculated. The calculations show the differences among lattice constants and among volumes are both smaller than 0.01%. The average difference of bulk modulus and shear modulus with different energy cutoffs are 4.8% and 2.2%, respectively. Differences among all Raman frequencies are all smaller than 1 cm− 1 with different energy cutoffs (830 eV, 900 eV, 950 eV, 1000 eV, 1050 eV, 1100 eV, and 1200 eV).
Consequently, the close agreement between the experimental and calculated values of lattice parameters, elastic properties and Raman frequencies demonstrate the validity of the computational scheme.
The structural properties of quart are calculated in a pressure range from 0 to 5 GPa in this work. The quartz transforms into coesite at about 2 GPa, [41] then transform into stishovite at 8 GPa, [42] and then transform into CaCl2-structure phase at 51 GPa, [43] and then transform into α -PbO2-structure phase at 98 GPa.[44] Though the pressure up to 5 GPa, no phase transitions happen in this study because the simulated temperature is 0 K.
Lattice parameters (a, c, and V) are fitted with a pressure-dependent quadratic function (Eq. (1))

where M denotes the lattice parameters (a, c, and V), P denotes the pressure, and Mi (i = 0, 1, 2) are the fitting coefficients.
The variations of lattice parameters with pressure are shown in Fig. 2. The calculated and experimental data are fitted with Eq. (1) and the results are listed in Table 4. The calculated lattice constants show better agreement with previous experimental results. The a and c reduce 3.9% and 2.4% with pressure increasing from 0 to 5 GPa. So the a axis is more compressible than the c axis.
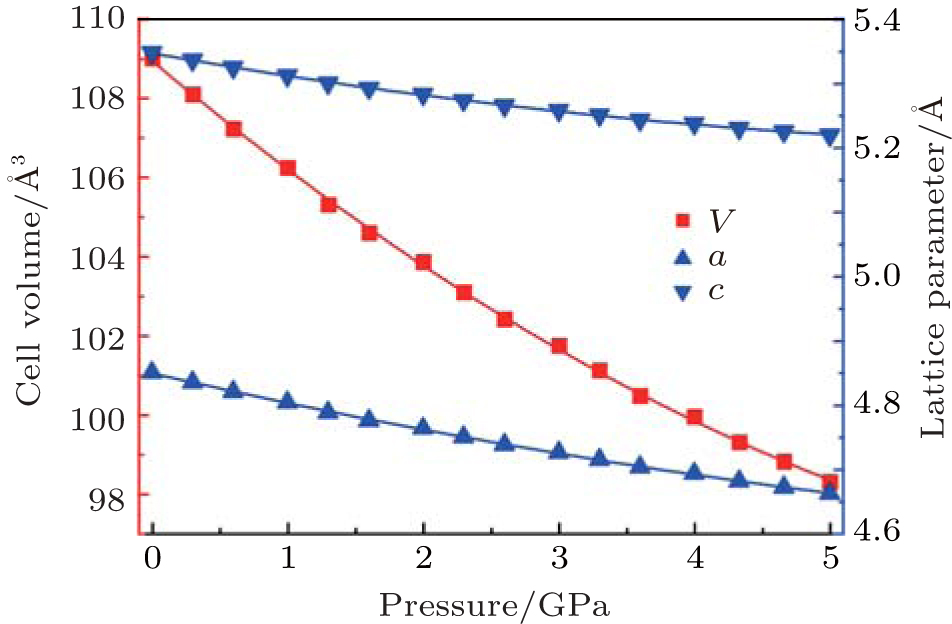 | Fig. 2. Variations of lattice parameter with pressure of quartz. |
| Table 4. Quadratic fitting of lattice parametes (a, c, and V) when pressure increase from 0 GPa to 5 GPa. |
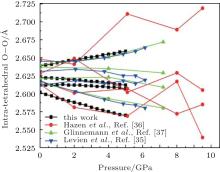
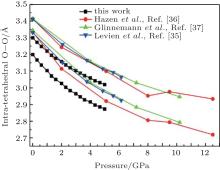
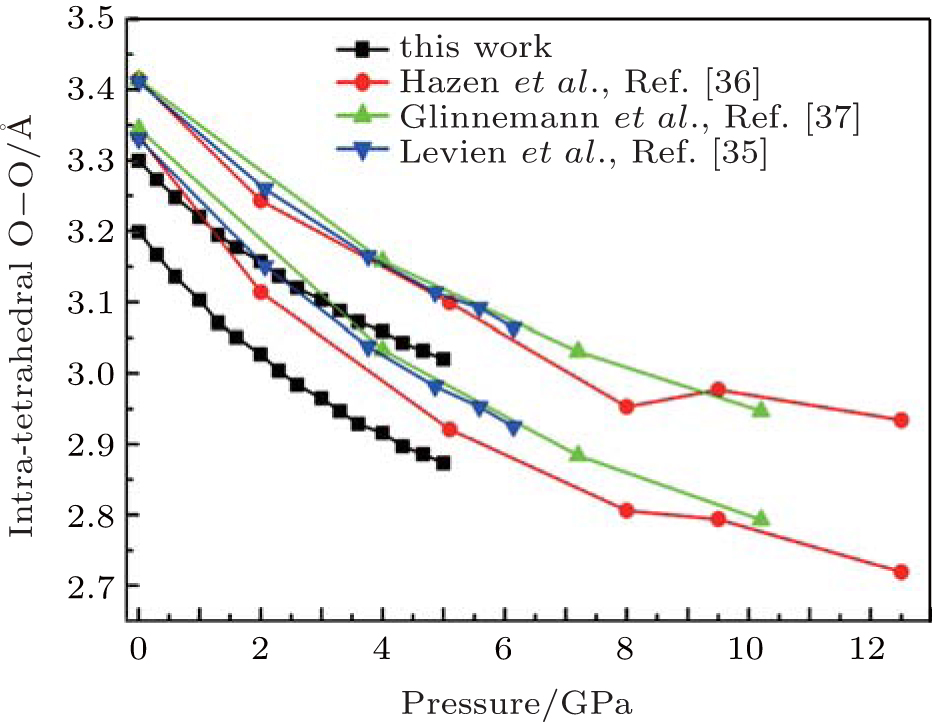
The intra-tetrahedral bond (O– O and Si– O distance) and bond angle (O– Si– O angle) both vary with pressure but not in the same manner (Figs. 3– 5).
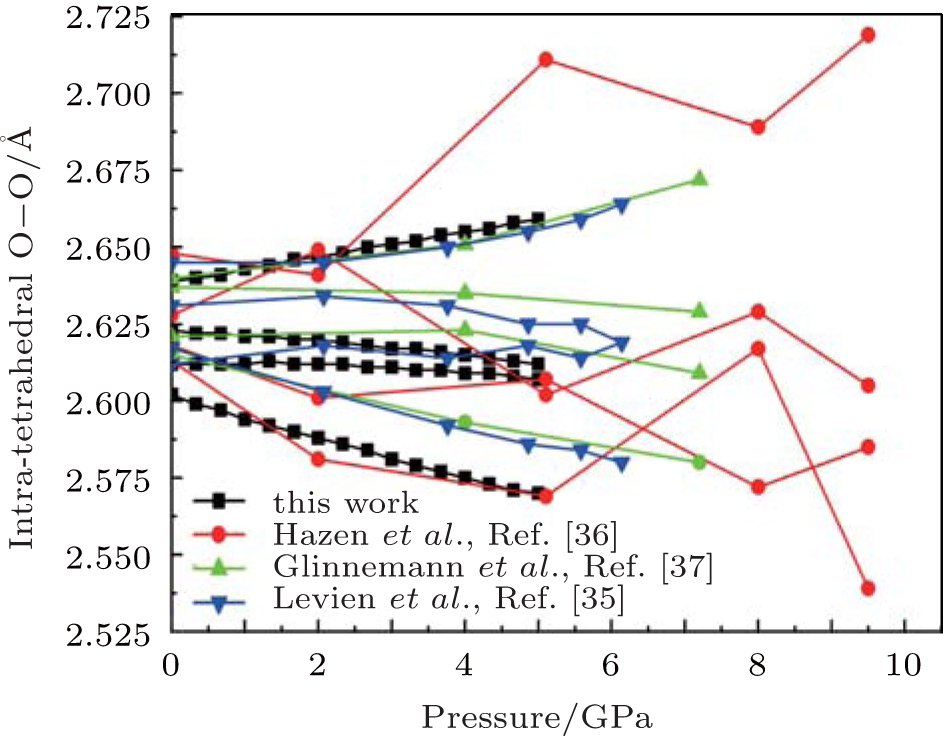 | Fig. 3. Changes of intra-tetrahedral O– O distance with pressure. |
 | Fig. 4. Changes of intra-tetrahedral Si– O distance with pressure. |
 | Fig. 5. Changes of intra-tetrahedral O– Si– O angle with pressure. |
The calculated results suggest four different intra-tetrahedral O– O distances in quartz (Fig. 3). The longest one increases linearly with increasing pressure, whereas the shortest one decreases linearly with increasing pressure and the rest decrease slightly. These variations completely agree with the experimental results.[35– 37] The difference between the longest and shortest O– O distances increases with increasing pressure as indicated by the increase in the 
The Si– O bond lengths at different pressures are shown in Fig. 4. The larger Si– O bond length slightly decreases from 1.607 Å to 1.604 Å and the shorter Si– O length decreases from 1.602 Å to 1.596 Å as pressure increases when the pressure increases from 0 to 5 GPa. The values of the larger Si– O length remains constant up to 10 GPa, [37] whereas Levien et al.[35] reported that the larger Si– O length decreased and Hazen et al.[36] reported that the larger Si– O length increased with increasing pressure. The calculated results agree with the experimental data of Levien et al.[35] All the shorter Si– O distances show decreasing with increasing pressure.
The largest O– Si– O angle linearly increases with increasing pressure, whereas the smallest one linearly decreases with increasing pressure. The calculated changes of O– Si– O angles in the SiO44 − tetrahedron with pressure well agree with the experimental results, [35, 37] however they are different from the results obtained by Hazen, et al.[36] The variations of O– Si– O angles with pressure show similar manners to those of intra-tetrahedral O– O distances. The differences between O– O distances and between O– Si– O angles increase with increasing pressure and suggest that the 
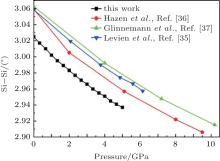
The inter-tetrahedral features of O– O and Si– Si distances and Si– O– Si angles at high pressures are calculated. The two shortest O– O distances between the 
 | Fig. 6. Changes of inter-tetrahedral O– O length with pressure. |
The correlation of the calculated and experimental[35– 37] Si– Si distance with pressure is shown in Fig. 7. Though the calculated values are smaller than the experimental values, the decreasing rates are similar. Figure 8 shows the variations of Si– O– Si angle data with pressure. The Si– O– Si angle obviously decreases with increasing pressure. The 
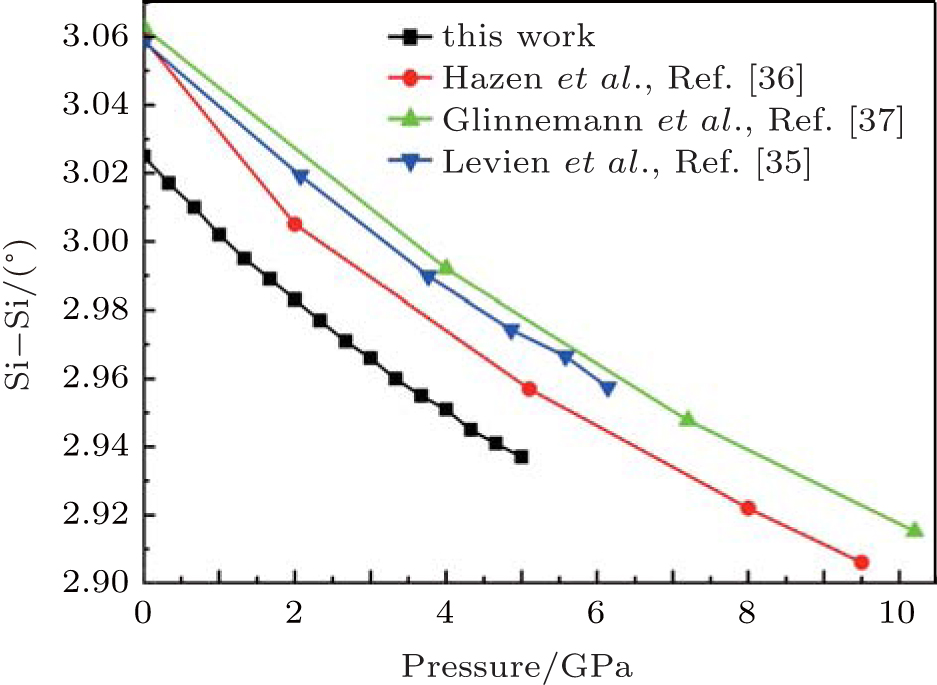 | Fig. 7. Changes of inter-tetrahedral Si– Si length with pressure. |
 | Fig. 8. Changes of inter-tetrahedral Si– O– Si angle with pressure. |
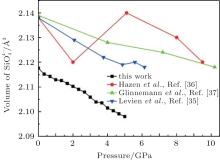
 | Fig. 9. Changes of volume of  |
The quartz cell volume decreases by 9.8% when the pressure increases from 0 GPa to 5 GPa. Most of oxide crystals are compressed by two principle structural mechanisms: the shortening of the metal– oxygen distances and the decreasing of metal– oxygen– metal angles.[45, 46] The intra-tetrahedral Si– O distance decreases by 0.3% and the volume of the 
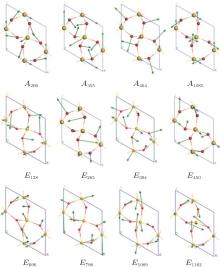
The vibrational patterns of quartz Raman modes are identified by visualizing the associated atomic motion with the aid of animation of the computed vibrational modes that were built in the CASTEP package and shown in Fig. 10, respectively.
 | Fig. 10. Schematic diagrams of vibrational model of quartz Raman mode (view from (001)). The arrow and its length indicate the direction of atomic motion and vibrational intensity. |
All A1 modes have the same Si atom vibrational directions and different vibrational intensities. The directions of Si atom translation within crystal plane are parallel to the [100], [010], and [110] directions. TheA355 mode has the strongest Si vibrational intensity and the A464 mode has the lowest vibrational intensity. For the O atom movement, the A355 and A464 modes have similar atomic vibrational intensities and opposite vibrational directions. The A206 and A1085 modes have similar atomic vibrational intensities and opposite vibrational directions. The vibrational intensities of the Si and O atoms in the A208 and A1085 modes are nearly identical. In the A464 mode, the vibrational intensity of the O atom is much larger than that of the Si atom; however, in the A355 mode, the vibrational intensity of the Si atom is much larger than that of the O atom. The E modes have complex and different vibrational modes.
The differences in direction and intensity among the different modes are attributed to the differences between the Si and O atom motions. Except for the E796 and A464 modes, the intensity of the O atomic vibration is larger than that of Si. The results suggest that the Raman vibration in quartz is mainly controlled by the deformation of the 
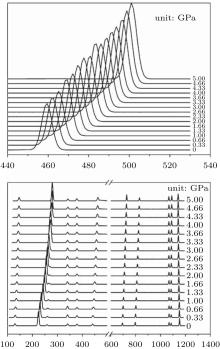
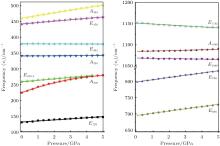
Raman shifts for the 12 frequencies of quartz are obtained at different pressures from 0 GPa to 5 GPa (Figs. 11 and 12). The calculated and experimental values for the pressure derivatives (dν i/dP) from 0 GPa to 5 GPa are listed in Table 5. The mode of the Raman spectrum of quartz can be roughly classified as two categories in terms of their pressure dependences. The frequencies in the first group are nearly independent of pressure (pressure derivative < 1 cm− 1/GPa). This category includes A355 and A1086 modes, which are associated with A1 symmetry, and E394 and E1069 modes, which are associated with E symmetry. The E1162 mode (pressure derivative = – 2.3 cm− 1/GPa) also may belong to this group. The second group consists of whose frequencies that change significantly with increasing pressure (pressure derivative > 3 cm− 1/GPa). This group includes the A206 and A464 modes of A1 symmetry and E128, E265, E450, E696, and E796 modes of E symmetry. The pressure derivatives of E394, E1069, and E1162 modes are negative with values of – 0.2, – 0.6, and – 2.3 cm− 1/GPa, respectively. The negative pressure shifts suggest the weakening of the structure along these normal coordinates.[5] The other modes have positive pressure derivatives.
 | Fig. 11. Raman spectra of quartz as a function of pressure. |
 | Fig. 12. Pressure dependences of quartz Raman frequency. |
| Table 5. Pressure shifts of the Raman modes of quartz. |
The A206 mode is strongly anharmonic[9, 10] and has the largest pressure derivative. The frequency shift of this mode with pressure is about 3 times greater than that of the ruby fluorescence lines. This mode can be used as an alternative pressure sensor to the ruby fluorescence technique for experiments at room temperature at pressures from 0 Gpa to approximately 5 GPa. The modes are likely to have large contribution from Si– O stretching motions, rotations of the Si– O– Si angles and 


Nonetheless, the experimental pressure derivatives of the Raman frequencies are different among the various studies. The calculated results fall within the scope of previously reported experimental data. Presumably, the calculations may serve as reference and supplement the experiments.
The structural and Raman vibrational properties of quartz are calculated by first principles method. Lattice constants (a, c, and V) are quadratic and fitted as a function of pressure and a axis is more compressible than c axis. So the differences between intra-tetrahedral O– O distances and between O– Si– O angles increase with pressure increasing, indicating that the 
The inter-tetrahedral O– O and Si– O lengths and Si– O– Si angle decrease with increasing pressure. The shortest inter-tetrahedral O– O distance at 0 GPa is 3.199 Å , which is significantly larger than 2.619 Å , the average value of intra-tetrahedral O– O distance. Volume of 
Raman frequency and vibrational model of each mode of quartz are calculated under pressures ranging from 0 GPa to 5 GPa. Raman vibrational model shows that the Raman vibration of quartz is mainly controlled by deformation of 
The spectra of elemental excitations vary with pressure, thus the associated phenomena can be effectively studied by in situ Raman spectra. The study of the changes in the Raman frequency of quartz at high pressure can help understand the stress conditions in the Earth’ s interior. Metamorphic pressures are assessed by using Raman spectra in quartz eclogites, epidote amphibolites, and amphibolite facie rocks with estimated residual pressures of 0.8 GPa– 1.0 GPa, 0.4 GPa– 0.6 GPa, and 0.1 GPa– 0.2 GPa, respectively. Apparently, Raman spectrum analysis of quartz is an effective and simple method of investigating the pressure conditions in metamorphic rocks.[48] We measured the shift of the Raman 464 cm− 1 vibrational mode in quartz grains from the Wenchuan earthquake fault zone and found that the stress near the fault plane was about 368 MPa.[49] Furthermore, the method can also be used in calcite, feldspar, olivine and other minerals from faults, tectonic boundaries, and mantle rocks, and this method is probably very useful when minerals are preserved in inclusions for understanding the stress condition of fault and tectonic interior. The first-principles simulations can help to quantify the pressure-dependent variations in the Raman frequencies of minerals. The combination of first-principles simulations and Raman spectroscopy experiments is a great exploration tool of terrestrial stress conditions
| 1 |
|
| 2 |
|
| 3 |
|
| 4 |
|
| 5 | [Cited within:2] |
| 6 |
|
| 7 |
|
| 8 |
|
| 9 |
|
| 10 |
|
| 11 |
|
| 12 |
|
| 13 |
|
| 14 |
|
| 15 |
|
| 16 |
|
| 17 |
|
| 18 |
|
| 19 |
|
| 20 |
|
| 21 |
|
| 22 |
|
| 23 |
|
| 24 |
|
| 25 |
|
| 26 |
|
| 27 |
|
| 28 |
|
| 29 |
|
| 30 |
|
| 31 |
|
| 32 |
|
| 33 |
|
| 34 |
|
| 35 |
|
| 36 |
|
| 37 |
|
| 38 |
|
| 39 |
|
| 40 |
|
| 41 |
|
| 42 |
|
| 43 |
|
| 44 |
|
| 45 |
|
| 46 |
|
| 47 |
|
| 48 |
|
| 49 |
|