Spin-valley quantum Hall phases in graphene
Tian Hong-Yu†
Spin-valley quantum Hall phases in graphene |
|
Tian Hong-Yu†
|
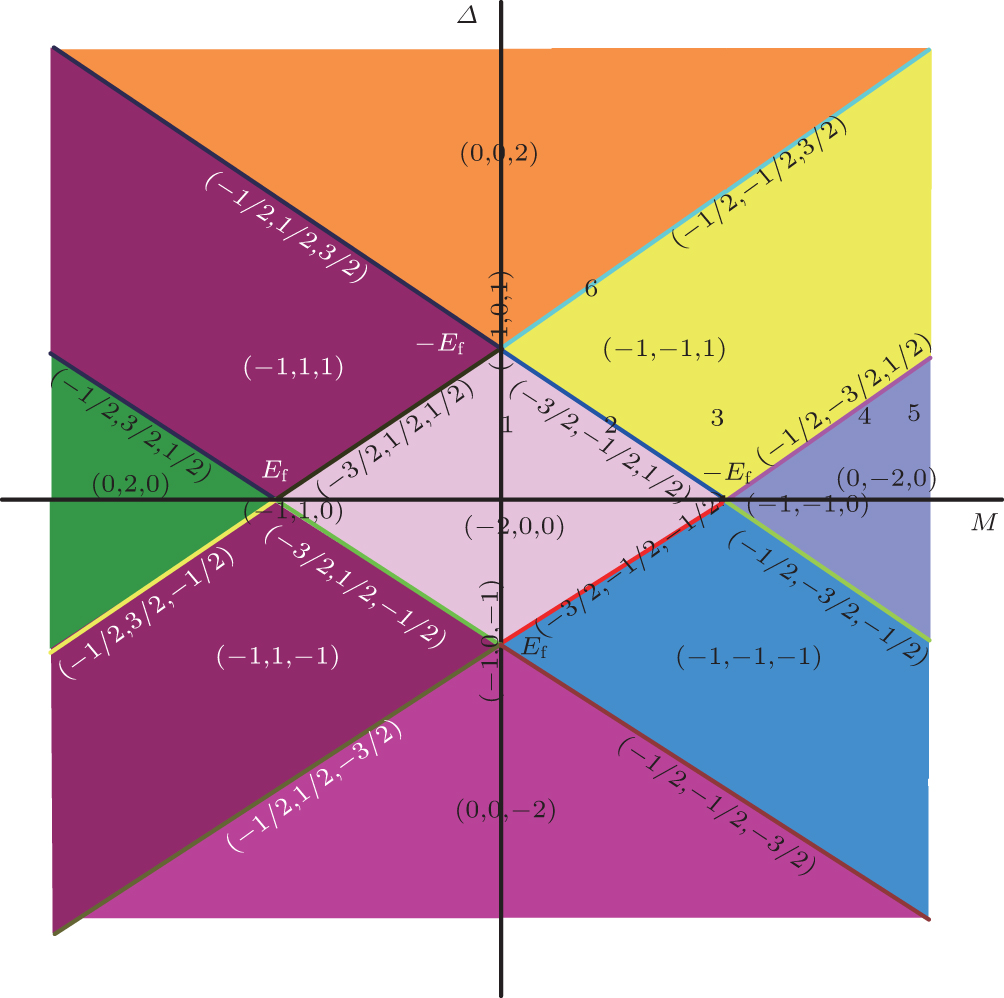
| Phase diagram in the M – Δ panel for the Fermi energy at E f = −0.05 t . Heavy lines represent phase boundaries, which represents the points where the Fermi energy crosses the flat part of the energy band. A number shows a point where the energy spectrum is calculated and shown in Fig. 5 . |
| |