


Saturated sodium chloride solution under an external static electric field: A molecular dynamics study
[Ren Gana), b) , Wang Yan-Ting†a)  ]
]
]


†Corresponding author. E-mail: wangyt@itp.ac.cn
*Project supported by the National Basic Research Program of China (Grant No. 2013CB932804) and the National Natural Science Foundation of China (Grant Nos. 91227115, 11274319, and 11421063).
The behavior of saturated aqueous NaCl solutions under a constant external electric field ( E) was studied by molecular dynamics (MD) simulation. Our dynamic MD simulations indicated that the irreversible nucleation process towards crystallization is accelerated by a moderate E but retarded or even prohibited under a stronger E, which can be understood by the competition between self-diffusion and drift motion. The former increases with E, thereby accelerating the nucleation process, whereas the latter pulls oppositely charged ions apart under a stronger E, thereby decelerating nucleation. Additionally, our steady-state MD simulations indicated that a first-order phase transition occurs in saturated solutions at a certain threshold Ec. The magnitude of Ec increases with concentration because larger clusters form more easily when the solution is more concentrated and require a stronger E to dissociate.
Ion nucleation and crystallization in ionic solutions are important for various scientific fields, such as physical science, [1, 2] materials science, [3] and biology.[4] The ion nucleation process can be qualitatively understood in terms of classical nucleation theory (CNT), [5, 6] in which particles form clusters through a nucleation process, and crystallization takes place when a cluster grows large enough to exceed the critical nucleus size. In CNT, the cluster size is regarded as the only order parameter to describe the nucleation process, and the change in the Gibbs free energy with cluster size n can be expressed as

where α is the free energy difference between the metastable liquid phase and the stable solid phase, and γ is the surface free energy of the interface between the solid and liquid phases. The critical nucleus size and nucleation rate are two main quantities used to describe a nucleation process in CNT.
In ionic solutions, the instantaneous cluster formation due to electrostatic interaction among ions is the precursor of an irreversible nucleation process.[7] Cluster formation in ionic solutions was proposed a long time ago based on an analysis of the difference between theoretical prediction and experimental results, [8] but only recently have some experiments[9, 10] involving enhanced experimental techniques observed instantaneous clusters formed in ionic solutions. In contrast, the microscopic properties of ionic clusters and the details of nucleation processes in solution can be better studied by computer simulation. With the aid of MD simulations, the cluster formation in NaCl solutions at ambient[11, 12] and supercritical[13] conditions was observed. Hassan[14, 15] explored the structural and dynamic properties of ion clusters in NaCl solutions, and Zahn[16, 17] studied the stable structures of nuclei in different ionic solutions. The nucleation at the interface of ionic solutions has also been studied.[18] Different nucleation pathways in CaCO3 solutions[19– 21] have been identified by MD simulation, which has revealed that the nuclei consist of liquid-like chains formed by ions rather than the spherical shape assumed in CNT and that the cluster stability deviates from the CNT prediction. Furthermore, our MD simulations[7] have demonstrated that ion distributions in an ionic solution are homogeneous only from an ensemble-averaged point of view and that the instantaneously formed ion clusters resulting from thermal fluctuations are the precursor of an irreversible nucleation process leading to ion crystallization.
By applying a static external electric field E to an ionic solution, Wien[22] experimentally observed the Wien effect that the conductance of weak electrolyte solutions increases with the intensity of E. Onsager and Kim[23] have theoretically explained the Wien effect from a Brownian motion perspective by showing that the dissociation constant for oppositely charged ions under E is different from that without E by a factor β = 1 + kE + (1/3)k2E2 + · · · , where k is a positive constant. Our previous calculations have also shown that ion clusters tend to be smaller in concentrated solutions when E is applied.[24]
Because an applied E destroys the homogeneity of an ionic solution, [24] an interesting question arises: How does the nucleation process in an ionic solution under E differ from the homogeneous nucleation process in the absence of E? In addition, because a crystallized cluster in a saturated solution is more stable than a disordered cluster in a concentrated solution, another interesting question is as follows: Can a crystallized cluster be destroyed by a small E and re-dissolve into the solution? Consequently, what will occur when E is applied to an ionic solution that has already crystallized? Does a different phase transition point exist from that observed without an external E?
To answer the above questions, in this work, we investigate two cases of saturated NaCl solutions by MD simulation: a set of dynamic MD simulations (evolving dynamically towards the non-equilibrium steady-state) to study the influence of E on the nucleation process and a set of steady-state MD simulations to study the effect of E to the thermodynamic properties of crystallized ionic solutions. Recently, MD simulations[25, 26] have shown that nucleation occurs along many different pathways, and thus, a single order parameter of cluster size is not sufficient to describe the nucleation process in a satisfactory manner. Moreover, the critical nucleus sizes calculated by different methods can be very different.[27] Therefore, in this work, we mainly discuss the influence of E on the nucleation rate rather than the cluster or nucleus size.
The paper is organized as follows: Section 2 contains a brief description of the simulation details and data analysis methods. The simulation results are described in Section 3, and Section 4 presents our discussion and conclusions.
In this section, we describe the details of our MD simulations, the heterogeneity order parameter (HOP) used to quantify the nucleation process, and the bond order parameters (BOPs) used to characterize different structures.
The CHARMM force field[28] for NaCl and the TIP3P[29] water model were used for all of the simulated ionic solutions. All ions and atoms are modeled as charged Lennard-Jones particles, and the interactions between atoms and/or ions are described as
where ri is the i-th atom (ion) position; σ and ε are the Lennard-Jones distance and energy constant, respectively; and qi is the partial charge of the i-th atom (ion). The corresponding force field data are listed in Table 1. All our MD simulations were performed with the GROMACS package, [30, 31] and the system temperature was kept constant by a Nosé – Hoover thermostat.[32, 33] The simulated systems contained 3000 water molecules and different pairs of Na+ and Cl− corresponding to different concentrations above the saturation point, which was determined to be approximately 5 M by our previous MD simulations.[7] The selected system size was much larger than those used in some previous studies[16, 18] and should be statistically adequate. The periodic boundary conditions were applied to all three dimensions, and the particle mesh Ewald algorithm[34] was employed to calculate the long-range electrostatic interactions.
Ions and H2O molecules were placed in a cubic box whose side length was first determined by a 5-ns constant NPT simulation at T = 300 K and P = 1 atm (1 atm = 1.01325× 10⁵ Pa) to determine the system density. A random configuration was chosen from a 2-ns NVT MD simulation at T = 2000 K as the initial configuration for a 250-ns dynamic NVT MD simulation procedure under E at T = 300 K to investigate the nucleation process. Another 10-ns steady-state MD simulation under the same conditions was also performed to study the influence of E on crystallized solutions that was first run for 250 ns to allow the system to reach its non-equilibrium steady state before sampling. The time step for all MD simulations was 1 fs, and the configurations were sampled every 1000 steps for data analysis.
| Table 1. CHARMM force field parameters for Na+ and Cl− and TIP3P water model parameters. |
The HOP was adopted to characterize the homogeneity of the simulated solutions. The HOP of an ion is defined as
where ri j is the distance between ions i and j corrected with the periodic boundary condition and λ = L/N1/3, where L is the side length of the cubic simulation box and N is the total number of ions in the configuration. The HOP for an instantaneous configuration is defined to be the average HOP over all ions as

The HOP was initially defined to characterize the tail aggregation phenomenon in ionic liquids.[35] Similar to the radial distribution function (RDF), it can be used to characterize the structure of a system. A rigorous connection between the HOP and the RDF was given in Ref. [36]. To obtain a value close to zero when the ion distribution is nearly uniform, the reduced HOP is defined as

where h̃ 0 is the HOP for an ideally uniformly distributed system. The values of h̃ 0 for different sizes are listed in Ref. [34].
The BOPs[37, 38] were employed to distinguish crystalline structures from the liquid structure. A bond is defined as the vector joining a pair of neighboring particles whose inter-atomic distance is less than a cutoff. In this work, we set the cutoff to be 0.36 nm, which is the first minimum position in the Na+ – Cl− RDF. Each bond r is associated with a local BOP

where Ylm(θ (r), ϕ (r)) is the spherical harmonic function and θ (r) and ϕ (r) are the polar and azimuthal angles of the bond r with respect to a chosen fixed reference frame. In our calculations, we only consider the even-l BOPs because they are independent of the specific choice of the reference frame. The global BOP is defined as the average BOP over all bonds

where Nb is the number of bonds, and the summation runs over all bonds. To make the BOP rotationally invariant, it is useful to consider the combinations of
and
where the coefficients 

It is generally sufficient to determine a crystal structure by the combination of four BOPs — Q4, Q6, W4n, and W6n — whose values for several crystalline structures are listed in Table 2.
| Table 2. BOPs for different structures, including the liquid state, simple cubic (sc), body-centered cubic (bcc), face-centered cubic (fcc), and hexagonal-close-packed (hcp) structures. |
In this section, we mainly discuss the influence of E on the nucleation process of ions and the crystallized solution based on our MD simulation results.
To obtain a panoramic view of the nucleation process with or without E, we employed the HOP to describe the nucleation process. A larger HOP value corresponds to a more heterogeneous configuration, indicating that ions aggregate more tightly to form clusters during the nucleation process. The calculated HOPs with time under different Es at concentrations of c = 5.45 M and 6.24 M are shown in Fig. 1.
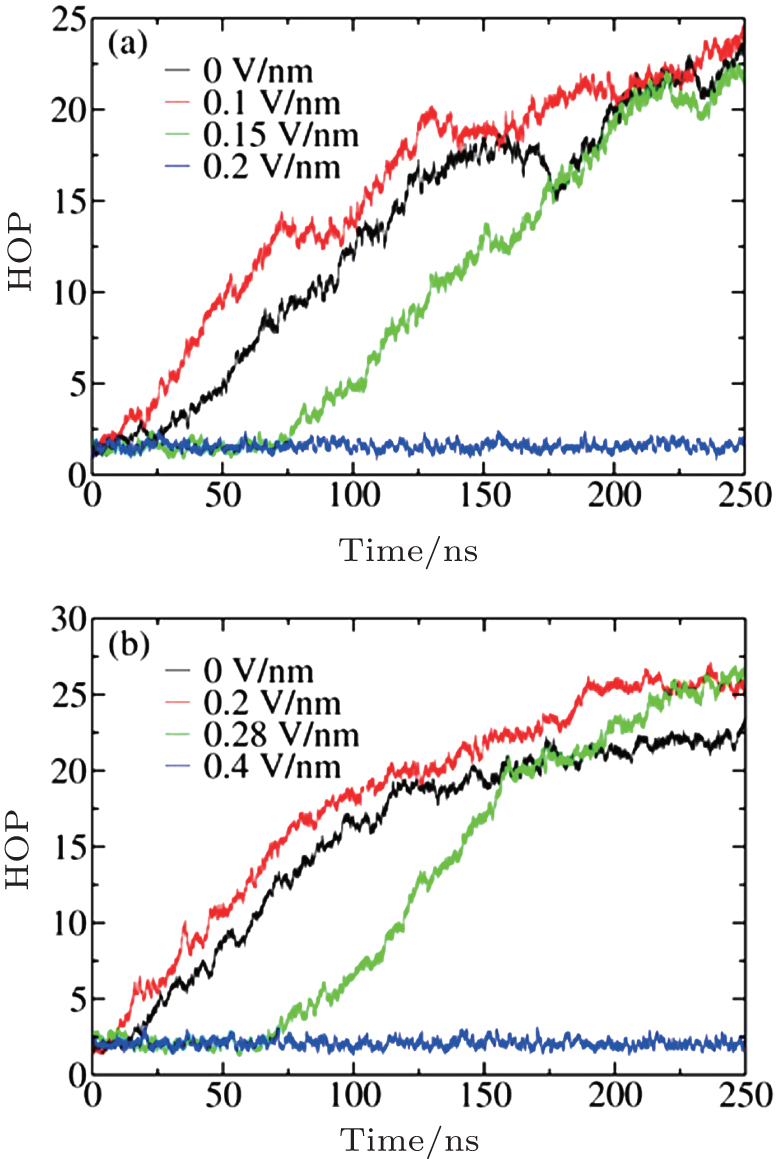 | Fig. 1. HOP evolves with simulation time under different Es at c = 5.45 M (a) and 6.24 M (b). |
It can be seen that the applied E has a strong influence on the nucleation process. No nucleation or even crystallization occurs in the solution when a strong E is applied, and the HOPs fluctuate around a small value. Nucleation and crystallization can occur when a moderate E is applied, and the HOP initially fluctuates around a mean value and then continuously increases with time. When crystallization is able to occur, the nucleation onset time ts non-monotonically depends on E. For instance, when c = 5.24 M, ts is approximately 10 ns at E = 0.1 V/nm, 15 ns at E = 0, and 75 ns at E = 0.15 V/nm.
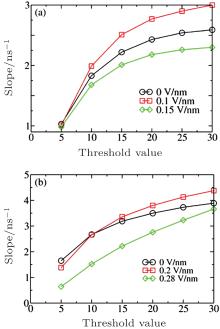
We employed the threshold method proposed by Yasuoka and Matsumoto to determine the nucleation rates.[39, 40] In this method, the number of ions in a cluster larger than a certain threshold value is calculated versus the simulation time, and the nucleation rate defined in CNT is simply the slope of the characteristic linear region of the nucleation growth line divided by the volume. The clusters in our sampled configurations were determined according to Hassan’ s definition:[15] an ion cluster is an array of ions in which each ion is connected with at least one another ion. Two ions are considered connected if the distance between them is smaller than a certain cutoff; in this work, 0.36 nm, the position of the first minimum of the Na+ – Cl− RDF, was chosen. The calculated slopes of nucleation at c = 5.45 M and 6.24 M with six different threshold values under three different Es are plotted in Fig. 2. We can see that the electric field can either accelerate or decelerate the nucleation process. For instance, at c = 5.45 M, the nucleation rate at E = 0.1 V/nm is greater than that at E = 0, whereas the nucleation rate becomes smaller at E = 0.15 V/nm. At the threshold value of 20, the nucleation rates are very close to their final values. Therefore, we set the threshold value to 20 to calculate the time evolutions of ion numbers in large clusters (larger than 20 ions), and the corresponding curves are plotted in Fig. 3.
 | Fig. 2. Nucleation rates with different threshold values under different Es at c = 5.45 M (a) and 6.24 M (b). |
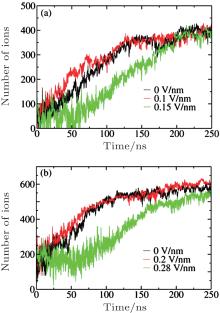
 | Fig. 3. Number of ions in clusters exceeding the threshold value of 20 evolving with simulation time under different Es at c = 5.45 M (a) and 6.24 M (b). |
The general processes of cluster nucleation and growth can be observed in Fig. 3 and have almost the same trend as the HOP shown in Fig. 1. The vibrational fluctuations of the growth lines arise from frequent cluster– cluster collisions in the highly saturated solution. Similar to the time evolution of the HOP, the number of ions first fluctuates widely and shows no apparent increase before it begins to grow almost linearly with time. As time passes, the nucleation rate decreases because the ions are gradually depleted from the solution through crystallization. Finally, each growth line approaches a plateau at which the average number of ions does not change with time, indicating that the nucleation process is complete. The final numbers of ions at the plateau are almost the same, demonstrating that E does not affect the degree of nucleation. From Figs. 3(a) and 3(b), we can also estimate the nucleation onset time, ts (E), which exhibits the same sequence as the HOP shown in Fig. 1: ts (0.1 V/nm) < ts(0) < ts(0.15 V/nm) at c = 5.45 M and ts (0.2 V/nm) < ts(0) < ts(0.28 V/nm) at c = 6.24 M.
All the above results indicate that at c = 6.24 M, the nucleation process at E = 0.1 V/nm is easier than that without E, as evidenced by the fact that the nucleation process starts earlier and is faster. Conversely, at E = 0.15 V/nm, this process starts later, and the nucleation rate is smaller than at E = 0. The same trend is observed for c = 5.45 M. These results indicate that applying a suitable E can increase the nucleation rate, whereas applying an E that is too strong will decelerate the nucleation process or even prevent crystallization.
To elucidate the microscopic mechanism underlying the above phenomena, we then analyzed ion motions in the NaCl solutions under E. The displacement of an ion consists of thermodynamic motion and drift motion driven by E

where R(t) is the total displacement of an ion, Rr(t) is the displacement due to thermal motion, and vd is the drift velocity induced by E. Taking into account the randomness of thermal motion 〈 Rr(t)〉 = 0 and using Einstein relation 〈 Rr(t)2〉 = 6Dt, we obtain the mean square displacement (MSD)

where D is the diffusion coefficient.
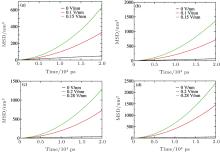
The calculated MSDs are shown in Fig. 4, and the fitted ion drift velocities and diffusion coefficients are listed in Tables 3 and 4 for c = 5.45 M and 6.24 M, respectively.
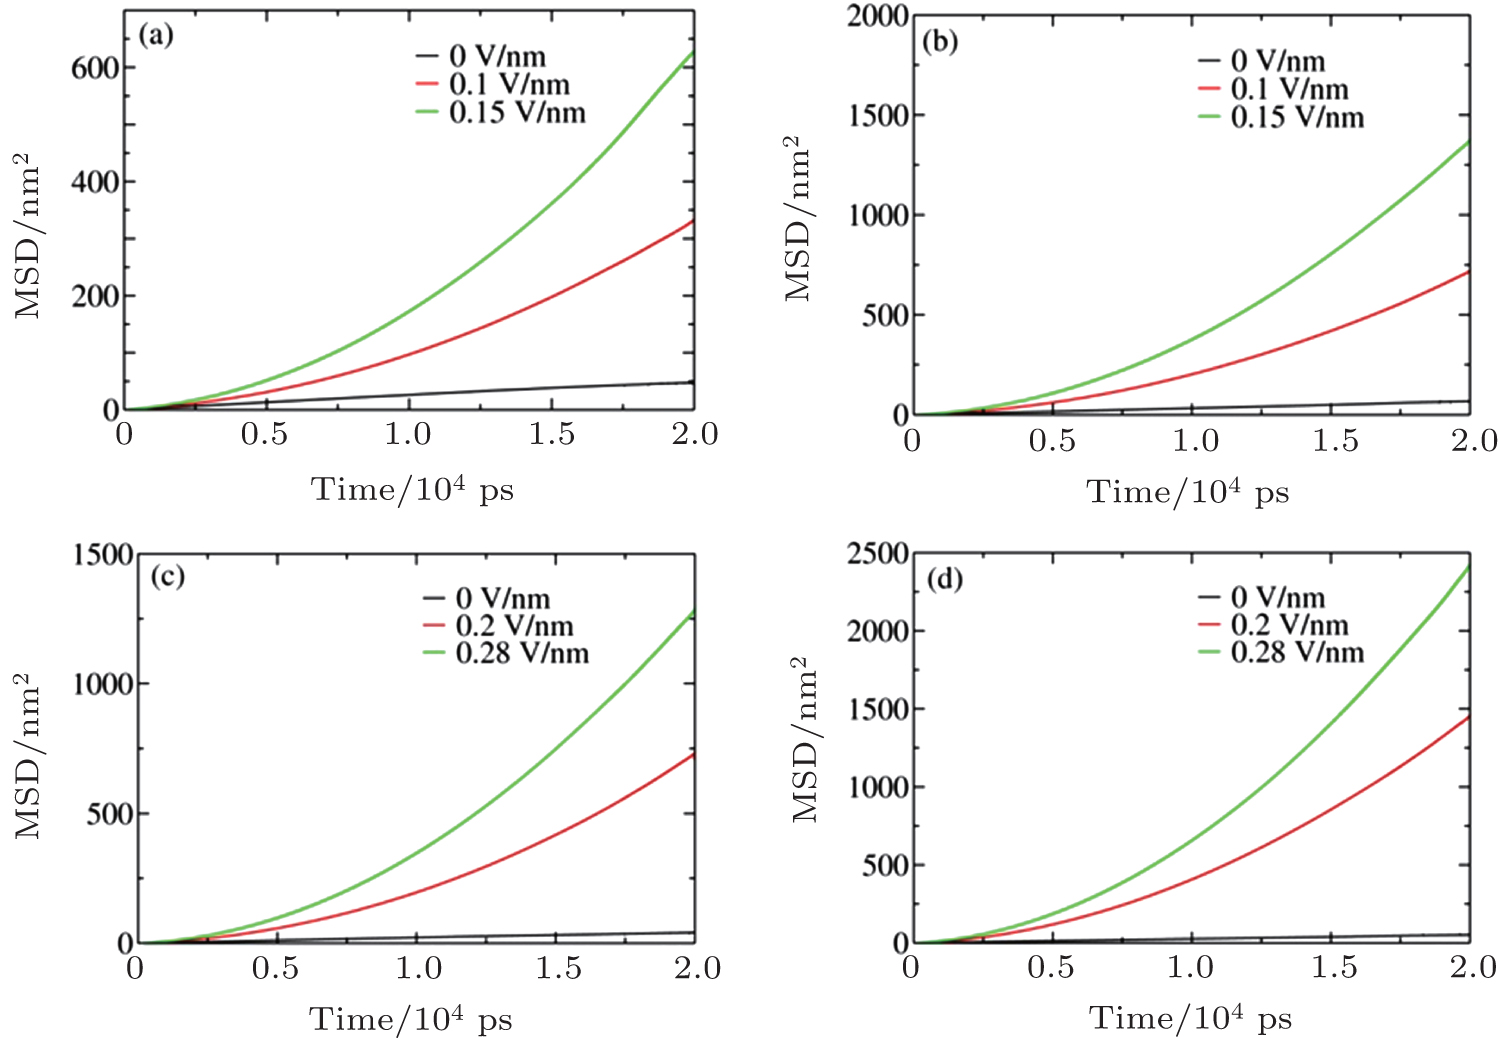 | Fig. 4. Mean square displacements of (a) Na+ at c = 5.45 M, (b) Cl− at c = 5.45 M, (c) Na+ at c = 6.24 M, and (d) Cl− at c = 6.24 M under different Es. |
| Table 3. Diffusion coefficients and drift velocities of Na+ and Cl– under different Es at c = 5.45 M. |
| Table 4. Diffusion coefficients and drift velocities of Na+ and Cl– under different Es at c = 6.24 M. |
As the data show, ion diffusion and drift velocity increase with E; the underlying mechanism has been reported in Ref. [24]. Because the ions are solvated and surrounded by water molecules, they must pass through the solvation shell composed of those water molecules to associate and nucleate.[41] Increasing the ion diffusion and drift motion can promote ion transport through water shells and thus accelerate the nucleation process because the nucleation rate is governed by diffusion. However, as shown in Tables 3 and 4, Na+ and Cl− move in opposite directions, which hinders ion association. Therefore, the observed non-monotonic influence of E on the nucleation rate can be attributed to the competition between random self-diffusion and ion drift in opposite directions.
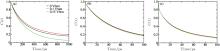
To further validate the above mechanism, we calculated the residence correlation time functions defined as C(t) = 〈 p(0) p(t)〉 , where p(t) is 1 if a given ion remains in the same ion shell at time t and 0 otherwise, and the angular bracket represents the ensemble average over all sampled trajectories. The C(t) for Na+ – Cl− , Na+ – H2O, and Cl− – H2O at c = 5.45 M are plotted in Fig. 5, which characterizes the lifetime and stability of a solvation shell from a dynamic perspective. We can see that the Na+ – Cl− stability with respect to E shows the order 0.1 V/nm > 0 > 0.15 V/nm and that the ion solvation shell stability obeys 0 > 0.1 V/nm > 0.15 V/nm, consistent with the change in the nucleation rate with respect to E and the above mechanism. Those results differ from the prediction obtained according to Onsager and Kim’ s theory[23] and our previous simulations[24] conducted for concentrated but not saturated solutions.
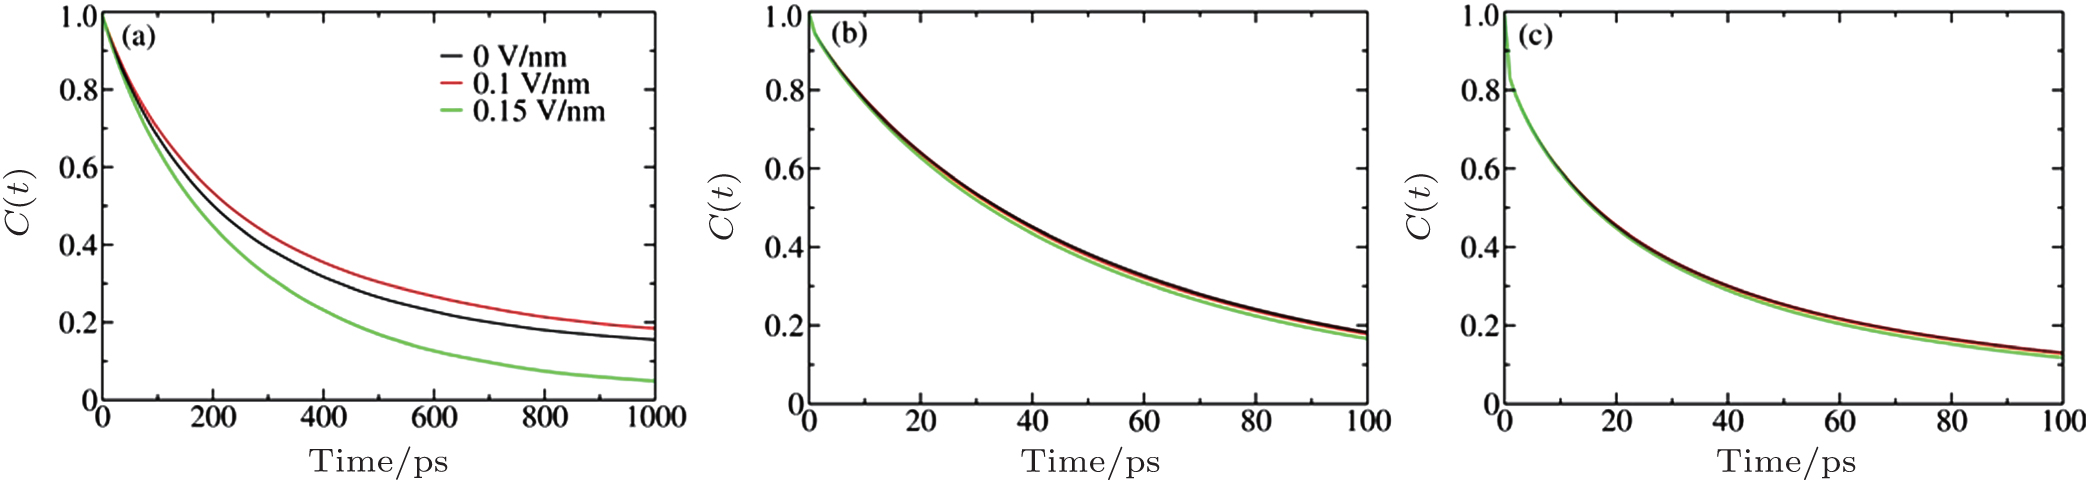 | Fig. 5. Residence correlation time functions at c = 5.45 M under different Es: (a) Na+ – Cl− , (b) Na+ – H2O, and (c) Cl− – H2O. |
In this section, we explore the influence of applied E on crystallized NaCl solutions. After crystallization, a certain amount of ions associate to form ordered structures, with Na+ or Cl− ions forming the face-centered cubic (fcc) crystalline structure with an overall simple cubic (sc) crystalline structure. Onsager and Kim’ s theory[23] states that the associated ion pairs in saturated solutions tend to dissociate in a manner that is nearly proportional to E. If this theory can also be applied to the crystallization case, the formed crystals should re-dissolve in water when an E is applied. We employed the BOPs to quantify the influence of E on the solutions after crystallization at c = 5.45 M and 6.24 M. The calculated BOPs for the ions are shown in Figs. 6 and 7.
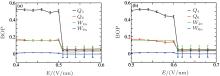
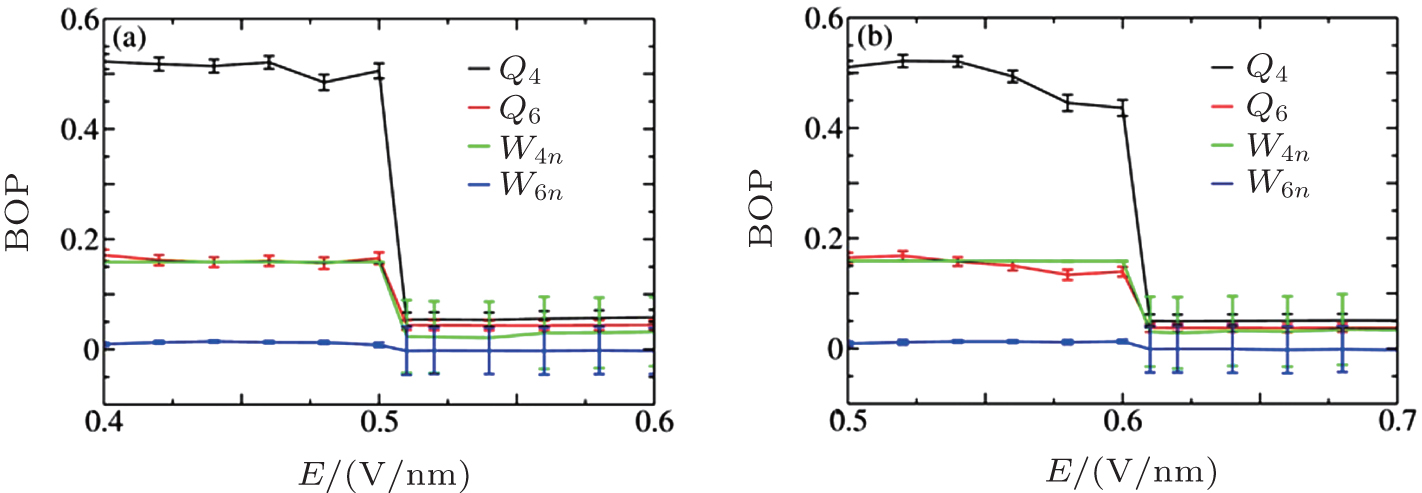 | Fig. 6. BOPs for ions at c = 5.45 M (a) and 6.24 M (b). |
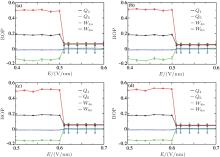
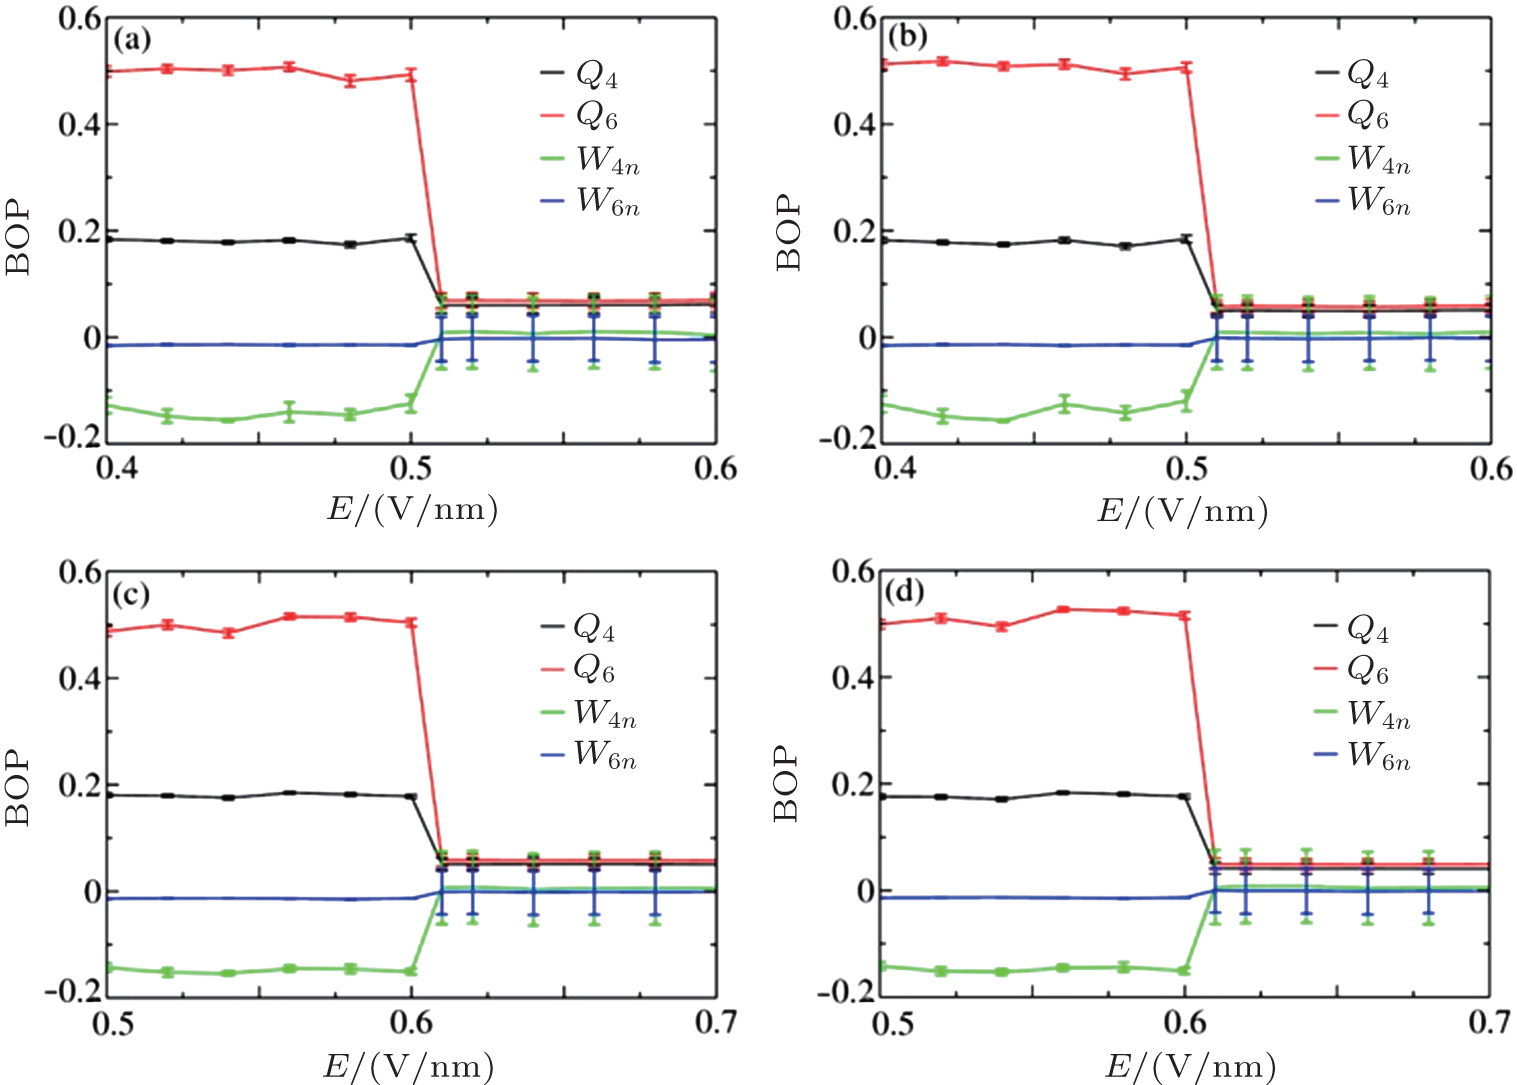 | Fig. 7. BOPs for different ion species at different concentrations: (a) Na+ at 5.45 M, (b) Cl− at 5.45 M, (c) Na+ at 6.24 M, and (d) Cl− at 6.24 M. |
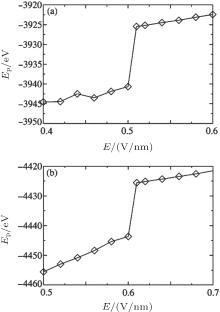
The calculated BOPs demonstrate that Na+ and Cl− ions indeed form fcc and that their overall structure is sc. Because of the limited simulation size and ions at the interface, the calculated BOP values slightly deviate from the ideal values listed in Table 2. When E is increased, the BOPs remain almost unchanged up to a certain Ec, after which they abruptly exhibit a near-zero value and then remain almost unchanged, indicating a first-order phase transition. Therefore, Onsager and Kim’ s theory cannot be applied to crystallized solutions because it predicts a continuous change in the structure as E is increased rather than an abrupt one. The system potential energy as a function of E was also calculated and is shown in Fig. 8. The potential energy has an abrupt change at Ec, further characterizing a first-order phase transition.
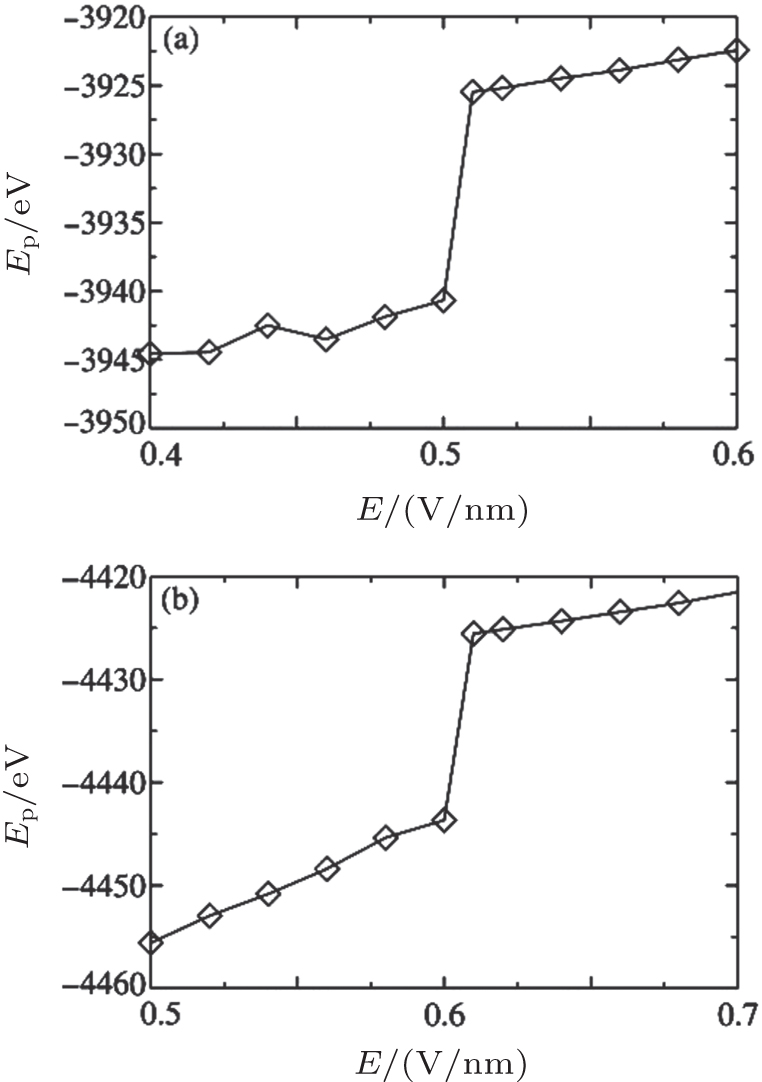 | Fig. 8. Potential energy as a function of E at c = 5.45 M (a) and 6.24 M (b). |
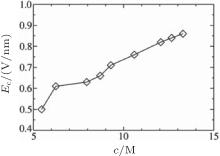
Based on the simulation data, we further determined that Ec ≈ 0.5V/nm for c = 5.45 M and Ec ≈ 0.6 V/nm for c = 6.24 M. This tendency can be explained by investigating the cluster sizes in the solutions. As shown in Fig. 9, larger clusters form in the solution at c = 6.24 M than at 5.45 M. Because the electrostatic interaction in a larger cluster is stronger than that in a smaller cluster, a larger E is required to dissociate a larger cluster. Consequently, Ec is larger for a more concentrated solution, as can be seen in Fig. 10.
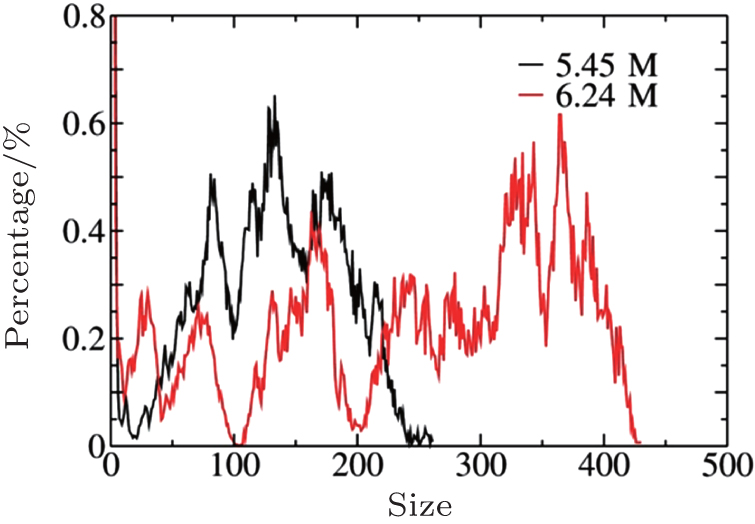 | Fig. 9. Cluster distributions for the NaCl solutions at c = 5.45 M and 6.24 M. |
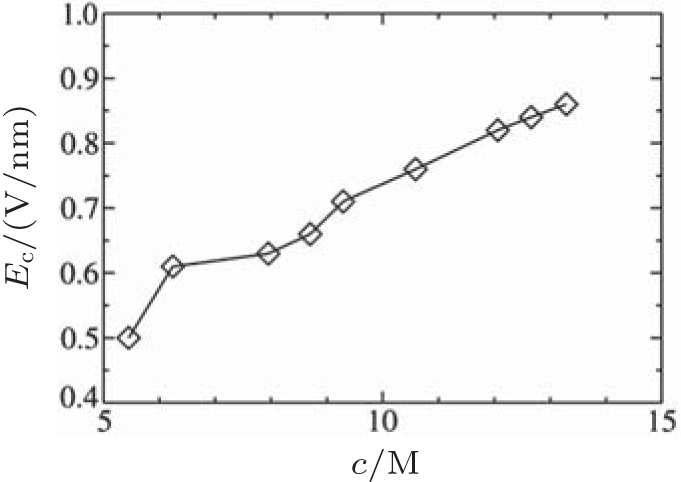 | Fig. 10. Transition point Ec with respect to the ionic solution concentration. |
In conclusion, we have performed a series of non-equilibrium MD simulations of saturated NaCl solutions to investigate the influence of an external static electric field on their nucleation process and crystallization phase transition. We have found that the external field E can either accelerate or decelerate the nucleation process depending on the strength of E. For a moderate E, the nucleation process starts earlier and progresses faster, and the ions are more likely to associate to form stable structures than without E, unlike Wien’ s observation[22] and our previous simulations of unsaturated solutions.[24] In contrast, a strong E retards the nucleation process and may even prevent crystallization. The degree of nucleation does not change with E when crystallization can occur. Those observations can be understood by considering the competition between ion self-diffusion and drift motion. When an E is applied, the increased random self-diffusion and drift motion allow ions to pass through their solvation shells and associate more easily. However, the increased drift motion also hinders the association of the oppositely charged ions. The competition between these two factors results in the non-monotonic change in the nucleation speed with respect to E.
The BOPs and the potential energy calculated for the configurations sampled from the steady-state MD simulations both exhibit an abrupt change at the transtion point Ec, indicating a first-order phase transition. A more concentrated solution had a larger Ec, which can be explained by the fact that larger clusters form more easily in a more concentrated solution, and thus, a larger E is required to dissociate such clusters. The observed phenomena and proposed mechanisms support the wide applications of ionic solutions in various chemical and biological systems.
Allocations of computer time from SCCAS and HPC Cluster of SKLTP/ITP-CAS are gratefully acknowledged.
| 1 |
|
| 2 |
|
| 3 |
|
| 4 |
|
| 5 |
|
| 6 |
|
| 7 |
|
| 8 |
|
| 9 |
|
| 10 |
|
| 11 |
|
| 12 |
|
| 13 |
|
| 14 |
|
| 15 |
|
| 16 |
|
| 17 |
|
| 18 |
|
| 19 |
|
| 20 |
|
| 21 |
|
| 22 |
|
| 23 |
|
| 24 |
|
| 25 |
|
| 26 |
|
| 27 |
|
| 28 |
|
| 29 |
|
| 30 |
|
| 31 |
|
| 32 |
|
| 33 |
|
| 34 |
|
| 35 |
|
| 36 |
|
| 37 |
|
| 38 |
|
| 39 |
|
| 40 |
|
| 41 |
|