


Effects of temperature gradient on the interface microstructure and diffusion of diffusion couples: Phase-field simulation
[Li Yong-Sheng† , Wu Xing-Chao, Liu Wei, Hou Zhi-Yuan, Mei Hao-Jie]
, Wu Xing-Chao, Liu Wei, Hou Zhi-Yuan, Mei Hao-Jie]
|
|


†Corresponding author. E-mail: ysli@njust.edu.cn
*Project supported by the National Natural Science Foundation of China (Grant No. 51571122) and the Fundamental Research Funds for the Central Universities, China (Grant No. 30920130121012).
The temporal interface microstructures and diffusions in the diffusion couples with the mutual interactions of the temperature gradient, concentration difference and initial aging time of the alloys are studied by phase-field simulation, and the diffusion couples are produced by the initial aged spinodal alloys with different compositions. Temporal composition evolution and volume fraction of the separated phase indicate the element diffusion direction through the interface under the temperature gradient. The increased temperature gradient induces a wide single-phase region on two sides of the interface. The uphill diffusion proceeds through the interface, no matter whether the diffusion direction is up or down with respect to the temperature gradient. For an alloy with short initial aging time, phase transformation accompanying the interdiffusion results in the straight interface with the single-phase regions on both sides. Compared with the temperature gradient, composition difference of diffusion couple and initial aging time of the alloy show greater effects on diffusion and interface microstructure.
The interdiffusion between the layers of the metallic multilayer can change the interface microstructure as temperature increases, which happens in the component of alloy coating, the interconnection of the packaging structure and multilayer thin film.[1– 4] From surface to inner, the temperature gradient arises from the temperature difference of layers, the element interdiffusion through the interface and the interface microstructure will be changed thereby. As a result, the mechanical and physical properties of the multilayer metal are affected. Numerous studies have been performed on the interface reaction and interdiffusion layers metals, [5– 11] in which the diffusion couple is widely used as the model to study the interdiffusion and microstructure of multilayer metal.
The diffusion path and microstructure evolution in the isothermal and stress-free multilayer diffusion couples formed by the model ternary alloy with miscibility gap have been studied by Pan et al.[12] by using the phase-field simulation. Sohn and Dayananda[13] studied the double-serpentine diffusion path in annealed Fe– Ni– Al alloys, the average values of ternary interdiffusion coefficients were determined and employed to model the concentration profiles. As an important factor, the temperature gradient[14– 18] has been studied in the bulk solid system for the diffusion and microstructure evolution. Hofman et al.[14] calculated the constituent redistribution driven by the temperature gradient based on a thermal diffusion mechanism model. Hu and Henager Jr[15] investigated the void diffusion under an applied temperature gradient field by using the Cahn-Hilliard diffusion equation, and they demonstrated that the voids migrate up the temperature gradient. Mohanty et al.[16] devised a diffuse interface model to simulate the effects of temperature gradient on the composition and microstructure of stress free binary alloy, and their heat transport model indicates that both atomic mobility and heat transport affect the magnitude and direction of flux. Snyder et al.[17] simulated the Ostwald ripening under the temperature gradient by using the steady-state diffusion equation; they found that the volume fraction of particles decreases in high temperature regions, increases in low temperature regions, and the coarsening kinetics is also affected by the temperature gradient. Ta et al.[18] studied the effect of temperature gradient on the microstructure evolution in various Ni– Al– Cr bond coat/substrate systems with thermodynamic and atomic mobilities; the phase-field simulation showed that the temperature gradient promotes the diffusions of both Al and Cr, which greatly accelerates the failures of various bond coat/substrate systems.
As concluded in the previous studies, the temperature gradient has great effects on the diffusion and microstructure, it is theoretically important to investigate the effects of temperature gradient on the interdiffusion and interface microstructure of multilayer metal. However, due to the experimental complexity in studying the temperature gradients in multilayer metals with thickness values ranging from nano- to micro-scale, the effects of temperature gradient on the diffusion and microstructure of layer metals are less investigated.
Therefore, this paper focuses on the effects of temperature gradient on the interface microstructure and diffusion through the interface of the diffusion couple, and the mutual interactions of composition difference and initial aging time (IAT) of the alloy in the diffusion couple are discussed with the temperature gradient. The phase-field simulation[11, 12, 15, 16, 18– 22] as a favorable method is adopted to study the interdiffusion and interface microstructure of diffusion couples under the temperature gradient. The linear temperature gradient is applied to the diffusion couples formed by the aged alloys with different initial aging times and different compositions including B-enriched α 1 and A-enriched α phases in the spinodal alloy, and the element diffusion direction and interface microstructure will be investigated under the temperature gradient by the phase-field simulation.
The microstructure evolution in the diffusion couples can be described by the composition field c as a function of position r and time t, and the temporal composition is controlled by the Cahn-Hilliard equation[23]
where M(c) is the chemical mobility, G is the molar Gibbs energy, and κ is the gradient energy coefficient.
The chemical mobility M(c) is given by the Darken equation[24]

where MA and MB are the atomic mobilities of components A and B, respectively. They are related to the diffusivity by the Einstein relation Mi = Di/RT, where i denotes the component A or B of the alloy, R is the gas constant, T is the absolute temperature, Di is the diffusion coefficient, DA is assumed to be small and DB to be large: they are expressed as

and

The molar Gibbs energy is expressed as

where LA, B is a regular solution parameter describing the interactions between components A and B and chosen to be 9.5 kJ· mol− 1.
The linear temperature gradient is introduced into the system with temperature increment Δ T along the horizontal direction, and the temperature T at position xi is given by T = T0 + xiΔ T, where T0 is the initial temperature in the center of the simulation cell, Δ T is the temperature increment per grid length Δ x = 0.1 μ m, the length scale is chosen such that a reasonable temperature gradient distribution and the diffusion interface are ensured.[25] The temperature gradient is activated through the temperature related free energy and the diffusion coefficient in the phase-field simulation.
In order to solve Eq. (1) numerically, the following dimensionless parameters are used: r* = r/l, t* = tD/l2, M* = RTcM(c)/D, κ * = κ /RTcl2, G* = G/RTc, where D = 10− 23 m2· s− 1 is a normalization factor of the diffusion coefficient and l is the length scale, and Tc = 650 K is the critical temperature of phase decomposition of the alloy. Then the kinetic evolution equation Eq. (1) is written as
The dimensionless simulation cell is chosen to be 512Δ x* × 64Δ y* . A thermal fluctuation [− 0.005, 0.005] is added to the initial composition to trigger the phase transformation, and the gradient coefficient is chosen to be κ * = 0.5. Equation (4) is solved by using the semi-implicit Fourier spectrum method[26] with time step Δ t* = 0.02. The lattice mismatch is chosen to be a very small value in the alloy, so the elastic strain is ignored in the present simulation.
The calculation is performed with the periodic boundary condition in a symmetric diffusion couple, where the temperature increases from the centre (T0) to the boundary by Δ T along the horizontal direction in the simulation cell, as signalled by the arrows in Fig. 1. Therefore, we can study one of the diffusion couples with x* = 1 ∼ 256. The diffusion couple is formed by the two alloys aged for time 


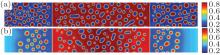
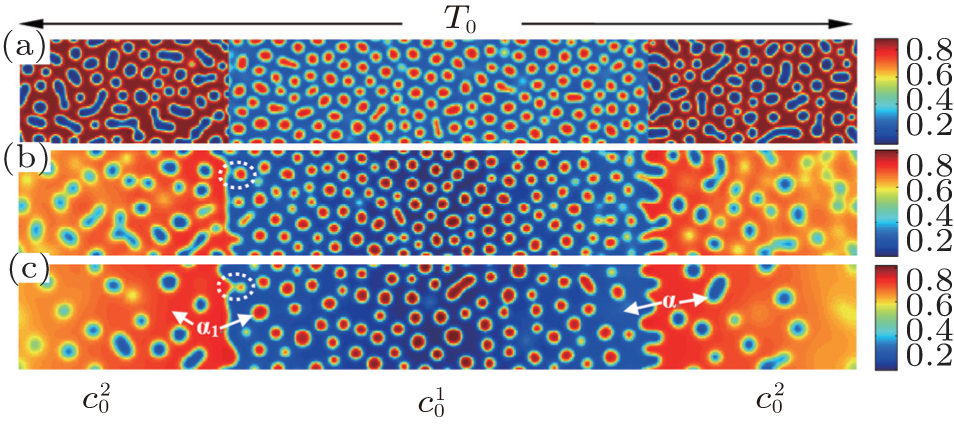 | Fig. 1. Microstructure evolutions of diffusion couples with initial compositions    |
The microstructure evolutions of diffusion couples with initial composition 


Figure 1(a) shows the initial microstructure of the diffusion couple at t* = 0 with the distinct interface. As the annealing progresses, the separated α phases are dissolved at the high temperature regions, as shown in Fig. 1(c). At the same time, the α 1 phase merges into the α 1 matrix and the α phase merges into the α matrix on the opposite side, respectively, as signalled by the dotted circles in Figs. 1(b) and 1(c). The single-phase regions on the two sides of the interface become wider with the dissolving of separated particles near the interface, as shown in Figs. 1(b) and 1(c). In the spinodal alloy, the solute undergoes the uphill diffusion driven by the chemical potential, and the solute B on the side 

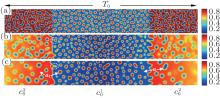
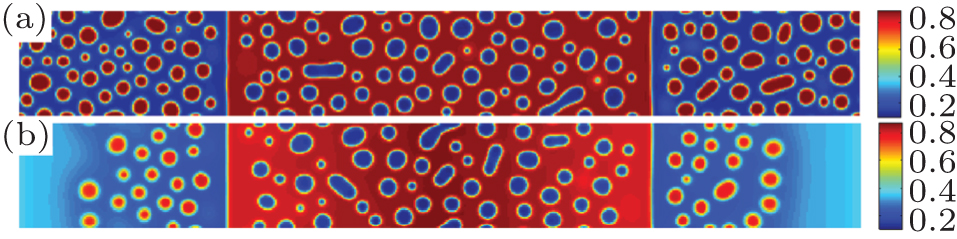
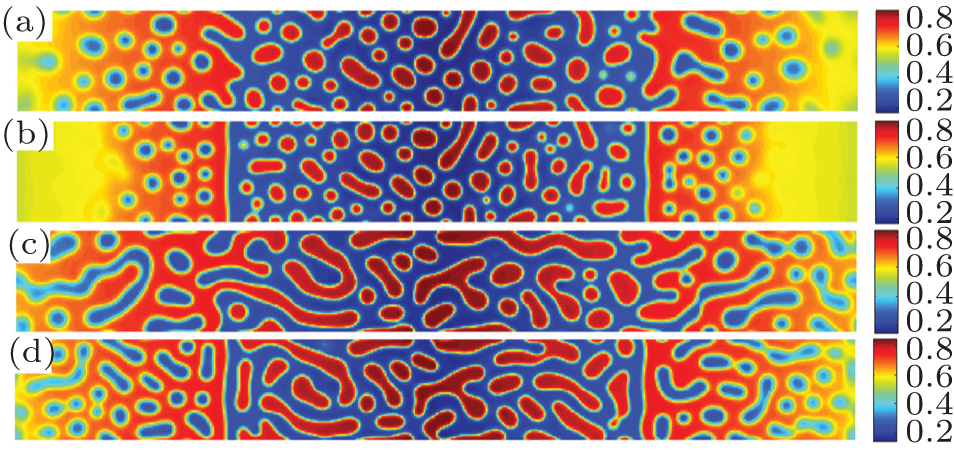
When the temperature gradient is introduced, the element diffusion through the interface will change the microstructure more obviously. The interface microstructures of diffusion couples annealed for t* = 600 with temperature gradients Δ T = 0.0, 0.2, and 0.3 K/μ m are shown in Figs. 2(a)– 2(c), respectively. The initial compositions and aging times of the diffusion couples in Fig. 2 are the same as those of Fig. 1. As the temperature gradient increases, the fast diffusion results in the dissolution of the α 1 phase near the interface on the side 

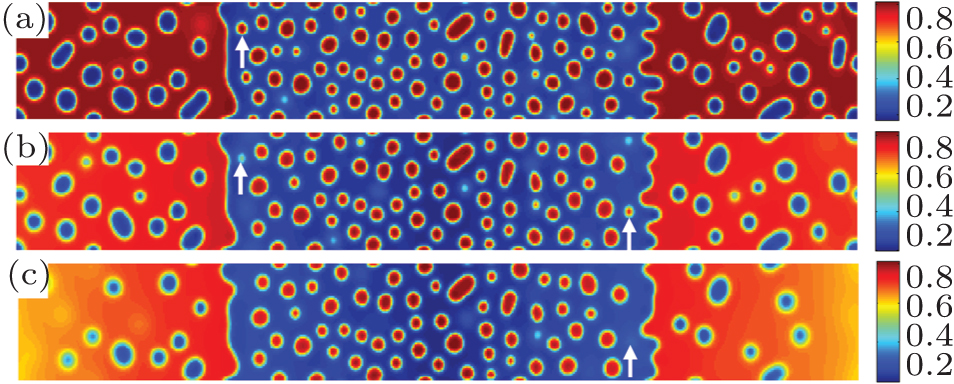 | Fig. 2. Microstructure of diffusion couples for alloys with initial compositions    |
As a phase transformation driven by thermodynamic, the B-enriched α 1 and A-enriched α coexist in the diffusion couples, the element diffusion through the interface and the dissolution of the initial separated phases are both related to the thermodynamic phase equilibrium. Owing to the temperature change continuously in the diffusion couple, the equilibrium composition of the α 1 phase decreases and α increases as temperature increases, it is just like the Soret effect[16] that induces the composition gradient in the diffusion couples, then the kinetic diffusion is affected by the composition gradient. Therefore, the concentrations of elements A and B on two sides of the diffusion couples can be changed by the diffusion, which will be discussed by the quantitative concentration variation in the following section.
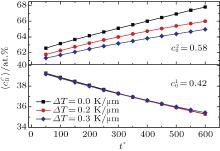
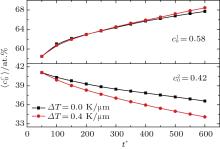
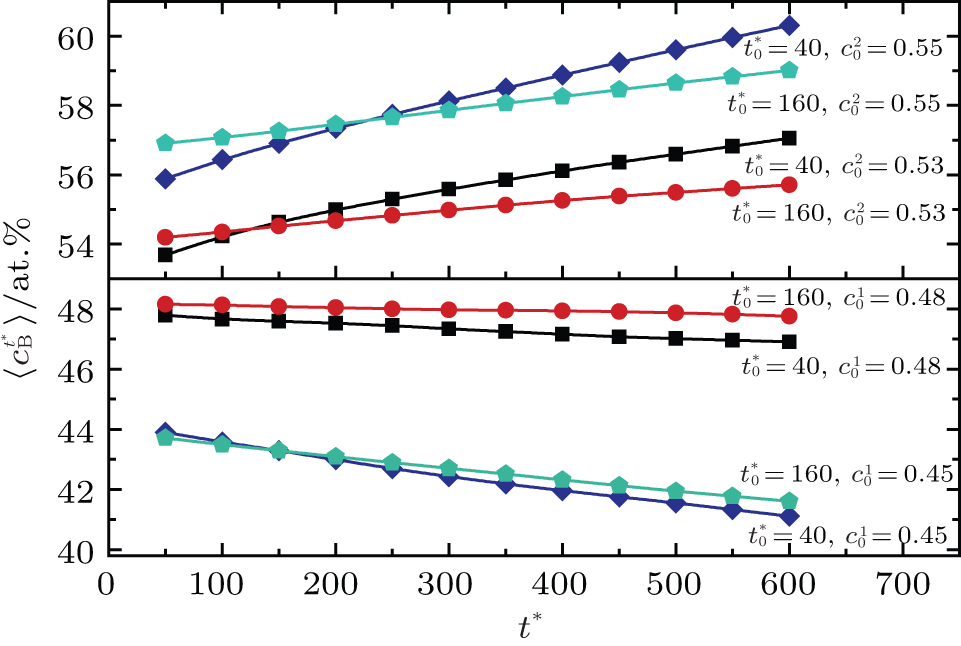
The temporal average compositions 


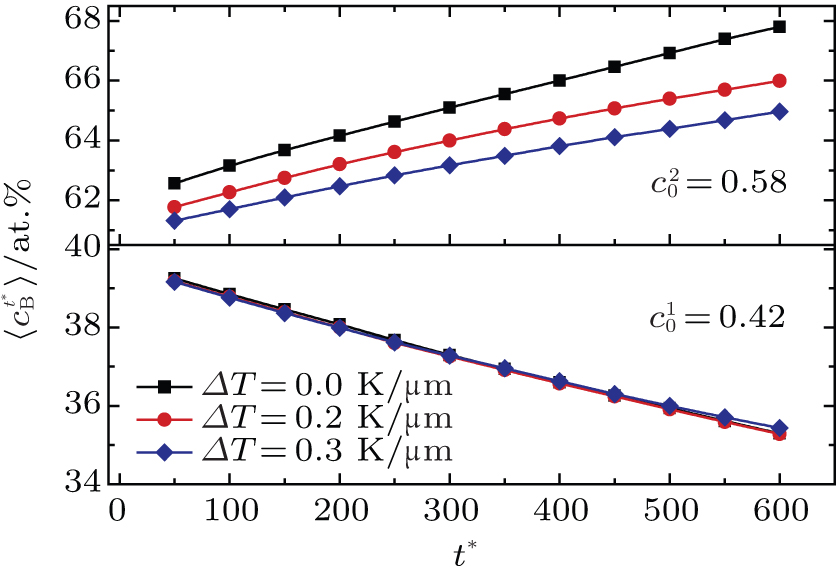 | Fig. 3. Temporal average composition    |
In addition, the values of 


Table 1. Average concentration difference | Δ c| (at.%) on the left side   |
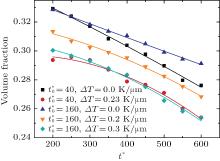
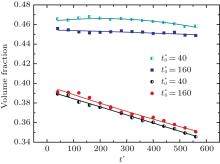
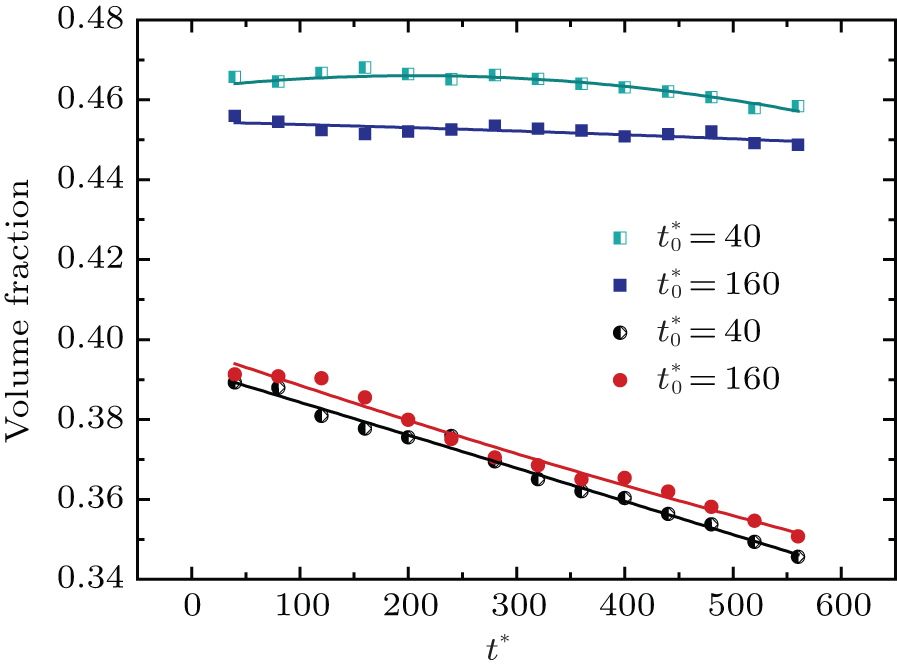
The variations of B-enriched α 1 phase volume fractions in the region 

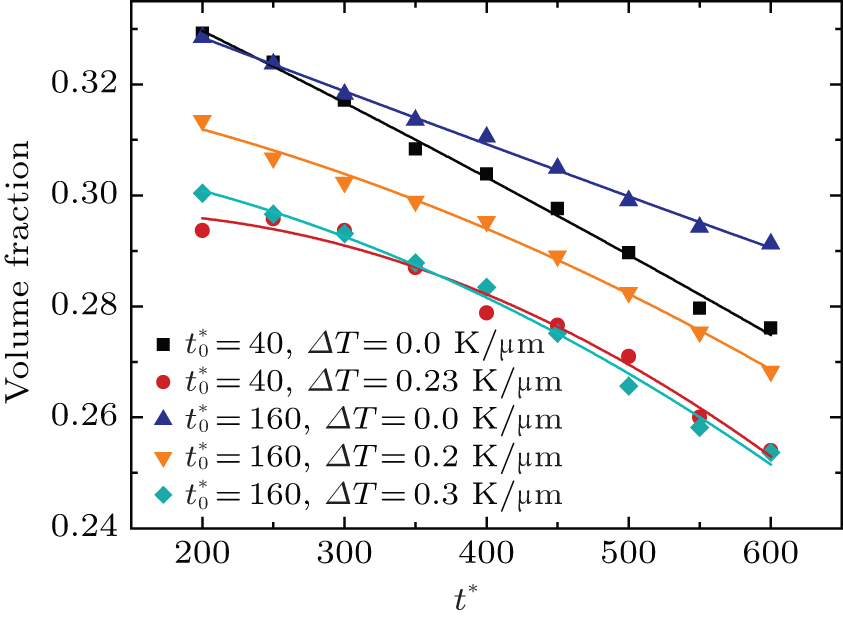 | Fig. 4. Variations of volume fraction with time of B-enriched α 1 phase in the diffusion couples with x* = 129 ∼ 256 and y* = 1 ∼ 64 for different initial aging times and temperature gradients shown in Figs. 2 and 5. |
The reduced volume fraction is caused by two reasons in the temperature gradient diffusion couples. First, the increased temperature reduces the supercooling, i.e., the driving force of the phase separation decreases at high temperature, as a result, the phase separation is retarded or the separated phases are dissolved again by annealing. Second, the decrease of volume fractions is due to the fact that the element B migrates from the low concentration side 

In Fig. 4, the volume fractions for a short IAT 

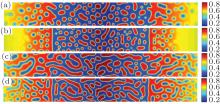
The morphology evolutions for IAT 


 | Fig. 5. Microstructures of diffusion couples for alloys with initial compositions    |
Besides the change of volume fraction with IAT, the straight interface of the diffusion couples is clearly present for the short IAT 
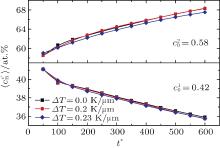
Figure 6 shows the plots of the temporal average composition 


 | Fig. 6. Plots of temporal average composition    |
Figures 7(a) and 7(b) show the diffusion couples with 


 | Fig. 7. Microstructures of diffusion couples for alloys with initial compositions    |
Figure 8 shows the variations of temporal average composition 


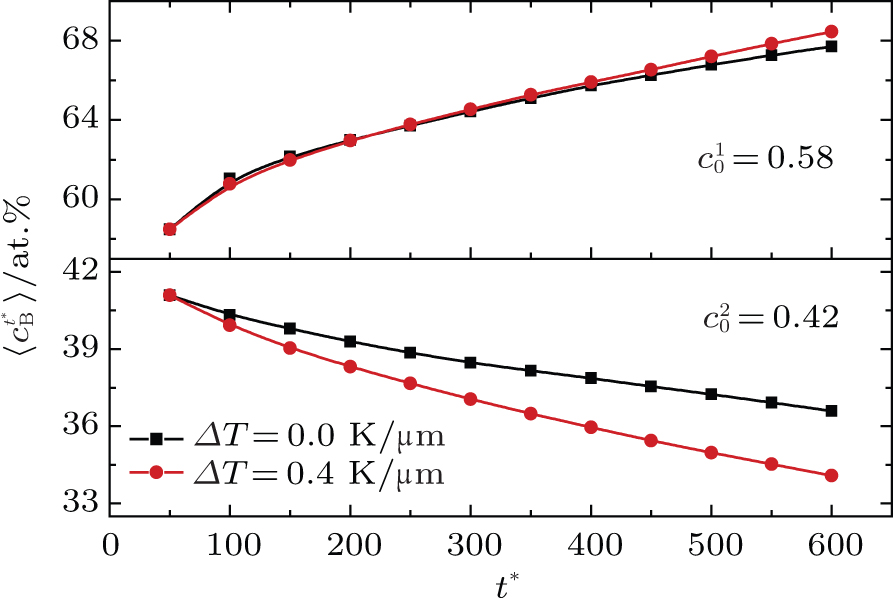 | Fig. 8. Variations of temporal average composition    |
As the initial composition difference 


 | Fig. 9. Microstructures of diffusion couples with initial compositions      |
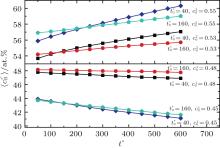
Figure 10 shows the plots of the temporal average composition 


 | Fig. 10. Variations of average composition  |
| Table 2. Average concentration difference | Δ c| (at.%) values on the two sides of the diffusion couples annealed for t* = 600 shown in Fig. 10. |
Figure 11 shows the variations of volume fractions of B-enriched α 1 phase in regions with x* = 129 ∼ 256 and y* = 1 ∼ 64 of Fig. 9. The volume fractions decrease from about 0.39 to 0.35 in the diffusion couple with 


 | Fig. 11. Variations of volume fraction with time of B-enriched α 1 phase in the diffusion couples with x* = 129 ∼ 256 and y* = 1 ∼ 64 of Fig. 9. The lines with a circle and a square represent the diffusion couple with initial compositions     |
The simulation results give an understanding of the interface microstructure and diffusion in the diffusion couple under the effects of temperature gradient, initial composition difference and different initial aging times. As the thermodynamic driving force of phase transformation, the chemical free energy changes with temperature, thus the composition and microstructure will be changed in the temperature gradient system. In addition, the uphill diffusion dominates the diffusion direction through the interface no matter what the direction of the temperature gradient is. Therefore, the interface diffusion and microstructure in the spinodal alloy system show some differences from heat transport and mobility controlled diffusion, [16] which is of theoretical significance for understanding the interface diffusion in the diffusion couple formed by spinodal alloy.
The effects of temperature gradient on the diffusion and interface microstructure of diffusion couple are studied in the binary spinodal alloy. The mobility as a function of temperature and temporal composition is incorporated into the Cahn-Hilliard equation. The thermodynamic and dynamic parameters are adopted to simulate the phase transformation. By calculating the time-dependent composition of the element and the volume fraction of the separated phase in the diffusion couple, the diffusion direction of the element through the interface is clarified under the temperature gradient. The evolution of the interface microstructure is displayed by the simulated morphology. At the same time, the effects of the initial aging time and the composition difference of the alloy on the diffusion and microstructure are also studied with the temperature gradient.
The simulation results show that the interface microstructure, straight interface with single-phase or interconnected interface, are affected mainly by the initial aging time of the alloy under the temperature gradient, the element diffusion through the interface depends on the initial composition difference between two sides of the diffusion couple. The widths of single-phase regions on both sides of the interface are enlarged as the temperature gradient increases, and the straight interface with a single-phase is present for the short initial aging time under the temperature gradient. The solute element diffuses from the low concentration to high concentration through the interface of the diffusion couple formed by the spinodal alloy, no matter whether the diffusion direction is up or down to the temperature gradient.
| 1 |
|
| 2 |
|
| 3 |
|
| 4 |
|
| 5 |
|
| 6 |
|
| 7 |
|
| 8 |
|
| 9 |
|
| 10 |
|
| 11 |
|
| 12 |
|
| 13 |
|
| 14 |
|
| 15 |
|
| 16 |
|
| 17 |
|
| 18 |
|
| 19 |
|
| 20 |
|
| 21 |
|
| 22 |
|
| 23 |
|
| 24 |
|
| 25 |
|
| 26 |
|