


A two-dimensional model of He/O2 atmospheric pressure plasma needle discharge
[Qian Mu-Yang†a)  , Yang Cong-Ying
a) , Chen Xiao-Changa) , Liu San-Qiua) , Yan Wenb) , Liu Fu-Chengc) , Wang De-Zhenb) ]
, Yang Cong-Ying
 |

 , Yang Cong-Ying
†Corresponding author. E-mail: qianmuyang@ncu.edu.cn
*Project supported by the National Natural Science Foundation of China (Grant No. 11465013), the International Science and Technology Cooperation Program of China (Grant No. 2015DFA61800), and the Natural Science Foundation of Jiangxi Province, China (Grant No. 20151BAB212012).
In this paper, a computational modeling study of stream propagation in the atmospheric-pressure helium plasma in ambient atmosphere (oxygen) is presented. A coupled fluid model between time-dependent plasma dynamics and steady state neutral gas flow is employed to provide a fundamental insight into the evolution of the streamers. The obtained simulation results showing that the sheath forms near the dielectric surface and shields the axial stream propagation. The stream front propagates with axial velocity in a range of 104 m/s–105 m/s. And, the increasing accumulated surface charge should be responsible for reducing the propagation velocity of the streamer front in the axial direction. Besides, when the gas flow rate is 1.1 standard liter per minute (SLM), we find that the concentration of oxygen drastically increases at a larger radial position near a treated surface. Therefore, Penning ionization by helium metastables and oxygen peaks at an off-axis position, corresponding to the ring-shaped emission profile in cylindrical coordinates. In this case, the simulated results show the ring-shaped ground atomic oxygen density profile near the treated surface ( z = 0.5 mm) at a large gas flow rate of 1.1 SLM, which is consistent with the observation in a similar experiment.
Non-thermal atmospheric pressure plasmas have recently received significant attention and have shown considerable promise in a wide range of practical applications such as biomedicine, nano-materials processing, and bacteria disinfection.[1– 4] A number of different types of non-thermal atmospheric pressure plasma devices have been designed. Among them, the plasma needle is one of the most commonly applied plasma generators to produce homogenous microplasmas at the tip of the needle (on the order of few millimeters in diameter).[5] Helium is typically used as a source gas and fed through a dielectric tube with a velocity (about 10 m/s) into ambient air. The plasma is characterized by a fluid mechanical mixing layer where the source gas and air inter-diffuse. As the high-voltage sinusoidal or pulsed waveforms are applied to a needle-shaped electrode located inside a concentric gas-flow nozzle, the plasma discharge is localized to a region on the order of hundreds of micrometers to millimeters. When the plasma needle is applied to a surface, the jet of helium flow passes through the needle and impacts the surface in an open environment. Therefore, neutral gas flow should have an influence on the plasma needle discharge dynamics. We focus on the plasma needle discharge at atmospheric pressure.
Recently, the plasma needle has been studied for cell detachment, apoptosis in mammalian cells, and bacteria inactivation.[6, 7] Goree et al.[8, 9] reported that the killing pattern of Streptococcus mutans bacteria varied from a circle to an annular ring as the feed gas flow rate is increased, depending on the input power. Therefore, several other researchers have addressed the influences of neutral gas flow on non-thermal atmospheric pressure plasma and try to explain the ring-shaped emission patter and associated bacteria killing pattern observed by Goree et al. Sakiyama and Graves[10] demonstrated that the “ ion wind” and gas heating have only minor effects on He/N2 atmospheric pressure plasma needle discharge, and ambient N2 diffusion against the convective helium flow should be responsible for the unique ring-shaped light emission. As is well known, atomic oxygen is antibacterial.[11] Therefore, they reported the gas flow dependence of ground state atomic oxygen near the treated surface by using two-photo absorption laser-induced fluorescence (TALIF) spectroscopy, and the results indicated that the bacteria killing ring-shaped pattern was due to the ground state atomic oxygen.[12] In more detail, a circular density distribution was observed at 0.5 SLM, whereas the profile turned to a ring at 1.0 SLM. Besides, Yan et al.[13] investigated the effect of the needle electrode on the plasma jet characteristics, and the simulation results indicate that the needle electrode has an evident influence on the plasma jet characteristics.
Several issues that still need to be addressed include the investigation of the underlying physical mechanisms that dominate the unique ring-shaped bacteria killing pattern and the two distinct ground atomic oxygen profiles depending on the gas flow rate. Our primary concern in this paper is therefore to model He/O2 atmospheric pressure plasma needle discharge and try to reproduce the ring-shaped ground state atomic oxygen density profile near the treated surface. The first step of the study is to establish a two-dimensional self-consistent fluid model, in which electrohydrodynamic force, plasma joule heating and photo-ionization mechanism are not considered, and background pre-ionization is assumed instead. The initial electron and ion densities in the gas are considered to be 107 cm− 3 and uniformly distributed. Only a single streamer is studied in our case, which is valid when the frequency of the voltage pulse is sufficiently low. Otherwise, the accumulation of active species takes place and the Penning effect (i.e. long-lifetime helium metastables) arising from preceding discharges cannot be neglected.[14, 15] Besides, the ‘ air’ in the current model is assumed to be pure O2, partly due to computational limitations. The streamer characteristic parameters and cathode sheath are also studied.
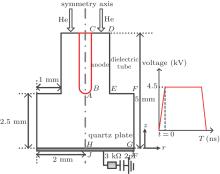
Our model consists of a coupled set of models: a neutral gas fluid model and a plasma dynamics model in two-dimensional cylindrical coordinates. More specially, steady state equations are solved for neutral gas flow, whereas we solve time-dependent equations for plasma discharge. The schematic diagram of the needle discharge with a treated surface is shown in Fig. 1. The needle is indicated by the points A, B, and C in Fig. 1, its tip is shaped as a semi-sphere with a radius 0.2 mm, and its total length is 2.5 mm. The needle is concentric with an insulator indicated by points D, E, and F, which has a radius of 1 mm. The dielectric constant of the insulator is 5ε 0 where ε 0 is the vacuum permittivity. The edges of the insulator tube are rounded with a curvature radius of 50 μ m (point E in Fig. 1). The needle tip is flush with the end of the tube. A treated surface is simplified into a planar quartz plate (marked by points G, H, I, and J in Fig. 1). The gap distance between the needle tip and the treated surface is 2.5 mm. The thickness of the quartz plate is 0.2 mm with relative permittivity 5 unless otherwise stated. The electrical potential is zero at the backside of the quartz plate (indicated by points I and J in Fig. 1), where a grounded metal plate is assumed to be attached. A 4.5-kV positive voltage is applied to the needle tip as can be seen in Fig. 1. Besides, an external RC (R = 3 kΩ , C = 2 pF) network is added to the plasma discharge circuit, which is used to prevent the discharge from arcing. The voltage is assumed to be a square wave ‘ pulse’ , i.e., the peak voltage is applied instantaneously at the beginning of the simulation and remains constant for the simulation duration (t = 0 point indicates the beginning of the simulation). The source gas consists of He with O2 as an impurity at a mole fraction of 0.005 and flows into the domain from the boundary between the needle and the insulate tube (as indicated by points C and D in Fig. 1). The gas flow rate considered in the simulation is 1.1 SLM.
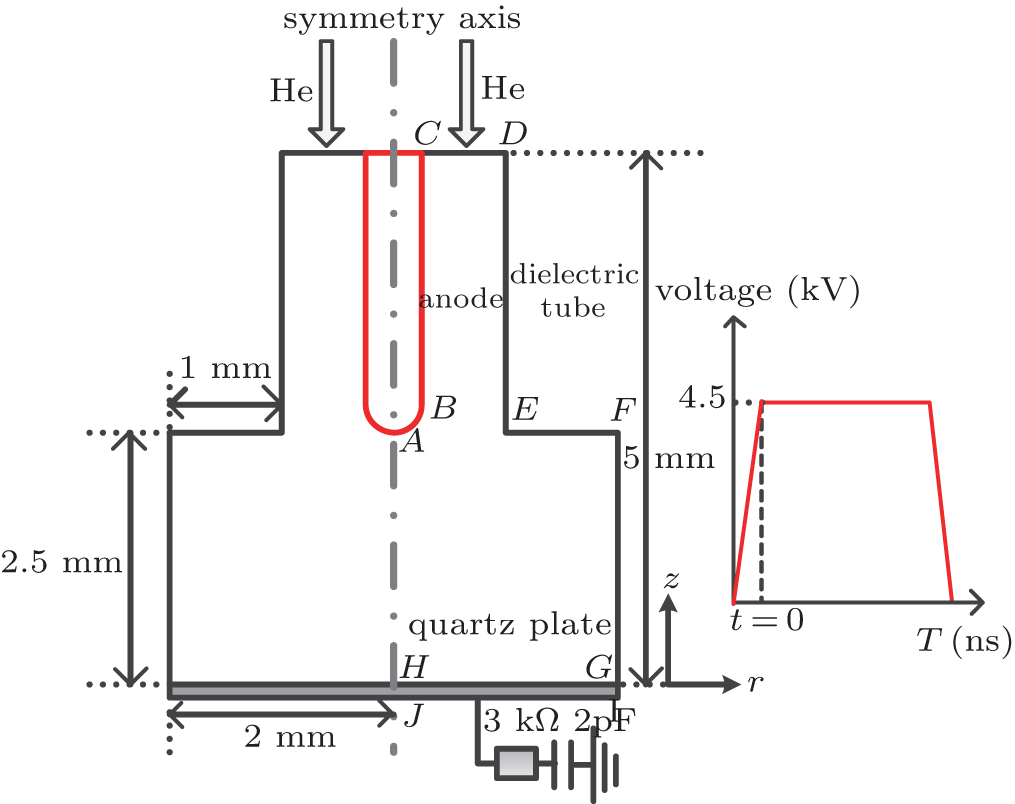 | Fig. 1. Side view schematic diagram of the discharge setup and the simulation domain. |
The governing equations for the neutral gas model consist of the total mass continuity equation, Navier– Stokes equation, and the mass continuity equation for O2 and the ideal gas law as follows:


where u is the mass-averaged velocity vector, ρ is the total density, p is the pressure, τ is the stress tensor of Newtonian fluid, F is the body force field (buoyancy), ω O is the mass fraction of dry oxygen, Dg is the binary diffusion coefficient, and Tg is the gas temperature 300 K. Subscript i in Eq. (4) represents the species of gases (i.e., He and O2). The density in Eq. (4) is calculated from mass fraction by ni = ρ ω i/mi, where mi is the mass of species i. The source gas flow rate considered in the simulation is 1.1 SLM. The pressure at the exit is fixed to be 1 atm (1 atm= 1.01325× 10⁵ Pa) and the gas temperature is 300 K. The boundary conditions are summarized in Table 1.
| Table 1. Boundary conditions for the neutral gas model. The symbols (A– J) correspond to the vertexes in Fig. 1. ur and uz are r and z components of the velocity field, respectively. n is the normal vector to the boundary. |
The plasma dynamics model is based on the classical fluid model, which is governed by the continuity equations in the drift-diffusion approximation, the electron energy conservation, and Poisson’ s equation, which are given as follows:


where subscript i, e, and He indicate the i-th species, electrons, and helium gas, respectively, Γ is the flux in the drift-diffusion approximation, Ri j is the j-th reaction rate shown in Table 3, q is the charge, μ is the mobility, E is the electric field, ϕ is the potential and ε is the mean electron energy, Δ E and Kinel are the energy loss to inelastic collisions and the corresponding reaction rate, respectively, and ε 0 is the vacuum permittivity.
The boundary conditions for the particle flux at the needle, the insulator, and the treated surface are given as follows:


where e, i, m, and ε denote the electron, ion, metastable, and electron energy, respectively; Ti and Tg are the ion and background gas temperature (Ti = Tg = 300 K in this paper); n is the normal vector pointing toward the surface; γ is the second electron emission probability. The secondary electron coefficient is 0.05 in this model. The surface charge accumulation is considered on the dielectric surface. α s and 

where D1 and D2 are the electric displacement on the two sides of the dielectric surface, Ji · n and Je · n are the normal component of the total ion current density and total electron current density on the cathode surface, respectively, σ s is the net surface charge accumulated on the dielectric surface. The boundary conditions are summarized in Table 2.
| Table 2. Boundary conditions for the plasma dynamics model. The symbols (A– J) correspond to the vertexes in Fig. 1. Subscripts e, i, and m denote the electron, ions, and metastables, respectively. |
The plasma chemistry considered in this model consists of 13 species and 37 reactions shown in Table 3. The species considered in this model are e, He, He+ , 


| Table 3. Helium– oxygen chemistry reactions used in this study. |
All governing equations are solved by COMSOL with the finite element method. First, we solve Eqs. (1)– (4) in order to obtain a steady state fluid flow field of the neutral gas. Then the flow field results are coupled to the time-dependent solver, which is used to solve the plasma dynamic equations (5)– (8). The free triangle mesh method is used to discretize the governing equations. Close to the needle tip and the treated surface, the minimum mesh size is 1 μ m. The mesh resolution must be high enough to describe the complicated chemical reactions in the sheath. The complete mesh consists of 167847 cells, and the total number of degrees of freedom is about 1.27× 10⁶.
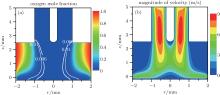
Figures 2(a) and 2(b) show the profiles of oxygen mole fraction and magnitude of velocity, respectively. The source gas flows downward along the channel between the needle and the insulator tube from the inlet (z = 5 mm) to the treated surface (z = 0 mm). According to previous study, [10] the needle plasma discharge is restricted to the domain (r < 2 mm). Thus, in our work, we take radial length r = 2 mm. As is well known, the gas concentration profile is mostly determined by a balance between the convective flow of the source gas and backdiffusion of ambient air (oxygen) from the surroundings, besides being in the vicinity of the needle tip. In our work, the source gas flow rate is 1.1 SLM, which is equal to a mean inlet velocity of about 6 m/s. As can be seen in Fig. 2, the needle tip is almost entirely surrounded by the source gas, which is due to the fact that the convective flow is dominant against backdiffusion of O2 at a smaller radial domain. Besides, the fluid velocity becomes mostly radial near the stagnation point at the plate surface. However, a considerable increase in O2 concentration is observed at larger radial positions since the gas velocity decreases with radius. In other words, the backdiffusion against the convective transport is more prominent at a larger radial position, which coincides with the result reported by Sakiyama and Graves, [10] and Sakiyama.[12]
 | Fig. 2. (a) Mole fraction of oxygen and (b) magnitude of velocity distribution. |
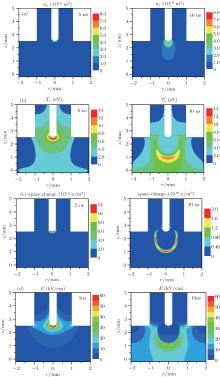
The evolutions of typical plasma characteristic parameters (electron density, electron temperature, space charge density, and electric field profile) are shown in Fig. 3. For a given applied voltage (4.5 kV), the needle plasma discharge occurs near the needle tip. In the first 5 ns, the discharge takes place at the near needle tip position, which is due to the strong electric field produced by the small radius of curvature (0.2 mm). From 3 ns to 14 ns, the streamer propagates along the axial and toward the treated surface under the external and self-generated electric field. As shown in Fig. 3(a), the discharge region expands simultaneously toward radial and axial directions, which was not observed in our previous model with the uniform He concentration profile.[19] The peak electron temperature mainly concentrates on the head of the streamer as shown in Fig. 3(b). As a given positive pulse is applied, the positive space charges with a density of 1018 e/m3 are concentrated at the head and the radial boundaries of the streamer as shown in Fig. 3(c). As can be seen in Figs. 3(c) and 3(d), the larger space charges in the stream front create an enhanced electric field, causing an electron avalanch, resulting in the propagating ionization wave. Thus, the peaks of electric field and electron impact ionization rate are located on the head of the streamer.
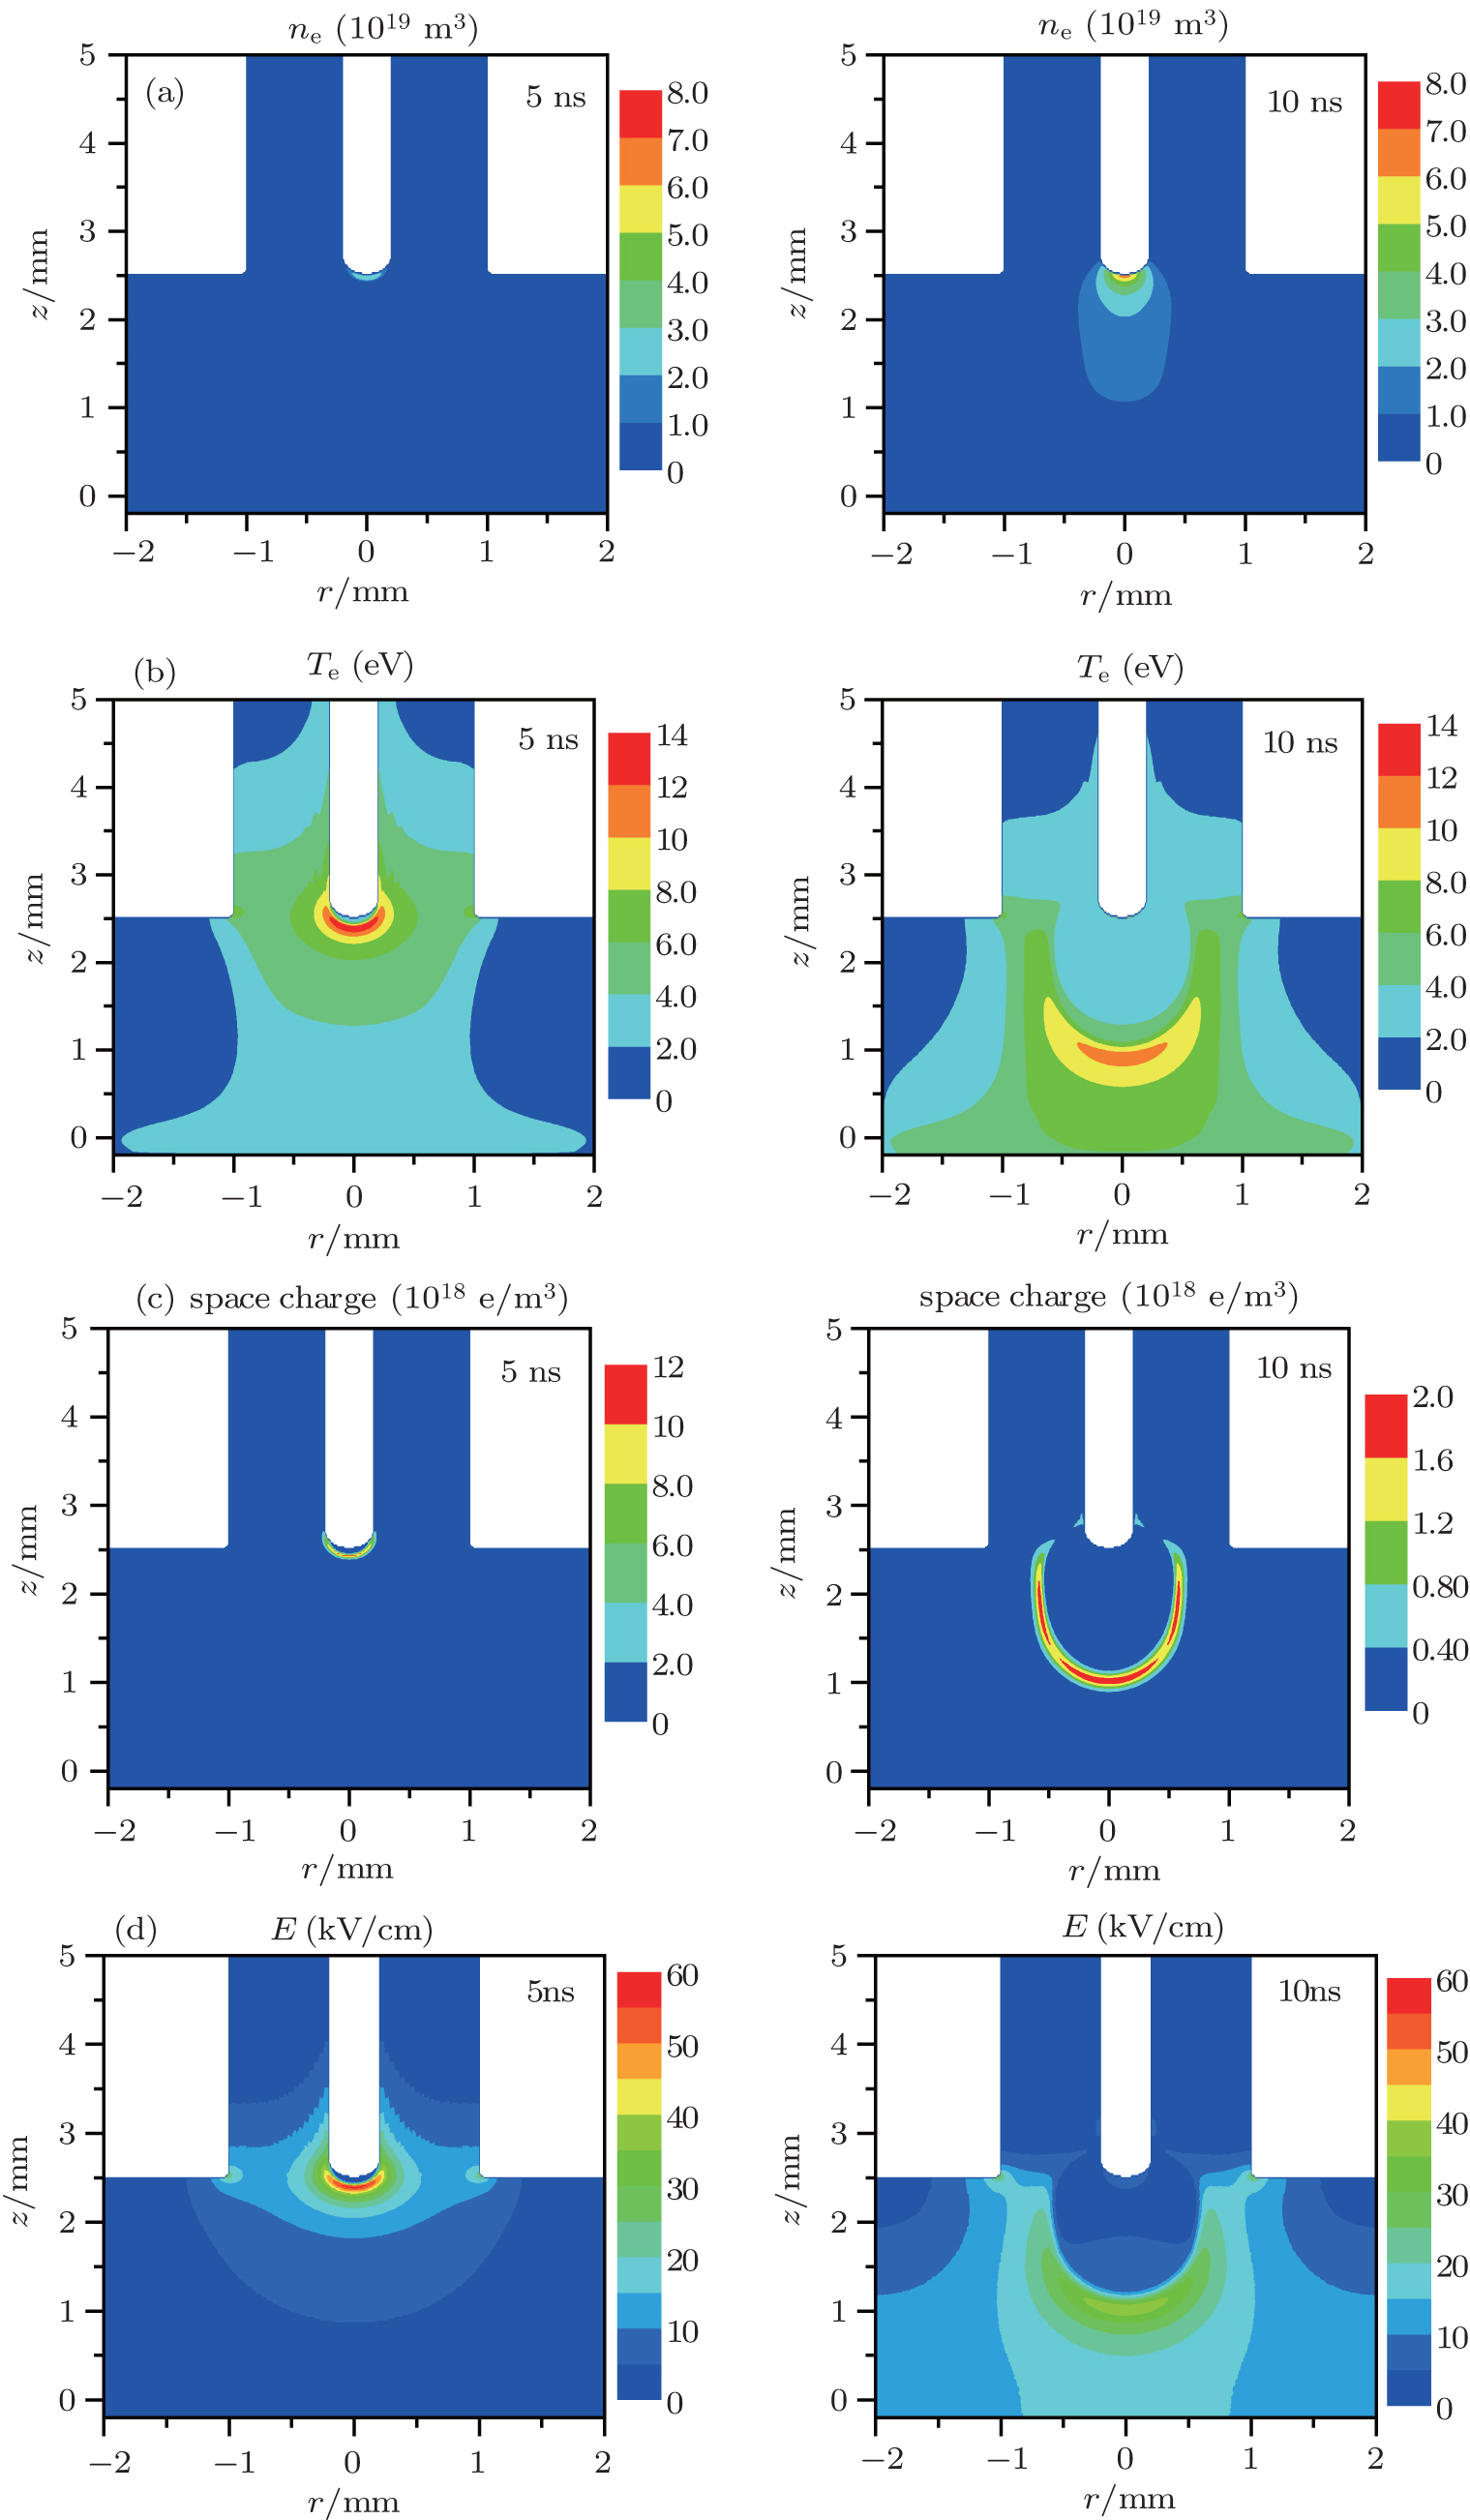 | Fig. 3. Typical streamer propagations at 5, 10 ns after the start of the 4.5 kV pulse. (a) Electron density, (b) electron temperature, (c) positive space charge density, and (d) electric field. |
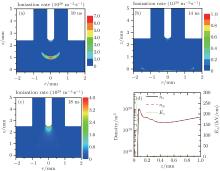
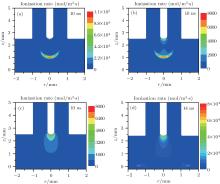
The ionization rate is used to predict the streamer propagation.[17, 20] Therefore, figure 4 shows the total ionization rates (including ionizations of He and O2) at 10 ns, 14 ns, and 18 ns, respectively. As can be seen in Fig. 4(b), the streamer front reaches the treated surface, and a cathode sheath is thus formed in the vicinity of the surface. In the first 14 ns, the total ionization rate is mostly concentrated in the streamer head with less ionization distributed near the needle tip. Besides, it is clearly seen in Figs. 4(a) and 4(b) that the peak ionization is located at the axis in the streamer head in our case. It is interesting to notice that a significant increase in ionization rate is observed at a larger radial position (r = 1.6 mm), which is due to the fact that backdiffusion against the convective transport is more prominent at larger radial positions. From 13 ns to 15 ns, due to the secondary electron emission process which can provide seed electrons ahead of the streamer front, the streamer front moves towards the cathode again. After that, the streamer front spreads along the dielectric surface as shown in Fig. 4(c). In other words, the dielectric coated ground electrode is found to terminate the streamer with a spread-out plasma root, which is similar to the experimental result.[21] Figure 4(d) shows the profiles of axial electron and positive ion densities, and the electric field in the vicinity of the sheath, which presents the typical cathode sheath structure at 14 ns. As can be seen, the sheath thickness is about 0.05 mm, and the peak z component of electric field reaches 265 kV/cm on the cathode.
 | Fig. 4. Total ionization rates (including R3– R5, R28, R36, and R37) of needle plasma at (a) 10 ns, (b) 14 ns, (c) 18 ns, and (d) the axial profiles of electron and positive ion densities, and the electric fields in the vicinity of the sheath at 14 ns. |
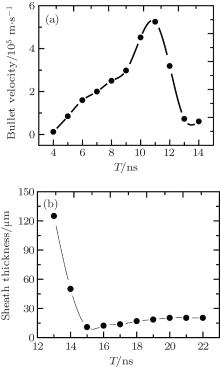
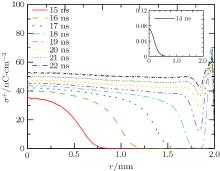
The axial velocity of the streamer front as a function of time in the first 14 ns is shown in Fig. 5(a). It can be seen that the streamer front will start to be accelerated as soon as it is launched from the needle tip. At 11 ns, it reaches its maximum velocity 5.25× 10⁵ m/s and then drops rapidly. These are similar to experimental observations.[22, 23] As discussed in Fig. 4(d), a cathode sheath is formed in the vicinity of the treated surface, which is responsible for the deceleration of streamer propagation. Figure 5(b) shows the temporal variations of cathode sheath thickness at r = 0 mm radial position. From 13 ns to 15 ns, it is clearly observed that due to the secondary electron emission process, the sheath thickness is reduced to a minimum of 0.01 mm. Then, the sheath thickness has a slight increase before stabilizing at 0.02 nm. In order to address why the streamer front terminates at the treated surface with a spread-out plasma root, figure 6 shows the temporal evolutions of the radial distributions of surface charge density on the treated surface. As can be seen from 14 ns to 17 ns, the positive surface charge density peaks appear on the symmetric axis and gradually decrease away from the axis, and its peak value increases from 0.07 nC/cm2 to 42 nC/cm2. From 18 ns to 22 ns, the positive surface charge density increases further and distributes along the entire dielectric surface. As is well known, the higher the surface charge density accumulated on the dielectric surface is, the stronger the feedback electric field is, which in turn offsets the external electric field and weakens the total electric field at the streamer head. According to Figs. 5 and 6, we can conclude that the increasing accumulated surface charge contributes to reducing the propagation velocity of the streamer front in the axial direction.
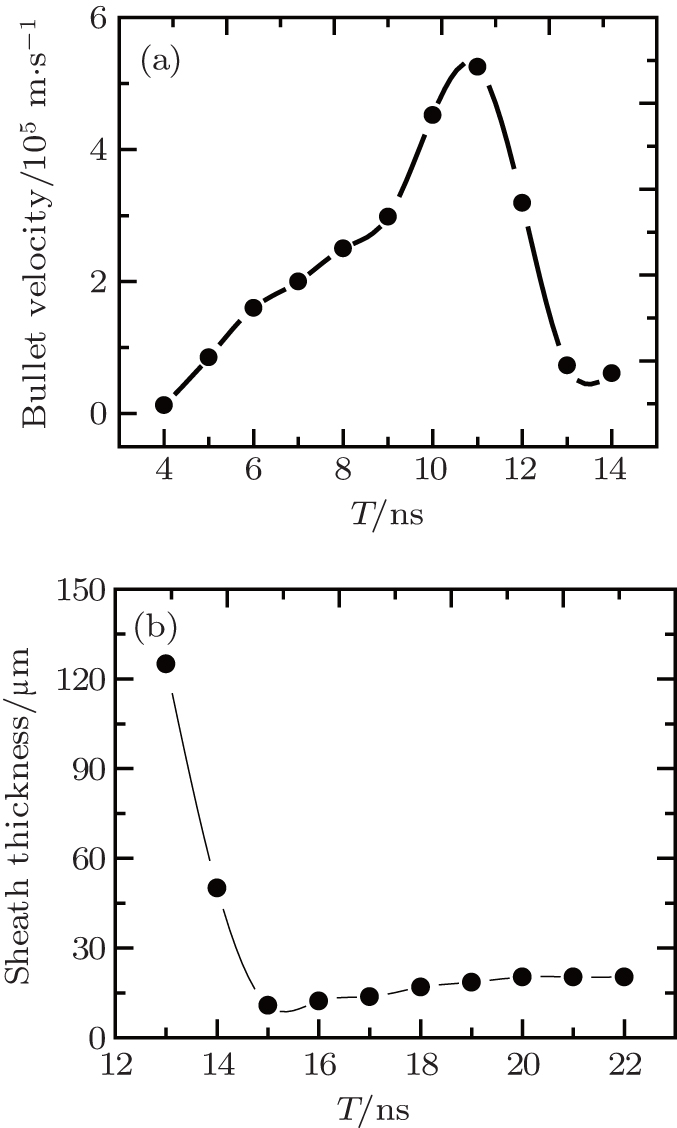 | Fig. 5. (a) Axial velocity of the streamer front as a function of time in the first 14 ns, (b) temporal variation of cathode sheath thickness at r = 0 mm radial position. |
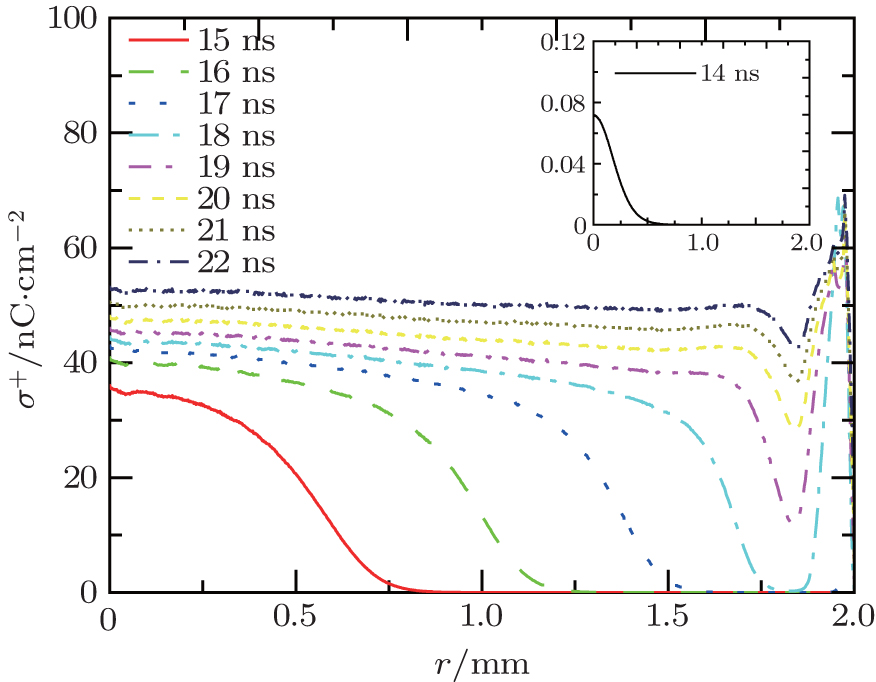 | Fig. 6. Temporal evolutions of the radial distribution of surface charge density on the treated surface. |
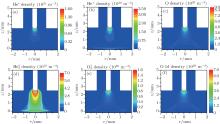
Although the plasma channel is electrically neutral, it is meaningful to analyze the density distributions of different active particles. For the helium species, the peak density of He* is over 1021 m– 3 and mainly concentrates near the needle tip. Since He* is quickly converted into 

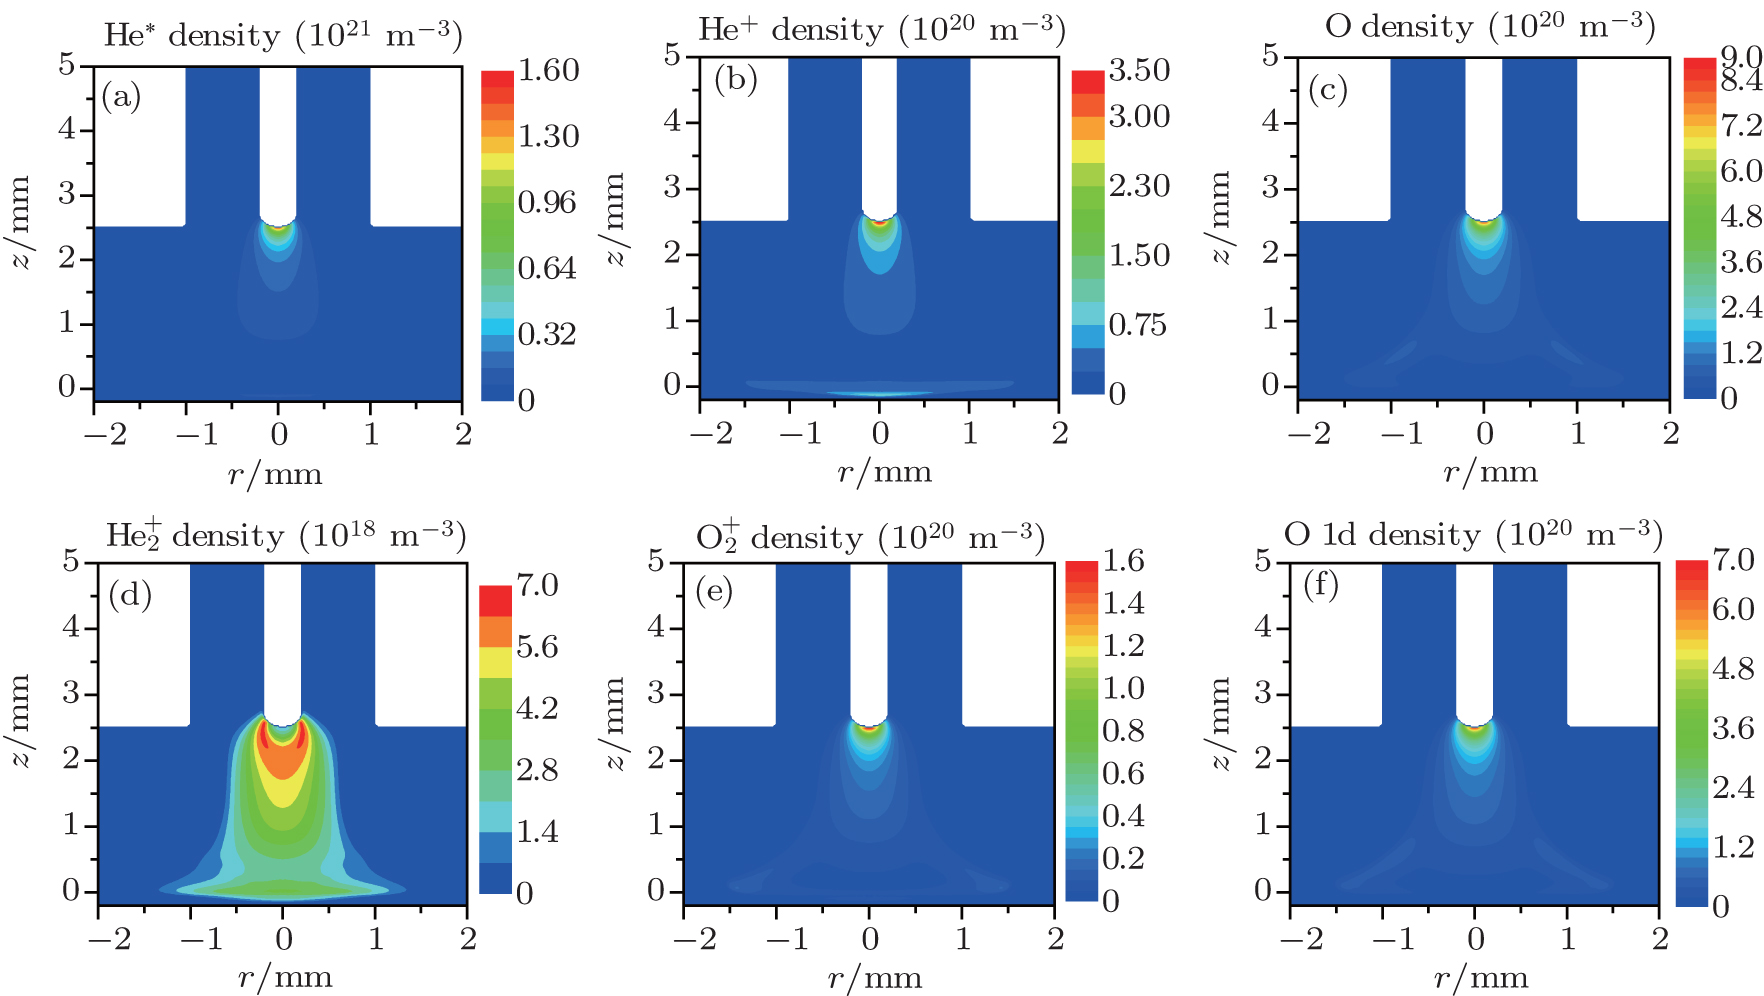 | Fig. 7. Density profiles of needle plasma species at 14 ns. |
In order to understand the different distributions of positive ions, we examine the role of reactions in streamer propagation. Figure 8 shows the profile of ionization reactions of each species. The electron impact ionizations of He and He* concentrate in the streamer head as shown in Fig. 8(a) (R3, R4, and R5), and the peak ionization rate occurs on axis and gradually decreases away from the axis. Their ionization rate is much higher than those of the other cases, thus, He+ dominates in the ion species in the streamer head. Furthermore, the peak electron ionization rate of O2 (R28) is only about 6.8% of that of He (Figs. 8(a) and 8(b)). On the other hand, figure 8(c) suggests that the Penning ionization rates of O2 by He* and
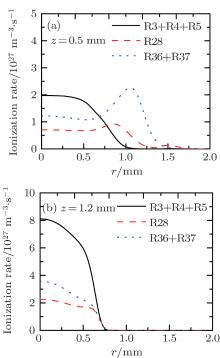
Again, ambient oxygen backdiffusion against the source gas convection is responsible for this interesting emission profile. Figures 9(a) and 9(b) show the contributions of three different reaction mechanisms to the total emission rate at z = 0.5 mm and z = 1.2 mm respectively as a function of the radial position. The plot clearly shows that the Penning ionization is a dominant reaction, having a peak at r = 1.1 mm. However, as shown in Fig. 9(b), the peak values of three different reaction rates are located on the axis and gradually decrease away from the axis. Figure 10(d) further supports our hypothesis. As can be seen, the densities of He* and
 | Fig. 8. Ionization reaction rate (mol/m3· s) distributions of three different reaction mechanisms. (a) Helium related (R3, R4, and R5), (b) ionization of O2 by electron (R28), and Penning ionization of O2 by helium metastables (R36, R37). |
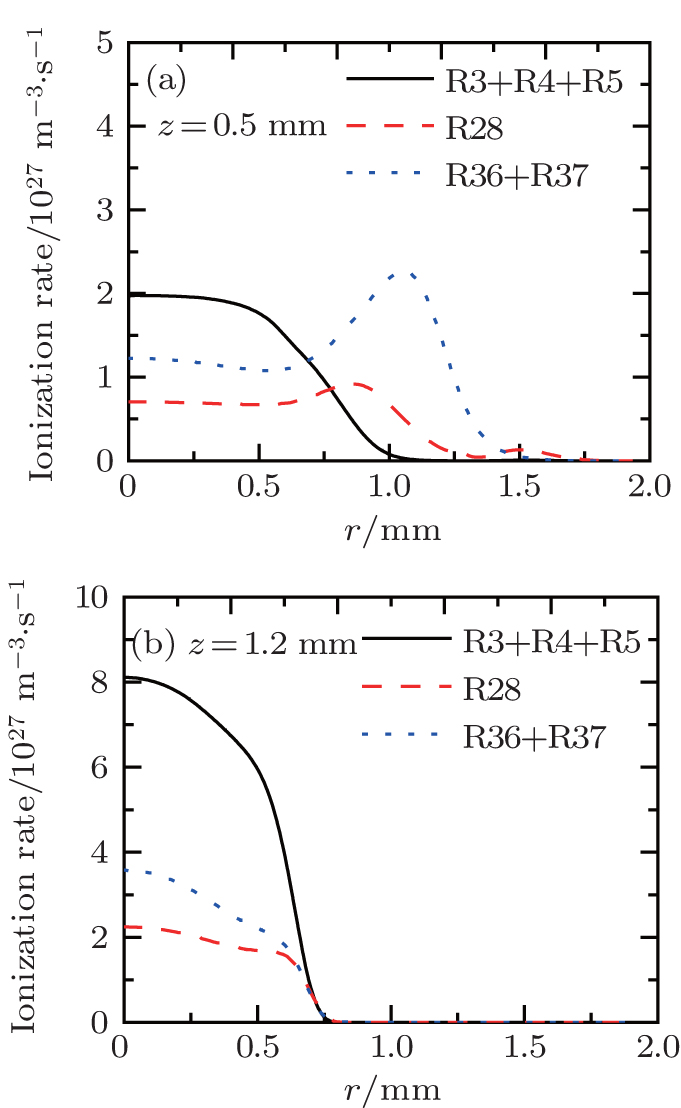 | Fig. 9. Radial profiles of three different reaction rates at (a) z = 0.5 mm, and (b) z = 1.2 mm. |
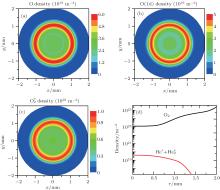
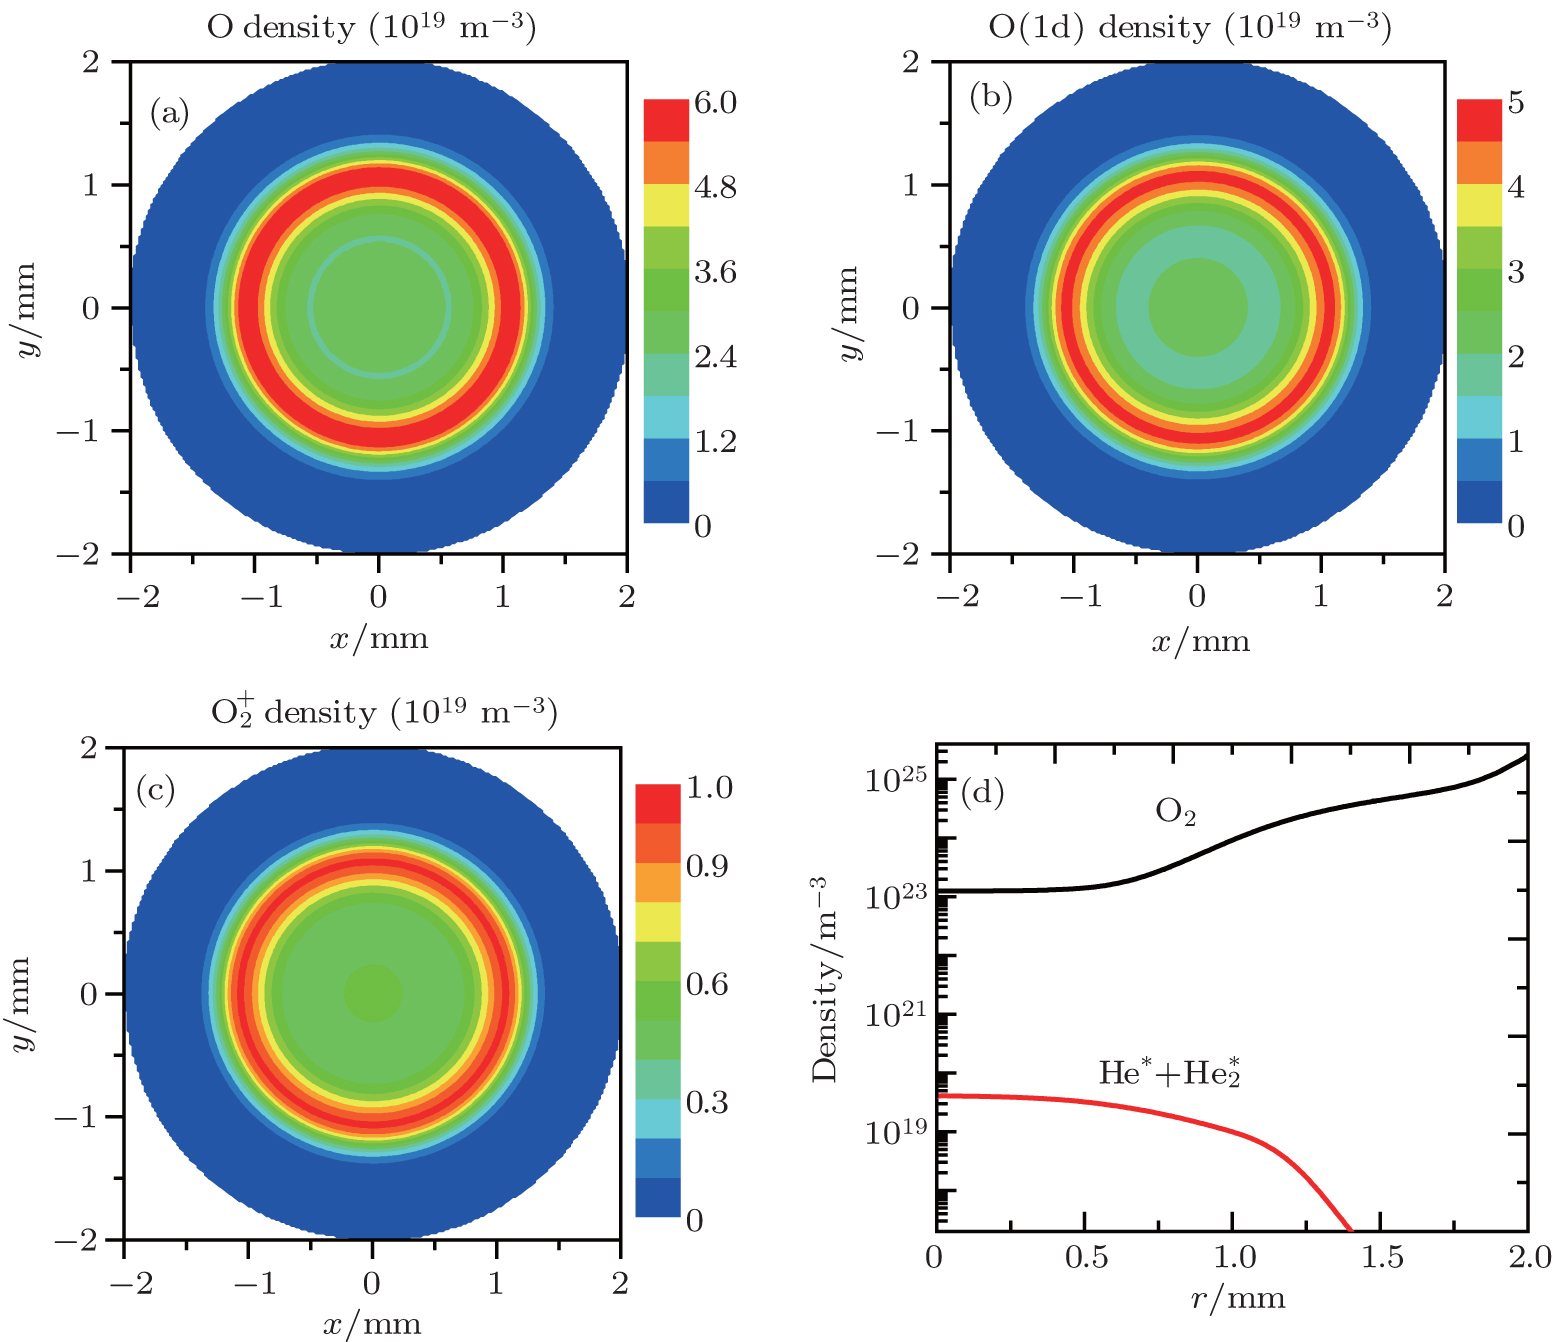 | Fig. 10. Density distributions of (a) O, (b) O (1d), and (c) |
As discussed above, Goree et al.[8, 9] reported that the killing pattern of Streptococcus mutans bacteria varied from a circle to an annular ring, depending on the input power, as the feed gas flow rate is increased. Furthermore, Sakiyama et al.[12] used the TALIF spectroscopy to measure ground atomic oxygen density near a treated surface in needle plasma at atmospheric pressure. According to their experimental results, a circular density distribution was observed at 0.5 SLM, whereas the profile turned into a ring at 1.0 SLM. In this case, we plot the density profiles of O, O (1d), and
Simulated results of a two-dimensional model coupling neutral gas and plasma dynamics for He/O2 atmospheric pressure plasma needle discharge are presented in this paper. As a first step of study, only the effect of O2 in ambient gas is taken into account in this model. The ambient O2 diffusion from the surroundings is responsible for a peak in the Penning ionization rate at a point off the radial axial, where the radially decreasing He* and
| 1 |
|
| 2 |
|
| 3 |
|
| 4 |
|
| 5 |
|
| 6 |
|
| 7 |
|
| 8 |
|
| 9 |
|
| 10 |
|
| 11 |
|
| 12 |
|
| 13 |
|
| 14 |
|
| 15 |
|
| 16 |
|
| 17 |
|
| 18 |
|
| 19 |
|
| 20 |
|
| 21 |
|
| 22 |
|
| 23 |
|