Increasing the range accuracy of three-dimensional ghost imaging ladar using optimum slicing number method
[Yang Xu, Zhang Yong, Xu Lu, Yang Cheng-Hua, Wang Qiang, Liu Yue-Hao, Zhao Yuan† ]
]
]
|
|


†Corresponding author. E-mail: zhaoyuan@hit.edu.cn
*Project supported by the Young Scientist Fund of the National Natural Science Foundation of China (Grant No. 61108072).
The range accuracy of three-dimensional (3D) ghost imaging is derived. Based on the derived range accuracy equation, the relationship between the slicing number and the range accuracy is analyzed and an optimum slicing number (OSN) is determined. According to the OSN, an improved 3D ghost imaging algorithm is proposed to increase the range accuracy. Experimental results indicate that the slicing number can affect the range accuracy significantly and the highest range accuracy can be achieved if the 3D ghost imaging system works with OSN.
Ghost imaging with a thermal source has been widely studied recently.[1– 5] Moreover, Erkmen and Shapiro described a computational ghost imaging arrangement, the so-called virtual ghost imaging, by utilizing a single bucket detector with no spatial resolution.[6, 7] Their proposed method facilitated the application of ghost imaging in practice.[8] Unlike the conventional thermal ghost imaging, their proposal omitted the reference arm path. From then on, more and more researchers have paid a great deal of attention to the application of ghost imaging.[9– 14] More recently, three-dimensional (3D) ghost imaging has been reported.[15, 16] Compared with the two-dimensional (2D) ghost imaging, 3D ghost imaging can provide a great deal of information about the target for remote sensing.
However, there is no analysis on the range accuracy of the 3D ghost imaging. Range accuracy is one of the most important parameters to evaluate the quality of range images and the centriod method is usually utilized to increase the range accuracy. In this paper, the range accuracy of 3D ghost imaging with the centriod method is derived for the first time and the influence of the slicing number on the range accuracy is also analyzed. According to the theoretical analysis, it is concluded that a large slicing number cannot always assure a high range accuracy. Therefore, an optimum slicing number (OSN) of the 3D ghost imaging is determined. The slicing number over or below the OSN will lead to the decrease of range accuracy of the 3D ghost imaging. In addition, the OSN method is introduced to increase the range accuracy and the OSN is also derived based on the range equation.
An outdoor experiment is performed in the study to illuminate the theoretical analysis results. The target of our experiment is a wall of a building about 180 m away. The OSN method, centriod method, and conventional method are utilized to obtain range images of the target respectively. A comparison among the range images obtained with different methods shows that the range accuracy of the OSN method is best. The range image of the target is measured by a scanning laser radar used as a reference, and range accuracies of range images obtained with different methods are calculated. The calculated results quantitatively indicate that the range accuracy with the OSN method is highest. The investigation of this study shows the potential application of 3D ghost imaging in the field of remote sensing in the future.
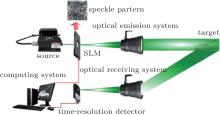
The difference between conventional 2D ghost imaging and 3D ghost imaging is that the sensor with no spatial resolution (bucket detector) of 3D ghost imaging is a time-resolved detector. The reflected light from the target is collected by no spatial resolution detector. If targets are located at different positions, ghost imaging of all the different targets can be obtained at different time slices. The schematic of the 3D ghost imaging system is shown in Fig. 1. The source of this system is a pulse laser. The laser is modulated by a transmission spatial light modulator (SLM) and a telescope system is utilized to emit speckle patterns on the target. The detector in this system is a time-resolution single-pixel detector and we use a collecting lens to collect echo light. After a correlation calculation between the output of the bucket detector and speckle intensity distributions, 3D images of the target can be obtained.
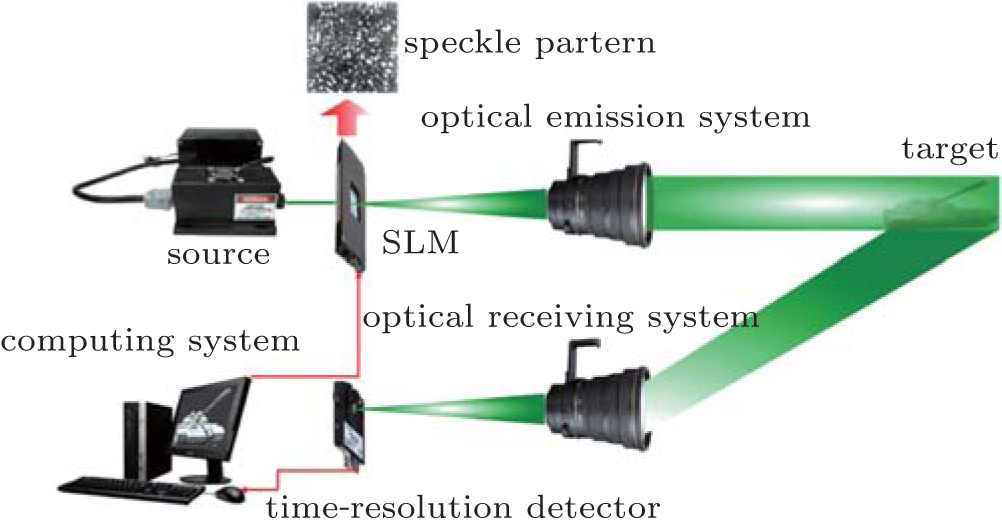 | Fig. 1. Schematic diagram of 3D ghost imaging system. |
According to the basic theory of ghost imaging, the image of a certain time slice can be obtained by correlating total reflected light intensity B (t) measured by time-resolution single-pixel detector and the intensity distribution of speckle pattern I (r, t) measured by the CCD. The speckle pattern I (r, t) illuminating on targets is generated by computer. Hence, the correlation function of intensity fluctuations G(2)(r, t) can be expressed as[17]

In Eq. (1), G(2)(r, t) presents the image of 3D ghost imaging at a certain time-slice t; 
In the setup, the light of the laser is expressed as

where P0 is the peak power of the laser and a is the pulse width. The intensity distribution of the laser is modulated by the SLM. Therefore, the intensity distribution illuminating the target can be given by
where I (r) is the speckle pattern illuminating the target. Supposing that the optical receiving system can collect all the echo light from targets, the intensity reflected from the targets at the transverse coordinates r is described as
 |
where T (r) is the reflectivity of the target and g (t) is the range-gate of the detector. In this system, the range-gate of this bucket detector is expressed as
where t1 is the start time, T is the time step, and N is the total number of range gates. Suppose that 
According to Eqs. (1) and (6), the nth slice of the correlation function of intensity fluctuations is expressed as
where G (r) is the ghost image at the transverse coordinate r. The number of measurement M should be very large to ensure a high enough SNR.
Through Eqs. (7) and (8), we can obtain K slices of intensity images. For transverse coordinate r, the maximum G(2)(r, t + nT) can be picked out and the corresponding n should be recorded as m. Therefore, in the conventional method, the distance between the target at transverse coordinate r and the detection system can be expressed as
However, the range accuracy of this method is relatively low. In practice, the centroid method is utilized to process the ghost imaging slice.
With the help of Eq. (7), the distance at transverse coordinates r can be derived by the centroid method, which can be expressed as
Range accuracy is an important parameter to evaluate the quality of the 3D ghost imaging. Range accuracy 
Equation (11) gives the range accuracy of 3D ghost imaging with the centroid method. When 

When the noise of intensity images is not small enough to be ignored, the ghost image is:
where G′ (r) is the ghost image signal, and noise of ghost imaging can be expressed as noise = G′ (r)/SNRn. Submitting Eq. (11) into Eq. (12), the range accuracy is given as
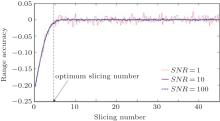
According to Eq. (13), the range accuracy changes with the slicing number. Figure 2 shows the variations of range accuracy with the slicing number for different SNR levels. The average SNR of all slices is utilized to value the SNR level, and average SNR is expressed as
where K is the total number of slices. In Fig. 2, the average SNR values of all slices are selected as 1, 10, 100. If SNR is at a high level, the range accuracy improves with the increase of the slicing number. When the slicing number is selected to be above a certain value, the range accuracy does not change with the slicing number. If SNR is at a low level, the range accuracy improves rapidly like the high level SNR circumstance below a certain slicing number. However, when the slicing number is above this slicing number, the influence of the noise becomes more and more intense. Range accuracy fluctuation greatly increases with slicing number increasing. Therefore, simply increasing the slicing number will reduce the range accuracy. The slicing number should be set as a particular value to ensure a high range accuracy. This particular value is defined as the optimum slicing number (OSN) of the system.
 | Fig. 2. Variations of range accuracy with the slicing number for average SNR values of 1, 10, and 100. |
According to the above analysis, it can be concluded that the noise is a major factor influencing the range accuracy when the slicing number is greater than the OSN. When the slicing number is less than or equal to OSN, the range accuracies at different SNR levels are nearly the same. Therefore, we can use Eq. (11) to calculate the range of targets. Range accuracy is best when the slicing number is set as OSN. We propose to process each range slice according to the OSN and to synthesize the results into a full range image. The OSN method can be expressed as
where N is the OSN; n = 1, 2, 3, … ; and G(2)(r, t1 + nT) reaches the maximum value when n = m. Through Eq. (14), we can determine the OSN which is considered as the key point for the OSN method. According to the definition of m, the maximum of the correlation function of intensity fluctuation G(2) (r, t1 + nT)max is expressed as
If G(2)(r, t1 + nT) satisfies the inequality

the contribution of the correlation function of intensity fluctuation G(2)(r, t1 + nT) to r is less than that of the noise of G(2)(r, t1 + nT)max. In this case, these calculated intensity fluctuations are actually unreliable and should be rejected. According to Eq. (13), when n = m + N/2 and n = m − N/2, G(2)(r, t1 + nT) equals G(2)(r, t1 + nT)max/SNR. Utilizing Eqs. (7) and (15), the relationship is shown as
Solving Eq. (15), the OSN is given by

The noise of ghost imaging originates from different combinations of field variations and shot noises.[19, 20] As to our system, SNR is dominated by the shot noise of a single pixel detector and the noise generated during the propagation of a speckle. The OSN method is a modified centriod method which can eliminate the influence of shot noise. Besides, the conventional centriod method utilizes all ghost imaging slices to calculate the range image. All the noise from slices without target information will reduce the 3D ghost imaging range accuracy. With the OSN method, only the slices containing target information are used to obtain the range image. Noises from useless slices cannot influence the range image. Therefore, the range accuracy of 3D ghost imaging with the OSN method is higher than that with the conventional method and the centriod method.
In order to further illustrate that the OSN method can improve the range accuracy of 3D ghost imaging, the experiment is carried out.
In our experimental system, a diode-pumped, active Q-switched Nd:YAG solid-state laser is used as a source. The wavelength of the laser is at 532 nm with a pulse width of 30 ns. The repetition frequency of a pulse is 10 Hz and the average energy of each pulse is 0.2 mJ. The laser is controlled by an external triggering.
The SLM in our system is a translucent liquid crystal SLM based on the amplitude. Its maximum frame rate is 60 Hz. In this experiment, the SLM works at a frame rate of 10 Hz. The active area of the SLM is 36.9 mm × 27.6 mm and its pixel size is 32 μ m × 32 μ m. The SLM is controlled by a computer which generates the random binary patterns, and transmits them to the SLM. The size of the random binary pattern is 1024 × 768 and the rate of change of the pattern on the SLM is 10 Hz.
The echoed signal is recorded by an ultrafast PIN photodiode with 1.5 GHz response frequency. There is a high-speed data acquisition card connected to the PIN photodiode and the sampling frequency of this data acquisition card is 200 MHz. The data acquisition card is used to record the echoed light from the target at the different time slices. The interval between every two slices is 10ns. This experiment performs 10000-times continuous measurements to obtain the experimental results.
A 75-mm aperture convex lens with a focal length of 300 mm is utilized as the optical receiving system. There is a 5-nm narrow-band filter with a wavelength of 532-nm positioned in front of the PIN photodiode. The experiment is conducted at night, and the narrow-band filter in the experiment is used to reduce the background noise as much as possible. This experiment is performed on condition that the laser pulse width is 10 ns, the SNR is 10, and the target is about 180m away. According to Eq. (16), the OSN of our experimental system is calculated to be 4.
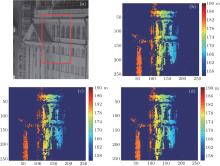
The experimental targets and the 3D ghost imaging results obtained respectively by the conventional method, the centroid method and the OSN method are all shown in Fig. 3. Figure 3(a) shows the picture of the target and the range of this target is from 160 m to 190 m. Figures 3(b)– 3(d) are the results of 3D ghost imaging, obtained by the conventional method, the centroid method and the OSN method respectively. As shown in Fig. 3(a), the target is a wall of a building. The normal direction of the target is not parallel to the illuminating direction. Figures 3(b)– 3(d) are range images of the target in a red rectangular frame in Fig. 3(a), obtained by different methods. Different colors in these range images represent different ranges. Utilizing the colorbar and colors on the range images, range information can be obtained intuitively.
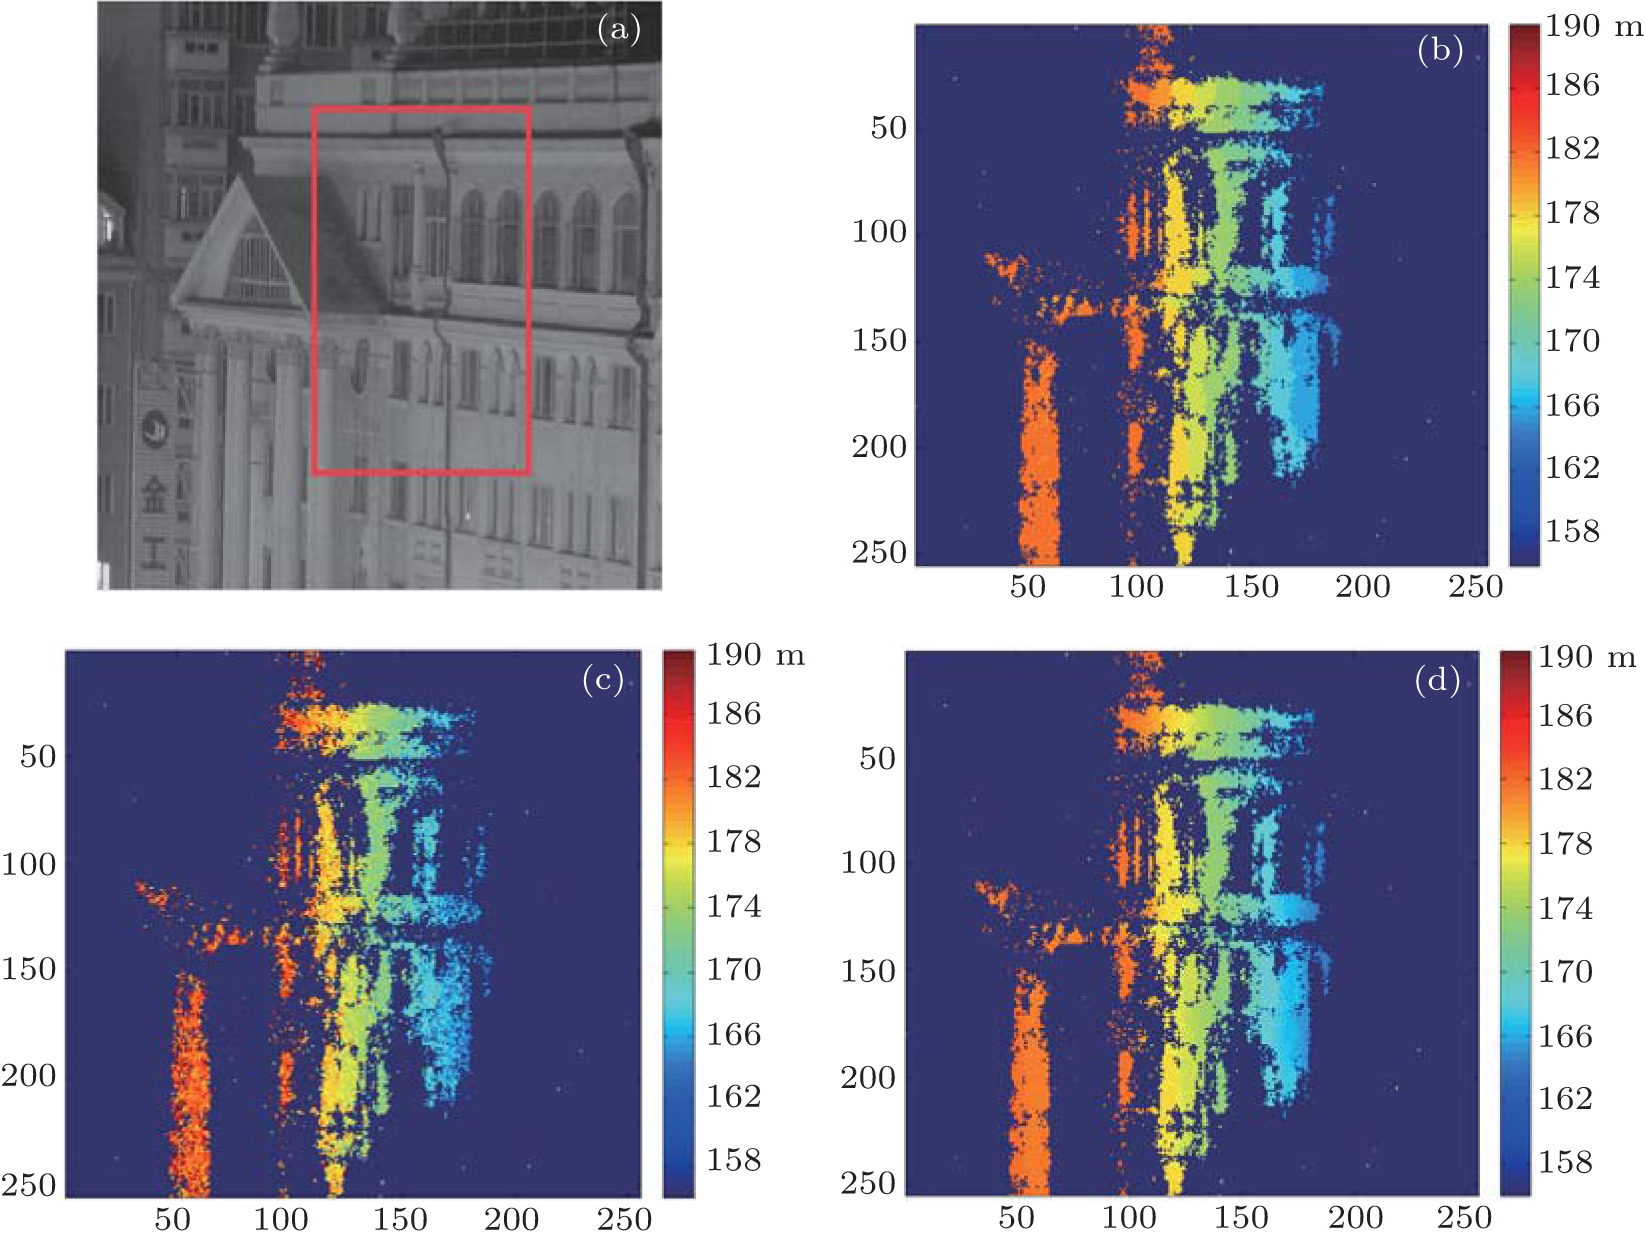 | Fig. 3. (a) Picture of the target and the target about 180 m away, 3D ghost images obtained with (b) the conventional method, (c) the centriod method, and (d) the OSN method. The colorbar on the right side in each panel represents the range scale. |
Results with different methods are not similar to each other. As shown in Fig. 3(a), the range of the wall from right to left increases gradually. Therefore, the color of range images from right to left should changes from the blue to the red gradually. However, the color of Fig. 3(b) changes from right to left in a stepwise manner. There is an obvious boundary between different colors. The range accuracy of Fig. 3(b) is lower than that of Fig. 3(d). Although, the color of Fig. 3(c) changes gradually from right to left, there are many noise points in the range image. The range accuracy of Fig. 3(c) is also lower than that of Fig. 3(d). Unlike the colors of Figs. 3(b) and 3(c), the color of Fig. 3(d) changes gradually from right to left, and the number of noise points is less than those in Fig. 3(c). Of all the above, the range accuracy of OSN is highest, which is shown by comparing differences between Figs. 3(a), 3(b), and 3(c).
Furthermore, in order to illuminate that the range accuracy of Fig. 3(d) is better than those of Figs. 3(b) and 3(c) quantificationally, range accuracy values of Figs. 3(b)– 3(d) are calculated respectively. We utilize the range root-mean-square error (RMSE) to evaluate the range accuracy. The RMSE is expressed as
where Gi, j is the range image value of the (i, j) target, obtained with one of the above methods, and Oi, j is the real range value of the (i, j) target. (i, j) represents the coordinate of the range image. According to Eq. (17), the RMSE of Fig. 3(b) is σ 1 = 1.47 m; the RMSE of Fig. 3(c) is σ 2 = 0.94 m; and the RMSE of Fig. 3(d) is σ 3 = 0.47 m. By comparing the RMSEs of the range image obtained with different methods, it can be concluded that the range accuracy of Fig. 3(d) is higher than those of Figs. 3(b) and 3(c).
The experimental results and the calculated RMSEs illustrate that Fig. 3(d) accords more with the reality than Figs. 3(b) and 3(c). The range image of the target in Fig. 3(d) can correctly reflect the range information of the target. The range accuracy of Fig. 3(d) based on the OSN method is nearly a third higher than that of Fig. 3(b) obtained using the conventional method and twice higher than that of Fig. 3(c) obtained using the centriod method. The experimental results strongly support the theoretical analysis in the subsection.
In this paper, the relationship between the slicing number and the range accuracy of the 3D ghost imaging is established for different SNRs. An OSN of the 3D ghost imaging is determined in this paper. When the 3D ghost imaging system works with the OSN method, the highest range accuracy can be achieved. According to the theoretical demonstration and the experimental analysis, one can come to the conclusion that utilizing the advanced method proposed in this paper can enhance the range accuracy significantly, and provide the range information of the target effectively. This research could promote the development of 3D ghost imaging in practice.
| 1 |
|
| 2 |
|
| 3 |
|
| 4 |
|
| 5 |
|
| 6 |
|
| 7 |
|
| 8 |
|
| 9 |
|
| 10 |
|
| 11 |
|
| 12 |
|
| 13 |
|
| 14 |
|
| 15 |
|
| 16 |
|
| 17 |
|
| 18 |
|
| 19 |
|
| 20 |
|