Border effect-based precise measurement of any frequency signal
[Bai Li-Na† , Ye Bo, Xuan Mei-Na, Jin Yu-Zhen, Zhou Wei]
, Ye Bo, Xuan Mei-Na, Jin Yu-Zhen, Zhou Wei]
|
|


†Corresponding author. E-mail: lnbai@mail.xidian.edu.cn
*Project supported by the National Natural Science Foundation of China (Grant Nos. 10978017 and 61201288), the Natural Science Foundation of Research Plan Projects of Shaanxi Province, China (Grant No. 2014JM2–6128), and the Sino-Poland Science and Technology Cooperation Projects (Grant No. 36-33).
Limited detection resolution leads to fuzzy areas during the measurement, and the discrimination of the border of a fuzzy area helps to use the resolution stability. In this way, measurement precision is greatly improved, hence this phenomenon is named the border effect. The resolution fuzzy area and its application should be studied to realize high-resolution measurement. During the measurement of any frequency signal, the fuzzy areas of phase-coincidence detection are always discrete and irregular. In this paper the difficulty in capturing the border information of discrete fuzzy areas is overcome and extra-high resolution measurement is implemented. Measurement precision of any frequency-signal can easily reach better than 1 × 10⁻¹¹/s in a wide range of frequencies, showing the great importance of the border effect. An in-depth study of this issue has great significance for frequency standard comparison, signal processing, telecommunication, and fundamental subjects.
With the development of science and technology, high-resolution time-frequency processing technology plays an increasingly important role.[1, 2] In a high-precision test system, precision of the signal frequency must be higher, and practicability of the measurement method is also a focus.[3– 6] Currently in order to improve measurement resolution, especially for the measurement of any signal, the traditional technique is always to make the reference signal equal to the frequency to be measured through frequency conversion, or to adopt relevant high-precision time interval measurement methods such as analog interpolation, vernier method, time-digit transformation, to assist the measurement of the nonsynchronous difference between the multiple periods of the measured frequency and the measurement gate.[7, 8] These methods are difficult to implement, and the ultimate measurement precision is still limited and measurement precision in a wide range of frequencies can only reach 2 × 10− 11/s∼ 3 × 10− 11/s.[9, 10]
On the basis of our long-term study of high-precision measurement, we propose the concept of a fuzzy area of resolution and its border.[11] Because of the higher stability of the measurement resolution, the comparison characteristics between the object to be measured and the standard signal can reflect different detection results inside and outside the fuzzy areas at the border more sensitively. Measurement precision only depends on resolution stability which is much higher than the resolution itself. This new principle makes it possible to significantly improve measurement precision. For instance, when the standard frequency is close to the frequency to be measured or is a multiple of it, concentrated fuzzy areas are generated, and measurement results which are apparently higher than the circuit resolution by 2– 3 orders of magnitude, are acquired.[11, 12]
There are a variety of frequency signals in frequency standard technology, telecommunication, exploration of natural phenomena, and electronic engineering, [13– 15] such as the frequency signal of 1, 420, 405, 750 Hz of a hydrogen atom’ s energy-level transition, 19.59425 MHz in a hydrogen atomic clock, 9, 192, 631, 770 Hz of a cesium-atom energy-level transition, 16.384 MHz and 19.44 MHz in telecommunication, 4.43361875 MHz of the subcarrier in a color television, signals used in global positioning systems (GPS), etc. When only one standard frequency signal is utilized to measure any signal in a wide range of frequencies, the phase coincidence detection fuzzy areas are always discrete because of the complex relationship between them.[11] Stochastic phase-coincidence detection information cannot guarantee the high measurement precision which is obtained by using resolution stability. At this moment differences in index between using the border effect and using other methods are great. An in-depth research on the border effect helps not only the measurement precision, but also the measurement scope and response time. Ultrahigh resolution measurement of any frequency signal can work effectively in precision-improvement and function-extension of many fields. This new approach is not limited to the timefrequency field, but is of great value for measuring a variety of physical quantities, thus satisfying the requirements for higher precision in many fundamental scientific studies.
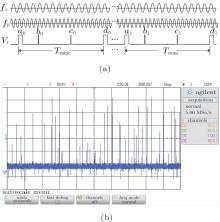
The phase changes between any two periodic signals are regular. The frequency-measuring method in the present paper is based on phase-change regularities between arbitrary frequency signals. An analysis of these regularities is made first. When the relationship is complex between the reference frequency f0 and the frequency to be measured fx, the phase relation is shown in Fig. 1(a), where Vt represents the phase state within the scope of phase-coincidence detection: narrow pulses indicate that the phase difference is close to 0° , and wide ones mean that the phase difference is close to 360° . Within a Tmin c (the least common multiple period), the change in phase difference is not monotonic.[16] However, the corresponding phase difference is equal in each Tmin c (a0 = a1, b0 = b1, c0 = c1, and d0 = d1 if phase-differences are free from external noises). On rearranging phase-differences within one Tmin c in descending order, we know that a constant difference Δ T exists between the two adjacent phase-differences, and is called quantized phase shift resolution.[16]Tmin c and Δ T can be determined by Eq. (1).
where fmax c is the greatest common factor frequency, and A and B are two relatively-prime positive integers.[16]
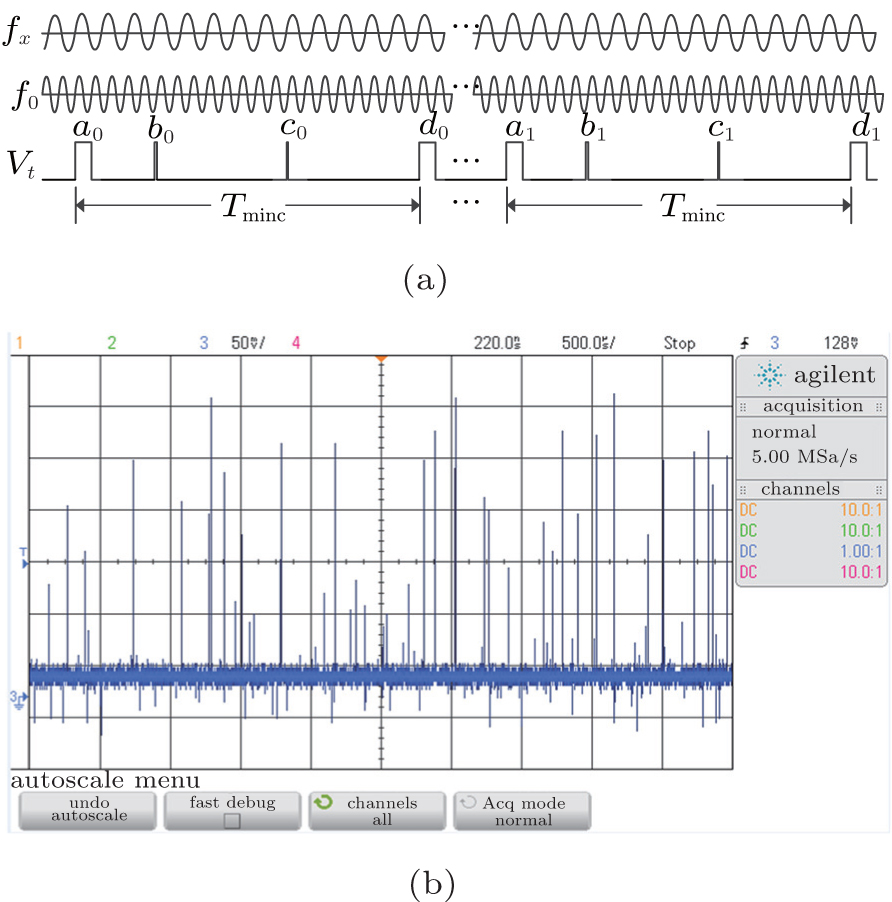 | Fig. 1. Characteristics of phase coincidence information between arbitrary periodical signals, showing (a) discrete and complex phase relationship and (b) discrete fuzzy area. |
For a circuit with limited resolution, when the phase difference is smaller than the resolution of the circuit, a series of coincidence pulses is generated, forming detection fuzzy areas. Monotonically-changing phase leads to detection of concentrated “ coincidence cluster” around the strict phasecoincidence points, resulting in concentrated fuzzy areas.[17] In this case, the phase difference always enters the inside of the fuzzy area from the outside of it monotonically and continuously.
When the frequency relation between two signals is complex, phase difference is irregular, and coincidence pulses can be detected at certain positions, forming discrete fuzzy areas as shown in Fig. 1(b). Using these irregular coincidence pulses to trigger the counting gate, along with some external random factors, causes a large difference between phase-differences of opening the gate and closing the gate, and thus the ultimate measurement error is great.
Assume that the coefficients of deviation of pulses which trigger the opening and closing of the actual measurement gate from the actual phase-coincidence pulses are ζ 1 and ζ 2, respectively, then the phase difference at gate-opening position θ (ζ 1) and the phase difference at gate-closing position θ (ζ 2) are denoted as follows:[11]
where δ represents the error resulting from the counting gate.
By Eq. (2) we conclude that the closer to θ (ζ 2) the θ (ζ 1) is, the higher the frequency-measuring precision is. If θ (ζ 1) were equal to θ (ζ 2), the quantization error could be thoroughly eliminated, and then the highest precision could be obtained.
For the case in which discrete fuzzy areas result, the detected information is complicated and its characteristics vary greatly with the numerical change of the quantity to be measured. It has been found in our study that phase information states (e.g. phase coincidence information) are very stable within the fuzzy area, but the phase coincidence between signals either can or cannot be detected at the border of a fuzzy area. Meanwhile, a slight change at the border of a fuzzy area reflects subtle characteristics of the comparison signal. If pulse information at the border can be extracted, and the stability of the circuit is high, the states of the phase difference between the two signals at the opening position and that at the closing position of the counting gate are nearly the same, and then θ (ζ 1) and θ (ζ 2) are very close to each other, leading to the smallest quantization error δ . The relatively strict synchronism of phase difference entering fuzzy areas twice merely depends on the stability of the border of the fuzzy area, and it determines the synchronization between signals and a counting gate in measurement of the frequency and other parameters, thus realizing high-precision measurement. In this case, measurement stability relies on the stability of the border of the fuzzy area, namely the stability of the coincidence detection resolution.
Limited measurement resolution results in a discrete fuzzy area when the change of phase differences between two signals is not monotonic. It can be found that the original phase coincidence information is lost after a slight phase shift and that new phase coincidence points, which did not exist before, appear after the shift. Reversal of phase coincidence information resulting from delaying and phase-shift demonstrates that this coincidence is at the border of a certain collateral fuzzy area. Based on the border effect, if the border information can be accurately extracted, and a measurement gate is formed by using it, then the stability of the fuzzy area can be utilized to replace the resolution of the fuzzy area, thus greatly improving precision. In this paper a method of measuring any frequency signal based on the border effect is proposed, in which frequency conversion techniques and other assisted precise time measurement methods are not employed, and simple circuits are used.
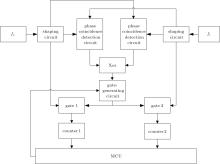
As discussed above, even though no obvious fuzzy area is found, border information can still be detected through the processing of borders of discrete fuzzy areas. Delay and selective processing of a fuzzy area are conducted in two circuits to detect the border information of a discrete fuzzy area; two similar border phase states serve as the signals which will open and close the counting gate, and then the quantization error is reduced and high-precision is obtained. The block diagram and corresponding waveforms are shown in Figs. 2 and 3, respectively.
 | Fig. 2. Block diagram of frequency measurement for discrete fuzzy area. |
In Fig. 2, f0, the reference frequency signal, and fx, the frequency signal to be measured, are two signals with a complicated relationship. Both of them are sent into shaping circuits to produce square waves, resulting in two groups of coincidence pulses. The two similar phase-coincidence detection circuits are different in delaying and processing, which causes the two fuzzy areas to be generally the same with some opposite detection information. The border information is extracted by real-time exclusive-OR processing of the two groups of phase-coincidence pulses.
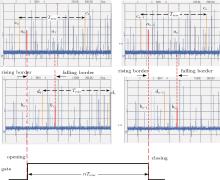
In Fig. 3, the phase coincidence detection information between f0 and fx is shown, the two panels in the first row show the results of one phase-coincidence detection circuit and the two in the second row display the results of the other circuit. The two groups of phase coincidence detection pulses are generally identical, but slightly different because the difference between the circuits in delaying leads to contrary detection results at some positions. For instance, a0 (the red thick line) is detected as the phase-coincidence position in the waveform figure above, whereas b0 is not in the figure below; a1 is not detected, but b1 is. And states of phase between a0 and a1 are identical to that between b0 and b1. In this way, it can be determined that a0 (or b0) and a1 (or b1) are the borders of a discrete fuzzy area through exclusive-OR processing.
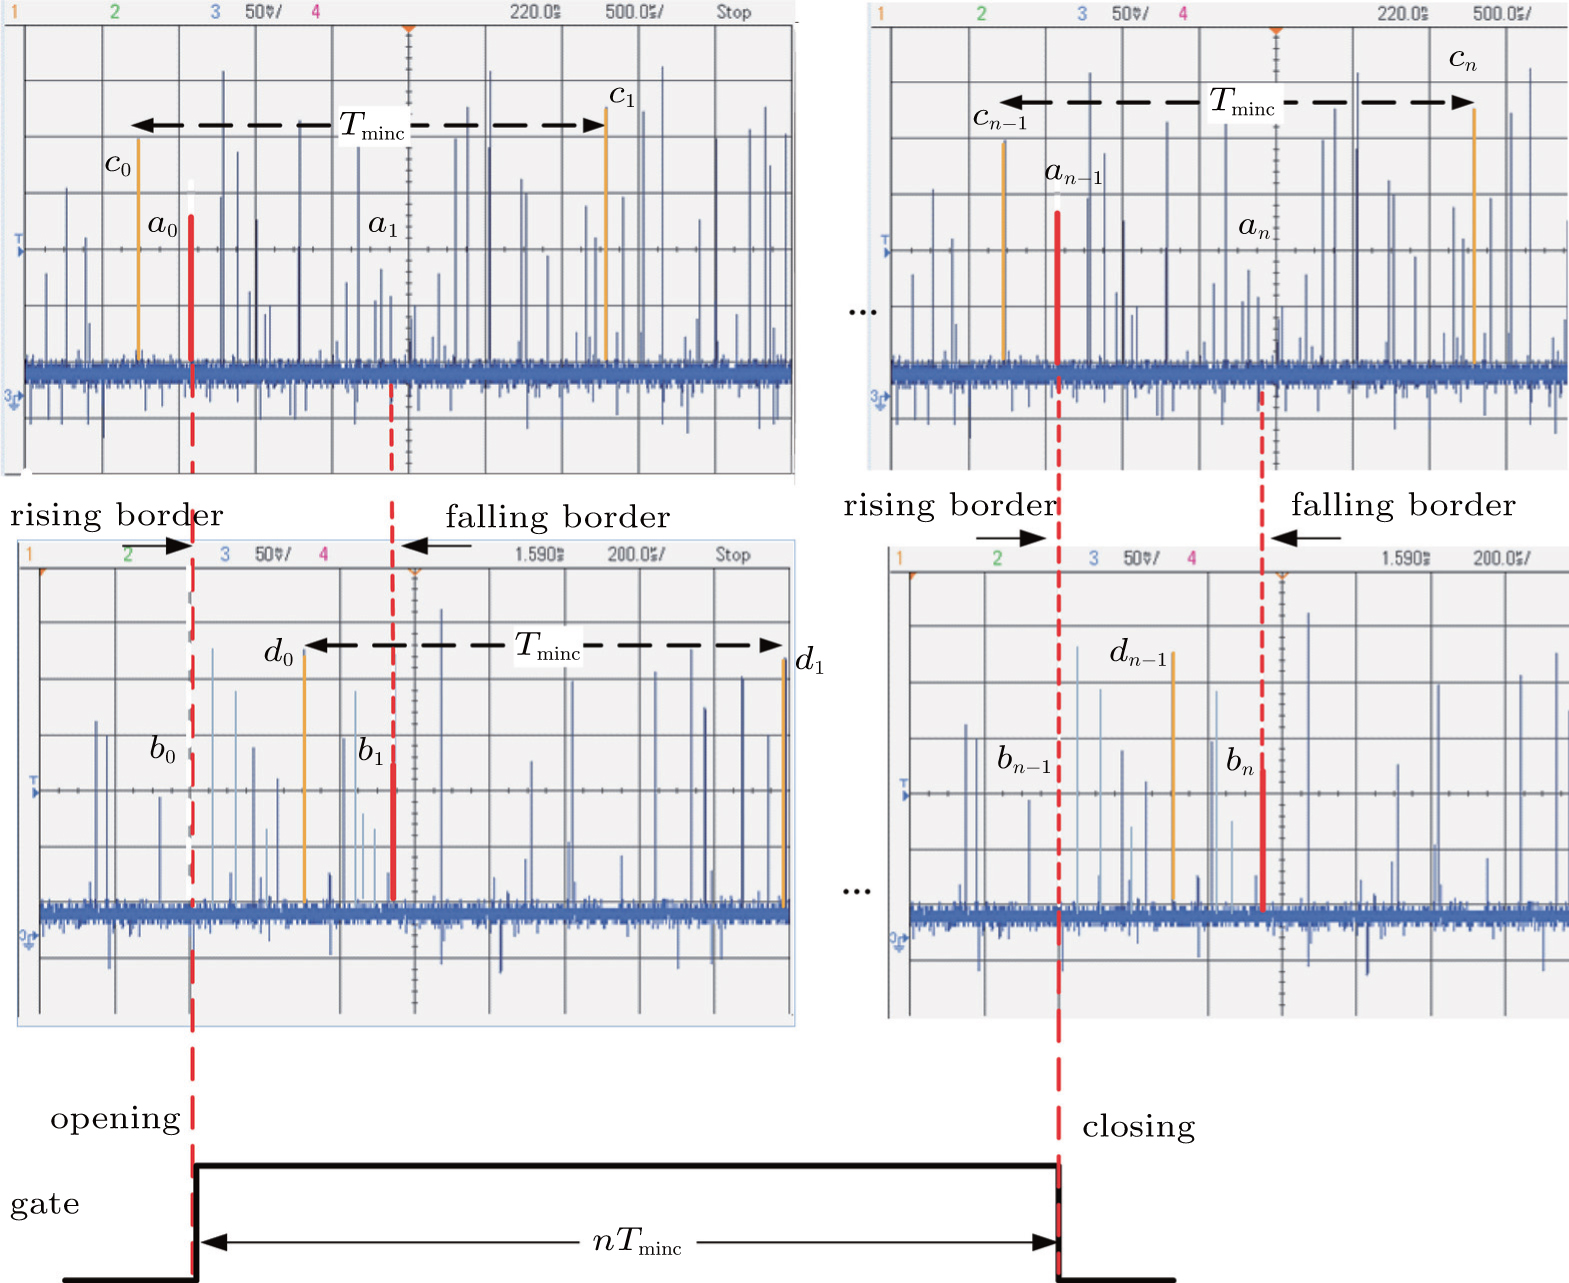 | Fig. 3. Waveforms of discrete fuzzy area processing. |
It can be seen from Fig. 3 that the difference in coincidence- detection only exists at the border of fuzzy area. When the reference gate is started and the first coincidence pulse is detected, the actual measurement gate is triggered. When the reference gate is closed and the first coincidence pulse is detected, the actual measurement gate is closed. f0 and fx are counted respectively in the actual measurement gate, and then the frequency to be measured is determined by Eq. (3)

where Nx and N0 are the counting numbers of fx and f0, respectively. This equation is also applied to instruments of multiple-period and synchronous measurement, [16] but the extent of synchronization is different, and hence precision is different.
In the scheme, the key work of realizing precise measurement is to utilize two phase coincidence detection circuits with slight differences and a real-time exclusive-OR device to detect border coincidence pulses of discrete fuzzy areas. A phase coincidence detection circuit has relatively high stability, in other words, phase coincidence detection resolution changes in a sense, and there are differences between the ps (picosecond) level and the 10-ps level, which leads to different detection results in the borders of fuzzy areas. Furthermore, the states which vary from “ detected” to “ not detected” and from “ not detected” to “ detected” only appear at the border of a fuzzy area. The difference between two phase coincidence detection circuits in delaying can be utilized to find these coincidence pulses with different detection results, and they can be extracted through real-time exclusive-OR processing. The border phase information in this case acts as the opening and closing signals of the actual measurement gate, and in this way the deviations from strict phase coincidence at the gateopening position and the gate-closing position are nearly the same, guaranteeing the smallest error and improved measurement precision.
Three experiments are conducted by the frequencymeasuring method discussed above, in which all of the reference signals are the frequency signal of 10 MHz generated by OSA8607, and all the signals to be measured are those synthesized by HP8662A. Experiment 1 is for two signals with a complicated relationship, in which the frequency of the signal to be measured is 4.290913 MHz, and two random coincidence pulses which are able to trigger the measurement gate are used to open and close the measurement gate; the border effect is not adopted. Experiment 2 is the comparison experiment to highlight the influence of the border effect, and frequencies of the signals to be measured are 4.290913 MHz (in Table 2) and 82.5001 MHz (in Table 3), respectively. Border phase information with differences between the two detection circuits is employed to trigger the gate. Experiments 1 and Table 2 are conducted with the same signals to be measured (their frequencies are both 4.290913 MHz) to highlight the obvious improvement in the border effect. Results of the three experiments are shown in Tables 1, 2, and 3.
| Table 1. Direct measurement data at frequency 4.290913 MHz. |
| Table 2. Measurement data at frequency 4.290913 MHz with border effect. |
| Table 3. Measurement data at frequency 82.5001 MHz with border effect. |
Twenty groups of measurement data are chosen in Table 1. The results in Table 1 indicate that in experiment 1, if the discrete fuzzy areas are not processed but are directly used to measure the frequency through phase coincidence detection circuit, the frequency stability is only 2.8 × 10− 9/s, which is consistent with the ns-resolution of the circuits used for detecting the phase coincidence.
It can be seen from Tables 2 and 3 that by the proper application of the border effect and capturing borders of discrete fuzzy areas, the measurement results are obtained to be two orders of magnitude higher than the resolution of phase coincidence detection circuits. The measured frequency stability of the 4.290913 MHz signal is 6.4 × 10− 12/s, and the frequency stability of 82.5001 MHz is 7.5 × 10− 12/s, consistent with the frequency stability of signals synthesized by HP8662A.
In experiment 1, when there is only one phase-coincidence detection circuit, what triggers the actual measurement gate is not the borders of fuzzy areas because of the discreteness of fuzzy areas, but random pulses which happen to be able to trigger the gate. The extent of deviation from the strict phase coincidence of pulses triggering the opening and closing of the gate is great, for instance, phase difference at the opening of the gate θ (ζ 1) is a0, and phase difference at the closing of the gate θ (ζ 2) is cn− 1, the difference between a0 and cn− 1 is affected by the resolution, and is on the order of nanosecond (ns). This leads to a large quantization error δ ; in turn, the measurement precision is low, and results are concordant with the resolution of phase coincidence detection circuits.
In experiments 2 and 3, border information under the discrete condition can be detected by processing the discrete fuzzy areas. The experiment has two phase coincidence detection circuits; due to the stability of phase coincidence detection circuit, i.e., changes of a certain degree in phase coincidence detection resolution will lead to the phase difference at the border of the coincidence detection fuzzy area, shown as b0 and bn− 1 in Fig. 3, to increase and come out of the border of a fuzzy area. Borders in this case are adopted as the opening and closing signals of the measurement gate, in other words, θ (ζ 1) is b0 and θ (ζ 2) is bn− 1. As b0 and bn− 1 are at the border of a discrete fuzzy area, the difference between them is influenced by the stability of detection resolution, thus being on the order of ps or even smaller than ps. Their deviations from the strict phase coincidence are similar, which ensures that the error is smallest and that the measurement precision is improved. As shown in the table, measurement resolution reaches a level of 10− 12, which is two orders of magnitude higher than the result in experiment 1.
It is apparent that the border effect can be employed to obtain the border information of coincidence detection resolution fuzzy areas in complicated cases and that frequencymeasuring precision can be improved by at least two orders of magnitude when complicated relations result in discrete fuzzy areas. The processing of the borders of fuzzy areas resulting from limited resolution improves the detection function and achieves significant improvement in measurement precision.
The discovery of the border effect of the detection resolution fuzzy area in high-precision frequency measurement enables us to employ higher stability of the resolution of detection devices to achieve significant improvement in measurement precision, which is of great significance for digital measurement instruments. The application of the border effect in measuring the frequency when fuzzy areas are discrete further demonstrates that the border effect can also be applied to the discrete fuzzy areas and that it greatly improves the measurement precision. The practical ultrahigh resolution measurement of complicated signals can work effectively and significantly to improve the precision and extend functions in a number of fields, such as the processing of telecommunication signals, energy-level transition signals of atoms, complicated instruments and devices, frequency conversion and synthesis, and processing of navigation signals.
| 1 |
|
| 2 |
|
| 3 |
|
| 4 |
|
| 5 |
|
| 6 |
|
| 7 |
|
| 8 |
|
| 9 |
|
| 10 |
|
| 11 |
|
| 12 |
|
| 13 |
|
| 14 |
|
| 15 |
|
| 16 |
|
| 17 |
|