Guo Feng, Zhang Hong, Hu Hai-Quan, Cheng Xin-Lu, Zhang Li-Yan. Hugoniot curve calculation of nitromethane decomposition mixtures: A reactive force field molecular dynamics approach* . Chinese Physics B, 24(11): 118201
Permissions
Hugoniot curve calculation of nitromethane decomposition mixtures: A reactive force field molecular dynamics approach*
Guo Fenga),b), Zhang Hongd), Hu Hai-Quana),b), Cheng Xin-Luc), Zhang Li-Yane)
School of Physical Science and Information Technology, Liaocheng University, Liaocheng 252000, China
Shandong Provincial Key Laboratory of Optical Communication Science and Technology, Liaocheng 252000, China
Institute of Atomic and Molecular Physics, Sichuan University, Chengdu 610065, China
School of Physical Science & Technology, Sichuan University, Chengdu 610065, China
School of Computer Science, Liaocheng University, Liaocheng 252000, China
*Project supported by the National Natural Science Foundation of China (Grant No. 11374217) and the Shandong Provincial Natural Science Foundation, China (Grant No. ZR2014BQ008).
Abstract
We investigate the Hugoniot curve, shock–particle velocity relations, and Chapman–Jouguet conditions of the hot dense system through molecular dynamics (MD) simulations. The detailed pathways from crystal nitromethane to reacted state by shock compression are simulated. The phase transition of N2 and CO mixture is found at about 10 GPa, and the main reason is that the dissociation of the C–O bond and the formation of C–C bond start at 10.0–11.0 GPa. The unreacted state simulations of nitromethane are consistent with shock Hugoniot data. The complete pathway from unreacted to reacted state is discussed. Through chemical species analysis, we find that the C–N bond breaking is the main event of the shock-induced nitromethane decomposition.
Keyword:
82.20.Wt; 82.30.–b; 64.30.–t; Hugoniot state; nitromethane; molecular dynamics; reactive force field
A shock wave passing through a material could modify its thermodynamic conditions toward high temperature and high pressure, the set of admissible states could be achieved from the given initial conditions called the Hugoniot curve.[1, 2] The Hugoniot curve[3– 7] is essential in understanding the ability to damage its surroundings of an energetic material. By the reaction ensemble Monte Carlo method, Bourasseau et al.[8] computed the Hugoniot curves of neat triaminotrinitrobenzene (TATB) and its detonation product mixture. Through the multiscale shock technique molecular dynamics simulations, Liu et al.[9] found that the shock velocity larger than 7 km/s would initiate the chemical reactions, and concluded that the corresponding shock initiation pressure of cocrystal of hexanitrohexaazaisowurtzitane/trinitrotoluene is 24.56 GPa by the conservation of Rankine– Hugoniot relation. Zhou et al.[10] discussed a new method of determining the time-dependent Jones– Wilkins– Lee equation of state (JWL-EOS) parameters. By the modified Tsien’ s equation of state, Zhao et al.[11] discussed the isothermal compression and Hugoniot curves of shocked nitromethane (NM). There are also several approaches to estimating the Hugoniot curves directly through molecular dynamics (MD) simulations.[12, 13] Through ReaxFF-MD simulations, Shan et al.[14] found that the CO– NO2 bond decomposition is the primary initiation reaction, which can gain more kinetic energy from shock along [001] directions of solid pentaerythritol tetranitrate (PETN). By Hugoniostat dynamics simulations, Barmes et al.[15] found that the results are in nearly perfect agreement with the result from the nonequilibrium molecular dynamics (NEMD) method. The NEMD approach[16– 18] involves creating a shock on one edge of a large system and allowing it to propagate until it reaches the other side, which always needs larger system size and longer simulation time. Equilibrium molecular dynamics approaches based on Hugoniot relations, on the other hand, could probe the dynamical and structural information using a smaller system size to study a longer-time process. Reed et al.[19] modified the integrations of the molecular dynamics simulations, making it obey the Hugoniot relations at constant shock velocities. However, Ravelo et al.[20] discussed that the equilibrium method proposed by Reed et al. exhibits large initial transient in stress as well as in volume as they chose shock velocity as the constraint parameter in determining the final equilibrium volume along the Hugoniot curve. Ravelo et al. proposed another equilibrium molecular dynamics method, in which the pressure acting on the system can be regarded as a “ piston” or dimensionless strain-rate variable driving the thermal condition to the Hugoniot state, which overcomes the limitations of other methods. Chen et al.[21] uses a Canonical ensemble (NVT) to simulate the phase transition of shocked CO– N2 mixture through scaling the temperature and variation of boundaries driving the thermal condition along the Hugoniot curve.[22]
In the present paper, by reactive force field (ReaxFF)[18, 23, 24] and Hugoniostat MD simulations, we discuss the thermodynamic properties along the Hugoniot curve of N2 and CO mixture, and solid unreacted and reacted state nitromethane. In Section 2, we present the basic theory of Rankine– Hugoniot relation and MD simulation details. In Section 3, we describe the main results obtained by Hugoniostat MD simulations of N2 and CO mixture and unreacted and reacted state solid NM. In Section 4. we draw some conclusion from the present study.
2. Methods and simulational details
2.1. ReaxFF MD
A molecular dynamics technique with reactive force field[18, 24] is employed to simulate various mixtures along the Hugoniot state. The ReaxFF-lg parameter set[23] is parameterized with London dispersion corrections to improve the equation of state predictions of energetic material.
2.2. Hugoniot curve calculation
The Hugoniot curves are a collection of thermodynamic states of a system from a given initial state after the passage of a shock wave. The curve plotted by the Rankine– Hugoniot relationship on the P– V diagram is called the Hugoniot curve. From the conservation of mass, momentum, and energy, we can obtain the Rayleigh curve as follows:
and the Rankine– Hugoniot relationship, which is
where P, V, and E are respectively the pressure, volume, and energy of the system after the shock wave passage, and P0, V0, and E0 are respectively the pressure, volume, and energy of the system in the initial state.
In this work, the Hugoniot curve calculation follows the idea of Ravelo et al., [20] by which the heat flows into the system dynamically to mimic the exothermic reactions after the shock wave passage. The procedure proposed by Ravelo et al. is similar to adaptive Erpenbeck equation of state (AE-EOS)[25] method and Chen et al.’ s idea.[21] The total process of our work can be expressed by
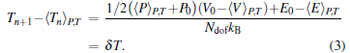
Here, 〈 〉 P, T denotes an isobaric– isothermal average in a short simulation at fixed pressure P and temperature T. Equation (2) is an iterative process to find the Hugoniot state at near pressure P, Ndof is the number of degrees of freedom of the system, kB is the Boltzmann constant, and δ T is convergence criterion. In this work, δ T is set to be 5 K. Theoretically, the AE-EOS method which uses Newton method to determine the temperature of next points (Tn+ 1 in Eq. (3)) could convergent quickly, however, from nearly all simulations the Hugoniot state can be found after 2– 3 iterations.
2.3. Simulational details
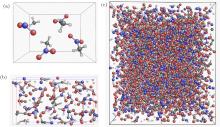
Through ReaxFF MD simulations, we discuss the Hugoniot states of the following cases: I) the decomposition intermediates of solid nitromethane at an early state which is taken from self-consistent charge density functional tight-binding (SCC-DFTB)[26– 28] MD simulations, and can go to further reactions with fast heat releasing; II) decomposition products at the end of SCC-DFTB MD simulations, in which, the simulation box is filled with larger carbon clusters, the chemical reactions take place in a slow manner (see Fig. 1); III) equal ratio between N2 and CO in mixture. All the simulations are done with LAMMPS software package. After the initial coordinates of these simulations are prepared according to the components, we carry out constant particle number, pressure, and temperature (NPT) MD simulations to relax the system to the ambient pressure and temperature. After thermal relaxations, a series of constant-stress Hugoniostat (NPHug) simulations with parameters P0 = 11.0 GPa and T0 = 2000 K are carried out. After these simulations, thermodynamic properties are discussed and analyzed.
Fig. 1. (a) The unit-cell of the NM crystal. (b) Atomic configuration of molecular fragments of decomposition products from SCC-DFTB simulations. (c) Super-cell of molecular fragments of decompositions of NM.
3. Results and discussion
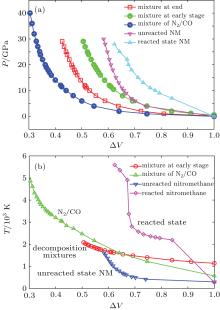
Through MD simulations, we discuss the Hugoniot state properties of different detonation mixtures. The P– Δ V and T– Δ V curves are shown in Fig. 2. The T– Δ V curves show that the relation of temperature and Δ V is almost linear, but changes sharply at about T = 2000 K. For unreacted state decomposition mixtures and unreacted NM, the total temperatures are lower than 2000 K, however, for reacted NM system, the temperatures rapidly go up to above 2000 K even at lower shock pressure (diamond line in Fig. 2(b)). The comparison between our MD results and existing theoretical and experiential data are in Fig. 3. Our simulation of decomposition mixtures is in good agreement with Zhao et al.’ s EOS prediction, [11] and consistent with Lysne’ s[29] experimental data under low pressure range.
Fig. 3. The comparisons between our ReaxFF-MD results and existing theoretical and experimental data.
The particle velocity– shock velocity (Up– Us) relations predicted by ReaxFF and ReaxFF-lg have the same trends. In general, the Up– Us relation can be represented by a linear function
The relationships of Us– Up of N2/CO at different start points are computed to study the effects of initial conditions on parameters m and b. The systems are relaxed according to the different thermal conditions (different pressures and temperatures) by NPT ensemble with a time period of about 2 ps, and the Hugoniot calculations are carried out with NPHug-MD technique. The test results show that b in Eq. (3) is affected by initial thermal conditions, and m is almost constant when initial conditions varies.
3.1. N2/CO mixtures
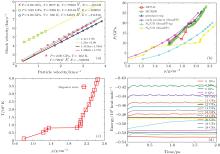
The relationships of P– ρ are compared in Fig. 4 with existing theoretical and experimental results. The comparisons show that the pressure computed by ReaxFF potential is largely underestimated at higher density. The phase transition data at point P = 8.0 GPa, T = 805 K, ρ = 1.290 predicted by ReaxFF are lower than the existing data. This point is also known as the Hugoniot elastic limit.
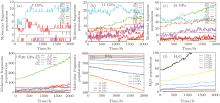
Fig. 4. (a) Shock velocity– particle velocity relationships of N2– CO mixture under different initial thermal conditions (different pressures and temperatures). (b) The comparisons of P– ρ curves among our results, theoretical calculation, and principal experiments, and the starting Hugoniot point of N2/CO mixture in this work is at T = 119 K, ρ = 0.799 g/cm3, and P = 0.01 GPa. (c) The T– ρ curves, T ranging from 119 K to 3934 K. (d) The curves of total energy versus simulation time showing that the heat producing reactions mainly take place at 10 GPa.
According to Chapman– Jouguet’ s (CJ) theories, an impact plate launches a one-dimensional shock wave propagating at speed Us, which is several kilometers per second. Molecules react fast, and a large amount of energy is released because of the shock compression at the shock-front. Shock wave propagation is sustained by the exothermic reactions at the shock-front. Therefore, the energy release rate of shock material is important for understanding the shock wave science. From Fig. 4(d), we can find that the exothermic chemical reaction occurs mainly at a pressure of around 10 GPa.
To find the reasons for the discontinuity at points around 10 GPa and 1000 K, we examine and analyze the MD history by FindMole tool[32] and VMD.[33] After 8.0 GPa, the formation of C– C bonds (OC– CO compounds) is observed, and at 10.0 GPa, the dissociation of C– O bond is observed, generating CO2 and long carbon lines. Therefore, we can conclude that the breakpoint at about 10.0 GPa is mainly due to the formation of the C– C bond and the dissociation of the C– O bond, and the beginning pressure of carbon cluster formation is at about 10 GPa, since the C– O bond dissociation gives chance for the reactions like
When pressure is above 11 GPa, the C– N bond is formed by the following reaction:
However, the dissociation of the N2 bond is never observed in the whole simulation, nor the formation of NO and NO2.
3.2. Nitromethane
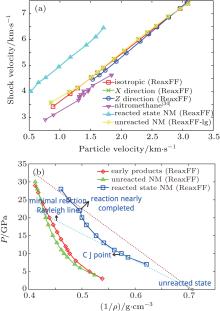
The relationships of Us– Up velocity and P– 1/ρ are shown in Fig. 5. The relationships of Us– Up of unreacted state of nitromethane are consistent with shock Hugoniot data (see Table 1), and the results show that the shock wave propagation direction has a small effect on Us– Up relation.
Table 1. Values of m and b by fitting the data points in panel (a) of Fig. 3 to Eq. (4).
The initial configurations are equilibrated at about 300 K and 0.008 GPa, next, a shock compression (as shown in Fig. 5(a)) is introduced into the system. After the compression, the simulation box enters into the reaction state along the Rayleigh line.
According to Eq. (1), the Rayleigh relation can be represented by a straight line in P– 1/ρ diagram (dotted as line in Fig. 5). The dotted lower line represents the pathway from the initial state to the minimal detonation reaction state, and the upper dotted line connects the initial state and the final state. The total reaction time from the beginning of the shock compression to the final state is about 18.0 ps. The CJ point predicted by this simulation is at about P = 11.00 GPa, T = 2358.7 K, and ρ = 1.78 g/cm3 which is tangent to the reacted state (the square line). Between the upper dotted and lower dotted line is the reaction zone.
The chemical species distributions along Hugoniot state are shown in Fig. 6. In lower pressure shock compression, NO2 (Fig. 6(a)) is the main product, which indicates that the C– N bond pyrolysis is the primary reaction, as we have discussed in the early work. When shock pressures are equal to or higher than 11 GPa, the generation rate of H2O is faster than that of NO2. The reaction kinetics of the NM decay can be found based on the chemical species analyses on the assumption that the shock-induced reactions follow the first-order decay. For the first-order reaction, the initial decomposition rate can be expressed[35– 37] by
where N(t) is the population of NM molecules at time t. Subsequently, decay rate k values at different pressures and temperatures can be obtained by fitting Eq. (4). The decay rate k values are shown in Table 2.
Table 2.
Table 2.
Table 2. Fitted decay rate k values of NM along Hugoniot state.
P/GPa
T/K
k/ps− 1
8.988
2279.52
0.010
10.048
2318.73
0.014
10.995
2358.70
0.020
13.015
2450.46
0.046
15.003
2572.45
0.052
17.994
2802.29
0.160
20.030
3371.37
0.603
Table 2. Fitted decay rate k values of NM along Hugoniot state.
Fig. 6. Numbers of major pyrolysis products H, HO, H2O, NO2, etc., along the Hugoniot line at (a) P = 7.02 GPa, T = 2191.64 K; (b) P = 11.0 GPa, T = 2358.70 K; (c) P = 15.00 GPa, T = 2572.45 K; (d) P = 20.03 GPa, T = 3371.37 K, and the comparisons among populations of (e) NM (f) H2O molecules at pressures along the Hugoniot line. The dashed lines in panel (e) refer to the fitting to the function N(t) = N0e− kt to determine the decay rate k of NM.
4. Conclusions
We investigate the Hugoniot state properties of the N2 and CO equal ratio mixtures and solid NM by ReaxFF and Hugoniostat molecular dynamics simulations. We show the detailed pathway from stable unreacted NM to reacted state by shock wave propagation in the P– Δ V and T– Δ V diagrams. The breakpoints in P– ρ profiles (Fig. 4(b)) indicate a phase transition. Through analyzing the MD trajectories, we find that the phase transition at about 10 GPa is caused by the starting of the dissociation of CO bond and the formation of C– C bond. The energy– time profile also indicates that heat releasing reaction for N2/CO system takes place mainly in an interval of about 10.0– 11.0 GPa. Hugoniostat simulations show that the reacted and unreacted state NMs have different Us– Up relations. Our unreacted state simulation results of NM are consistent with shock Hugoniot data. By the P– 1/ρ profile, we show the complete pathway of NM from unreacted state along the Rayleigh-line to the reacted state. The Chapman– Jouguet point of NM predicted by this work is at about P = 11.0 GPa, T = 2358.7 K, and ρ = 1.78 g/cm3, which is the minimal detonation condition obtained from the unreacted state. The reaction zone ranges from 7.02 GPa, 2191.6 K, 1.61 g/cm3 to 20.03 GPa, 3371 K, 2.00 g/cm3 and above. The chemical species analysis shows that the C– N bond breaking is the main event of the shock-wave-induced NM decomposition. The decay rate of NM increases as the pressure and temperature rise.
... 7] is essential in understanding the ability to damage its surroundings of an energetic material ...
1
2011
0.0
0.0
... [8] computed the Hugoniot curves of neat triaminotrinitrobenzene (TATB) and its detonation product mixture ...
1
2015
0.0
0.0
... [9] found that the shock velocity larger than 7#cod#x00A0 ...
1
2015
0.0
0.0
... [10] discussed a new method of determining the time-dependent Jones#cod#x2013 ...
2
2010
0.0
0.0
... [11] discussed the isothermal compression and Hugoniot curves of shocked nitromethane (NM) ...
... s EOS prediction,[11] and consistent with Lysne#cod#x2019 ...
1
2002
0.0
0.0
... [12,13] Through ReaxFF-MD simulations, Shan et al ...
1
2012
0.0
0.0
... [12,13] Through ReaxFF-MD simulations, Shan et al ...
1
2013
0.0
0.0
... [14] found that the CO#cod#x2013 ...
1
2006
0.0
0.0
... [15] found that the results are in nearly perfect agreement with the result from the nonequilibrium molecular dynamics (NEMD) method ...
1
2013
0.0
0.0
... The NEMD approach[16#cod#x2013 ...
1
2011
0.0
0.0
3
2003
0.0
0.0
... 18] involves creating a shock on one edge of a large system and allowing it to propagate until it reaches the other side, which always needs larger system size and longer simulation time ...
... In the present paper, by reactive force field (ReaxFF)[18,23,24] and Hugoniostat MD simulations, we discuss the thermodynamic properties along the Hugoniot curve of N2 and CO mixture, and solid unreacted and reacted state nitromethane ...
... ReaxFF MDA molecular dynamics technique with reactive force field[18,24] is employed to simulate various mixtures along the Hugoniot state ...
1
2003
0.0
0.0
... [19] modified the integrations of the molecular dynamics simulations, making it obey the Hugoniot relations at constant shock velocities ...
2
2004
0.0
0.0
... [20] discussed that the equilibrium method proposed by Reed et al ...
... ,[20] by which the heat flows into the system dynamically to mimic the exothermic reactions after the shock wave passage ...
2
2012
0.0
0.0
... [21] uses a Canonical ensemble (NVT) to simulate the phase transition of shocked CO#cod#x2013 ...
... [21] The total process of our work can be expressed by ...
1
2000
0.0
0.0
... [22] ...
2
2011
0.0
0.0
... In the present paper, by reactive force field (ReaxFF)[18,23,24] and Hugoniostat MD simulations, we discuss the thermodynamic properties along the Hugoniot curve of N2 and CO mixture, and solid unreacted and reacted state nitromethane ...
... The ReaxFF-lg parameter set[23] is parameterized with London dispersion corrections to improve the equation of state predictions of energetic material ...
2
2001
0.0
0.0
... In the present paper, by reactive force field (ReaxFF)[18,23,24] and Hugoniostat MD simulations, we discuss the thermodynamic properties along the Hugoniot curve of N2 and CO mixture, and solid unreacted and reacted state nitromethane ...
... ReaxFF MDA molecular dynamics technique with reactive force field[18,24] is employed to simulate various mixtures along the Hugoniot state ...
1
2007
0.0
0.0
... is similar to adaptive Erpenbeck equation of state (AE-EOS)[25] method and Chen et al ...
1
2007
0.0
0.0
... Simulational detailsThrough ReaxFF MD simulations, we discuss the Hugoniot states of the following cases: I) the decomposition intermediates of solid nitromethane at an early state which is taken from self-consistent charge density functional tight-binding (SCC-DFTB)[26#cod#x2013 ...
1
2007
0.0
0.0
1
2006
0.0
0.0
... 28] MD simulations, and can go to further reactions with fast heat releasing ...
1
1973
0.0
0.0
... s[29] experimental data under low pressure range ...
1
2006
0.0
0.0
1
2001
0.0
0.0
1
2012
0.0
0.0
... GPa and 1000 K, we examine and analyze the MD history by FindMole tool[32] and VMD ...
1
1996
0.0
0.0
... [33] After 8 ...
1
1980
0.0
0.0
1
2011
0.0
0.0
... For the first-order reaction, the initial decomposition rate can be expressed[35#cod#x2013 ...
1
2013
0.0
0.0
1
2013
0.0
0.0
... 37] by ...
Hugoniot curve calculation of nitromethane decomposition mixtures: A reactive force field molecular dynamics approach*
[Guo Fenga),b), Zhang Hongd), Hu Hai-Quana),b), Cheng Xin-Luc), Zhang Li-Yane)]


 , Cheng Xin-Lu