What makes the Tc of FeSe/SrTiO3 so high?
Lee Dung-Haia), b) 
What makes the Tc of FeSe/SrTiO3 so high? |
|
Lee Dung-Hai
|
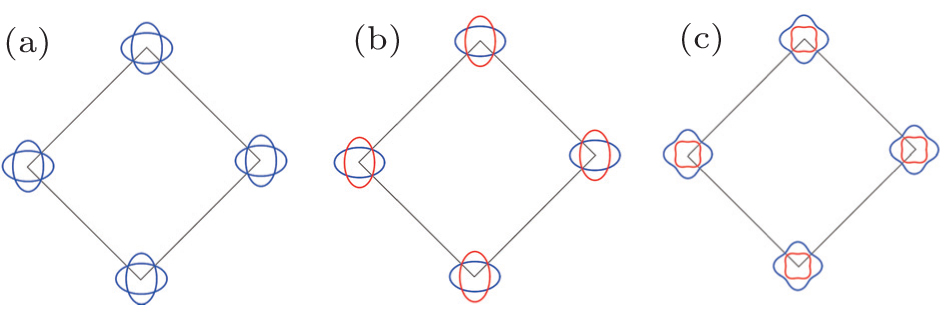
| (a)–(c) Schematic representations of three scenarios for the gap function in FeSe/STO. Here, the color designates the sign of the gap function (blue: + and red: −). It is interesting that the Fermi surface splitting at the crossing momenta (as depicted in panel (c)) is not observed in the ARPES result of Ref. [ 32 ]. |
| |