Carrier behavior of HgTe under high pressure revealed by Hall effect measurement*
Hu Ting-Jinga),b), Cui Xiao-Yana), Li Xue-Feia), Wang Jing-Shua), Lv Xiu-Meia), Wang Ling-Shenga), Yang Jing-Haia), Gao Chun-Xiaob)
Key Laboratory of Functional Materials Physics and Chemistry of the Ministry of Education, Jilin Normal University, Siping 136000, China
State Key Laboratory of Superhard Materials, Jilin University, Changchun 130012, China

Corresponding author. E-mail: xycuimail@163.com

Corresponding author. E-mail: cxgao599@aliyun.com

*Project supported by the National Basic Research Program of China (Grant No. 2011CB808204), the National Natural Science Foundation of China (Grant Nos. 11374121, 51441006, and 51479220), the Young Scientists Fund of the National Natural Science Foundation of China (Grant No. 11404137), the Program for the Development of Science and Technology of Jilin province, China (Grant Nos. 201201079 and 201215222), the Twentieth Five-Year Program for Science and Technology of Education Department of Jilin Province, China (Grant No. 0520306), and the Open Project Program of State Key Laboratory of Superhard Materials of China (Grant No. 201208).

Abstract

We investigate the carrier behavior of HgTe under high pressures up to 23 GPa using in situ Hall effect measurements. As the phase transitions from zinc blende to cinnabar, then to rock salt, and finally to Cmcm occur, all the parameters change discontinuously. The conductivity variation under compression is described by the carrier parameters. For the zinc blende phase, both the decrease of carrier concentration and the increase of mobility indicate the overlapped valence band and conduction band separates with pressure. Pressure causes an increase in the hole concentration of HgTe in the cinnabar phase, which leads to the carrier-type inversion and the lowest mobility at 5.6 GPa. In the phase transition process from zinc blende to rock salt, Te atoms are the major ones in atomic movements in the pressure regions of 1.0–1.5 GPa and 1.8–3.1 GPa, whereas Hg atoms are the major ones in the pressure regions of 1.5–1.8 GPa and 3.1–7.7 GPa. The polar optical scattering of the rock salt phase decreases with pressure.

Keyword: 64.60.–i; 72.20.–i; 07.35.+k; electrical properties; phase transitions; transport properties; scattering mechanism
1. Introduction

HgTe is a typical II– VI semiconductor. Because of many technical applications in infrared optics and telecommunication devices, it has attracted broad attention.[13] Under high pressure, HgTe undergoes three structural phase transitions, i.e., from zinc blende to cinnabar, [49] then to rock salt, [810] and finally to Cmcm[1013] at about 1.2, 8.3, and 12 GPa, respectively. In addition, a distorted-tetrahedral structure with C2221 symmetry was discovered in the transition zone from zinc blende to cinnabar.[14] At each of these phase transitions, the electrical property and carrier behavior also display abrupt changes.

In 1982, Ohtani et al.[10] studied the resistivity of HgTe under high pressure by an octahedral apparatus. They observed that the resistivity changes abruptly at about 1.0, 8.0, and 12.0 GPa, related to the corresponding structural phase transitions of HgTe. According to ρ = 1/(enμ ) (n is the carrier concentration, and μ is mobility), resistivity is determined by the carrier concentration and mobility. Ohtani et al.[10] gave a detailed description on how HgTe electrical resistivity was affected by compression. However, the physical cause of the resistivity variation was unknown. To further understand the physical origin, we feel that it is necessary to study the carrier behavior under high pressure.

At ambient conditions, HgTe is stable in the zinc blende phase with an inverted band structure.[1517] Under compression, the overlap of the valence band (Γ 8 state) and conduction band (Γ 6) decreases and the two bands, as shown by theoretical calculations, separate completely at 0.85 GPa.[15] These band structure variations would naturally lead to changes in the carrier behavior. At the same time, pressure also induces atomic displacements from their equilibrium positions, which leads to the creations of vacancies and defect energy levels, and finally leads to changes in the carrier behavior. Therefore, the carrier behavior under high pressure can reflect the atom movements and band structure variations. As a low-cost and very efficient atomic probe, the Hall effect measurement is very effective in detecting the charge carrier behavior variation under high pressure.[1821] Therefore, we decided to carry out Hall effect measurement under high pressure to further our investigation.
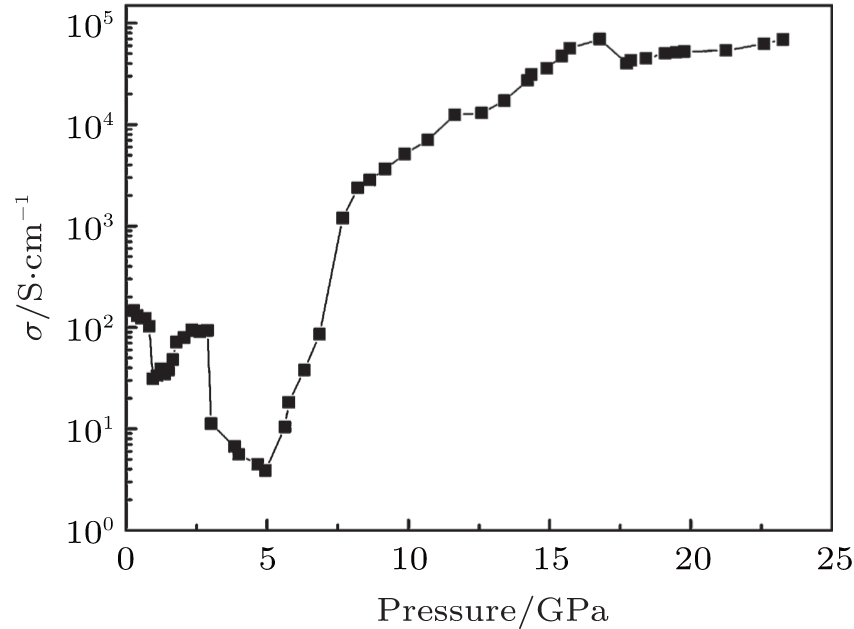
2. Experimental section

Our in situ Hall effect measurements of HgTe under high pressure were conducted on a diamond anvil cell (DAC), which is made of nonmagnetic titanium alloy. A piece of nonmagnetic rhenium was used as the gasket. A rhenium flake was preindented to about 50 μ m in thickness. A hole with about 120 μ m in diameter was drilled at the center of the indentation. The diamond culet face was 400 μ m in diameter with a beveled angle of 10° . The circuit fabricated by the photolithography method has a regular shape, good symmetry, a fixed contact area with the sample and remains unchanged under high pressure, which is necessary for conducting accurate Hall effect measurement in DAC. We chose molybdenum (Mo) as the electrodes and alumina as their protecting layer. The microcircuit was arranged according to the van der Pauw method.[22] After the Mo thin film was sputtered on a diamond anvil, the coated Mo thin film was overlaid with a van der Pauw circuit. The Al2O3 layer was sputtered after completing the Mo thin film circuit and the Al2O3 layer was removed to allow required exposure. The detailed fabrication process of the microcircuit was reported previously.[2326] The final microcircuit and the profile of our designed DAC are shown in Fig. 1. The electrical current used in this study was 0.1 mA, which was supplied by a Keithley 2400 current source. The voltage was measured by a Keithley 2700 multimeter. The magnetic flux density was measured by a Lakeshore 420 Gauss meter. All instruments were connected to a computer via a Keithley Kusb-488 interface adapter and general purpose interface bus. The measurement process was automatically performed. The HgTe powder sample was purchased from the Alfa Aesar Co. with a purity of 99.999% and compressed up to 23 GPa. Pressure was measured using ruby fluorescence. No pressure medium was used in this study. The magnetic flux density applied to the sample was 6.00 kG.

Fig. 1. Completed microcircuit on diamond anvil (left) and DAC configuration for Hall effect measurement (right). 1: Mo, 2: alumina layer, 3: sample chamber, 4: ruby. A, B, C, and D are the contact ends of the microcircuit.

3. Results and discussion

Figures 2 and 3 show the pressure dependence of Hall coefficient, carrier concentration, mobility and conductivity of HgTe. It can be seen that Hall coefficient and carrier concentration change discontinuously at 1.0, 1.5, 1.8, 3.1, 5.6, 7.7, and 17.7 GPa. The mobility changes discontinuously at 1.0, 1.5, 3.1, 5.6, 7.7, and 17.7 GPa. The conductivity changes discontinuously at 1.0, 3.1, 5.6, 7.7, and 17.7 GPa.

Fig. 2. (a) Hall coefficient, (b) carrier concentration, (c) mobility of HgTe under high pressure.

Fig. 3. Conductivity of HgTe under high pressure.

Before 1.0 GPa, HgTe is stable in the zinc blende phase and its Hall coefficient is negative, which indicates that the electronic conduction is the dominant transport process for the zinc blende phase of HgTe. The carrier concentration decreases by 55.2% and the mobility increases by 58.5% as the pressure increases from ambient condition to 1.0 GPa, leading to a decrease of conductivity by 29%.

At about 1.0 GPa, the first discontinuity in the plots of the pressure dependence of the Hall coefficient and carrier concentration is associated with the emergence of the cinnabar phase in HgTe.[49] In the pressure range from 1.0 to 3.1 GPa, the Hall coefficient experiences steep changes. The Hall coefficient changes to positive at 1.0 GPa and increases with pressure in the pressure region from 1.0 to 1.5 GPa. The abrupt decrease of Hall coefficient at 1.5 GPa is related to the appearance of C2221 structure.[14] The decreasing trend of the Hall coefficient remains up to 1.8 GPa, at which point the Hall coefficient changes from positive to negative. Above 1.8 GPa, the decrease of the Hall coefficient absolute value is associated with the gradual disappearance of zinc blende and the C2221 structure with pressure in the mixed phase region.

After 3.1 GPa, the Hall coefficient becomes stable and the sample becomes a single phase of cinnabar. The Hall coefficient changes from negative to positive at 5.6 GPa, indicating that the dominant transport process of the cinnabar phase changes from electron to hole conduction. Both the carrier concentration and mobility decrease with pressure until 5.6 GPa and then start to increase with pressure, leading to corresponding variations in the conductivity of the cinnabar phase.

With increasing pressure, another two discontinuities were found in all the parameters at 7.7 GPa and 17.7 GPa, which corresponds respectively to the phase transitions of HgTe from cinnabar to rock salt, [810] and to the Cmcm phase.[1013] The Hall coefficients of rock salt and Cmcm phases are positive, indicating that hole conduction is the primary transport process. The mobility of the rock salt phase remains practically constant with increasing pressure. Hence, the conductivity increase of the rock salt phase is mainly due to the increase of carrier concentration. For the Cmcm phase, the carrier concentration increases and the mobility decreases with pressure. Therefore, the increase of the conductivity results from the increase of carrier concentration.

In the zinc blende phase, HgTe has an inverted band structure at ambient pressure.[1517] The decrease of carrier concentration indicates that the overlapped valence band (Γ 8 state) and conduction band (Γ 6 state) gradually separate under pressure, consistent with the conclusion of theoretical calculations.[15, 17] Under high pressure, the structure of HgTe changes from zinc blende through cinnabar and C2221 structure to rock salt.[410, 14] The cinnabar and C2221 structure have always been considered as intermediate phases between the zinc blende and the rock salt structures.[7, 14, 27] With the pressure increasing, the coordination number of HgTe increases from 4 (zinc blende structure) to 6 (rock salt structure).[410, 14] The increase of coordination number requires relative movements of atoms. If a Hg atom moves with increasing pressure, a Hg vacancy will generate and the hole concentration will increase.[2831] On the other hand, if a Te atom moves, the Te vacancy will generate and the electron concentration will increase.[28]

At around 1.0 GPa, the Hall coefficient changes from negative to positive, indicating the dominant carrier changes from electron to hole. This suggests that the Hg vacancies are generated and Hg is the dominant one in atomic movements. From 1.0 to 1.5 GPa, the decrease of the hole concentration indicates an increase in Te vacancies, and Te becomes the dominant one in atomic movements. From 1.5 to 1.8 GPa, both the content of C2221 structure in the mixed phase and the hole concentration increase with pressure, indicating the C2221 structure leads to a generation of Hg vacancies. At 1.8 GPa, the dominant carrier returns to an electron and then increases with pressure until 3.1 GPa, which indicates that Te now becomes the major one in atomic movements. For the cinnabar phase (from 3.1 to 7.7 GPa), the electron decreases in the region of 3.1– 5.6 GPa and the dominant carrier changes to the hole at 5.6 GPa, then the carrier concentration (hole) increases from 5.6 to 7.7 GPa. It is reasonable to conclude that under compression, the Hg vacancies increase and the Hg is the dominant one in atomic movements from 3.1 to 7.7 GPa.

For HgTe, the mobility is mainly limited by ionized impurity scattering and polar optical scattering.[32, 33] The resultant mobility can be expressed as[34]

where μ PO and μ II represent the mobility due to polar optical and ionized impurity scattering. μ II can be expressed as[35, 36]

where NI is the ionized impurity concentration. From Eq. (2), it can be seen that the larger the NI, the smaller the μ II.

At ambient pressure, due to the inverted band structure of HgTe, the interband resonant processes of conduction and valence in optical phonon scattering give an important contribution to the total scattering.[32, 37] For the zinc blende phase, the increase of mobility with pressure means the interband resonant scattering decreases. From this, one can infer that the overlapped valence band (Γ 8 state) and conduction band (Γ 6 state) of HgTe separates with pressure, consistent with the above conclusion obtained from the carrier concentration analysis.

The sharp decrease of mobility at 1.0 GPa indicates the increase of ionized impurity concentration related to the appearance of the cinnabar phase.[49] After 1.0 GPa, the increase of mobility with pressure means further weakening of the interband resonance. The abrupt decrease of Hall mobility at 1.5 GPa is associated with the appearance of the C2221 structure in the mixed phase.[14] Above 1.5 GPa, due to the separation of the valence band and conduction band with pressure, the interband resonant scattering reduces and has a positive contribution to the mobility. As the mobility decreases with pressure, it indicates the ionized impurity scattering becomes the dominant contributor and leads to the conclusion that the ionized impurity concentration increases with pressure.

For the cinnabar phase of HgTe, the electron concentration is close to the hole concentration, so the mobility can be expressed as[3840]

where p is the concentration of holes, n is the concentration of electrons, μ h is the mobility of holes, and μ e is the mobility of electrons. At 5.6 GPa, the dominant carrier changes from electron to hole, which leads to the lowest value of mobility.

For the rock salt phase, the ionized impurity concentration increases with pressure (the mercury vacancy can be seen as a kind of impurity). This would lead to a decrease of mobility with pressure, different to what was actually observed. Consequently, the polar optical scattering of the rock salt phase must decrease with pressure. For the Cmcm phase of HgTe, the mobility decreases with increasing pressure.

4. Conclusions

In conclusion, in situ Hall effect measurements of HgTe were conducted up to 23 GPa. As the phase transites from zinc blende to cinnabar, then to rock salt, and finally to Cmcm occur, all the parameters change discontinuously. The evolution of conductivity with pressure was explained based on the variation of carrier behavior. For the zinc blende phase, the variations of carrier concentration and Hall mobility indicate the overlapped valence band and conduction band separates under pressure. The hole concentration increases with pressure and the dominant carrier changes from electron to hole, which leads to the decrease of mobility of the cinnabar phase up to 5.6 GPa and the subsequent increase with pressure. The phase transition process from zinc blende to a rock salt structure was described by the pressure-induced atomic movements. In the rock salt phase, the polar optical scattering decreases with pressure.

Reference
1 Rogach A, Kershaw S, Burt M, Harrison M, Kornowski A, Eychmüller A and Weller H 1999 Adv. Mater. 11 552 DOI:10.1002/(ISSN)1521-4095 [Cited within:1]
2 Kim H, Cho K, Song H, Min B, Lee J S, Kim G T, Kim S, Kim S H and Noh T 2003 Appl. Phys. Lett. 83 4619 DOI:10.1063/1.1631052 [Cited within:1]
3 Olk P, Buchler B C, Sand oghdar V, Gaponik N, Eychmüller A and Rogach A L 2004 Appl. Phys. Lett. 84 4732 DOI:10.1063/1.1759386 [Cited within:1]
4 Mariano A N and Warekois E P 1963 Science 142 672 DOI:10.1126/science.142.3593.672 [Cited within:5]
5 Bridgman P W 1940 Proc. Am. Acad. Art Sci. 74 24 [Cited within:1]
6 Blair J and Smith A C 1961 Phys. Rev. Lett. 7 124 DOI:10.1103/PhysRevLett.7.124 [Cited within:1]
7 Wright N G, McMahon M I, Nelmes R J and San-Miguel A 1993 Phys. Rev. B 48 13111 DOI:10.1103/PhysRevB.48.13111 [Cited within:1]
8 Werner A, Hochheimer H D, StrÖssner K and Jayaraman A 1983 Phys. Rev. B 28 3330 DOI:10.1103/PhysRevB.28.3330 [Cited within:2]
9 Huang T L and Ruoff A L 1985 Phys. Rev. B 31 5976 DOI:10.1103/PhysRevB.31.5976 [Cited within:3]
10 Ohtani A, Seike T, Motobayashi M and Onodera A 1982 J. Phys. Chem. Solids 43 627 DOI:10.1016/0022-3697(82)90052-X [Cited within:8]
11 McMahon M I, Wright N G, Allan D R and Nelmes R J 1996 Phys. Rev. B 53 2163 DOI:10.1103/PhysRevB.53.2163 [Cited within:1]
12 Briois V, Brouder Ch, Sainctavit Ph, San Miguel A, Itié J P and Polian A 1997 Phys. Rev. B 56 5866 [Cited within:1]
13 Huang T L and Ruoff A L 1983 Phys. Status Solidi A 77 K193 DOI:10.1002/(ISSN)1521-396X [Cited within:2]
14 McMahon M I, Nelmes R J, Liu H and Belmonte S A 1996 Phys. Rev. Lett. 77 1781 DOI:10.1103/PhysRevLett.77.1781 [Cited within:6]
15 Katsuki S and Kunimune M J 1971 Phys. Soc. Jap. 31 337 DOI:10.1143/JPSJ.31.337 [Cited within:4]
16 Narita S, Egawa M, Suizu K, Katayama M and Mizukami S 1973 Appl. Phys. 2 151 DOI:10.1007/BF00883977 [Cited within:1]
17 Moon C Y and Wei S H 2006 Phys. Rev. B 74 045205 DOI:10.1103/PhysRevB.74.045205 [Cited within:3]
18 Long D 1956 Phys. Rev. 101 1256 DOI:10.1103/PhysRev.101.1256 [Cited within:1]
19 Saxena A K 1980 Appl. Phys. Lett. 36 79 DOI:10.1063/1.91281 [Cited within:1]
20 Errand onea D, Segura A, Sánchez-Royo J F, Muñoz V, Grima P, Chevy A and Ulrich C 1997 Phys. Rev. B 55 16217 DOI:10.1103/PhysRevB.55.16217 [Cited within:1]
21 Boppart H and Wachter P 1984 Phys. Rev. Lett. 53 1759 DOI:10.1103/PhysRevLett.53.1759 [Cited within:1]
22 van der Pauw L J 1958 Philips Technical Review 20 220 [Cited within:1]
23 Hu T J, Cui X Y, Gao Y, Han Y H, Liu C L, Liu B, Liu H W, Ma Y Z and Gao C X 2010 Rev. Sci. Instrum. 81 115101 DOI:10.1063/1.3501384 [Cited within:1]
24 Cui X Y, Hu T J, Han Y H, Gao C X, Peng G, Liu C L, Wu B J, Wang Y, Liu B, Ren W B, Li Y, Su N N, Zou G T, Du F and Chen G 2010 Chin. Phys. Lett. 27 036402 DOI:10.1088/0256-307X/27/3/036402 [Cited within:1]
25 Hu T J, Cui X Y, Li X F, Wang J S, Yang J H and Gao C X 2015 Chin. Phys. Lett. 32 016402 DOI:10.1088/0256-307X/32/1/016402 [Cited within:1]
26 Han Y H, Luo J F, Gao C X, Ma H, Hao A M, Li Y C, Li D X, Liu J, Li M, Liu H W and Zou G T 2005 Chin. Phys. Lett. 22 1347 [Cited within:1]
27 san-miguel A, Wright N G, McMahon M I and Nelmes R J 1995 Phys. Rev. B 51 8731 DOI:10.1103/PhysRevB.51.8731 [Cited within:1]
28 Laks D B, Van de Walle C G, Neumark G F, Blöchl P E and Pantelides S T 1992 Phys. Rev. B 45 10965 DOI:10.1103/PhysRevB.45.10965 [Cited within:2]
29 Jeon D Y, Gislason H P and Watkins G D 1993 Phys. Rev. B 48 7872 DOI:10.1103/PhysRevB.48.7872 [Cited within:1]
30 Iota V and Weinstein B A 1998 Phys. Rev. Lett. 81 4955 DOI:10.1103/PhysRevLett.81.4955 [Cited within:1]
31 Errand onea D, Segura A, Martínez-García D and Muñoz-San Jose V 2009 Phys. Rev. B 79 125203 DOI:10.1103/PhysRevB.79.125203 [Cited within:1]
32 Walukiewicz W 1976 J. Phys. C: Solid State Phys. 9 1945 DOI:10.1088/0022-3719/9/10/013 [Cited within:2]
33 Lehoczky S L, Broerman J G, Nelson Donald A and Whitsett Charles R 1974 Phys. Rev. B 9 1598 DOI:10.1103/PhysRevB.9.1598 [Cited within:1]
34 Saxena A K 1981 Phys. Rev. B 24 3295 DOI:10.1103/PhysRevB.24.3295 [Cited within:1]
35 Brooks H 1951 Phys. Rev. 83 879 [Cited within:1]
36 Brooks H 1955 Advan. Electron. Electron Phys. 7 158 [Cited within:1]
37 Walukiewicz W 1974 Phys. Rev. Lett. 33 650 DOI:10.1103/PhysRevLett.33.650 [Cited within:1]
38 Aukerman L W and Willardson R K 1960 J. Appl. Phys. 31 939 DOI:10.1063/1.1735727 [Cited within:1]
39 Aspnes D E 1976 Phys. Rev. B 14 5331 DOI:10.1103/PhysRevB.14.5331 [Cited within:1]
40 Saxena A K 1982 Phys. Rev. B 25 5428 DOI:10.1103/PhysRevB.25.5428 [Cited within:1]