†Corresponding author. E-mail: mxjin@jlu.edu.cn
*Project supported by the National Basic Research Program of China (Grant No. 2013CB922200), the National Natural Science Foundation of China (Grant Nos. 11034003 and 11474129), the Research Fund for the Doctoral Program of Higher Education in China (Grant No. 20130061110021), and the Graduate Innovation Fund of Jilin University, China (Grant No. 2015091
The femtosecond filamentation in the classical and high-order Kerr (HOK) models is numerically investigated by adopting multi-photon ionization (MPI) cross section with different values. It is found that in the case that the MPI cross section is relatively small, there exists a big difference between the electron density as well as clamped intensity calculated in the classical model and those calculated in the HOK one, while in the case that the MPI cross section is relatively large, the electron density and clamped intensity calculated in the two models are nearly in agreement with each other, and under this circumstance, even if the higher-order nonlinear terms do exist, the free-charge generation and the associated defocusing in a filament are enough to mask their effects. The different behaviors of the maximum intensity and on-axis electron density at the collapse position with the pulse duration provides an approach to determine which effect plays the dominant defocusing role. These results demonstrate that it is ionization that results in the difference between the two models.
The propagation of ultrashort intense laser pulses in air has been a hot area of research due to its promising application prospects such as terahertz radiation, [1, 2] generation of white-light supercontinuum, [3– 6] rain-making, [7, 8] and lightning protection, [9, 10] etc. During the propagation of the femtosecond laser pulse in gaseous media, the self-focusing due to the second-order Kerr effect makes the laser intensity increase continuously and as the intensity increases to some value, the nonlinear defocusing effects will arrest its further increase. Intense and stable filaments will be generated as the self-focusing effect and nonlinear defocusing effects reach a dynamic balance. According to the defocusing mechanism, the filamentation model can be classified into the classical one in which the plasma is the dominant defocusing factor and the higher-order Kerr (HOK) one in which the HOK effects are the dominant defocusing factors. Although the saturation of the Kerr effects has been suggested to be a factor in laser filamentation, [11– 13] however, due to the lack of the data about the values of the HOK indices, for a long time, the classical mode (i.e., filamentation is described as a dynamic balance between Kerr self-focusing and plasma defocusing) has been generally accepted as the filamentaion model. By adopting the time-resolved birefringence method, Loriot et al. measured the values of the HOK indices of the O2, N2, and Ar for the first time, [14, 15] since then the established paradigm has been challenged. Taking the HOK effects into consideration in the theoretical investigation, different results from the classical model were obtained, [16, 17] and the most significant difference lies in the values of the clamped intensity and electron density: the clamped intensity is just half of that in the classical model, and the electron is almost two orders of magnitude lower than that in the classical model, [16] making the ionization-free filamentation possible.[18, 19]
However, comparing the nonlinear phenomena observed by the numerical simulation and experimental measurement, the results support different models.[20– 28] For instance, Kolosik et al. proposed the criteria to determine the validity of the HOK model, i.e., measuring the power ratio of fifth-harmonic (FH) to third-harmonic (TH) generation:[20] if the FH– TH power ratio remains at a relatively high value of ∼ 10− 1, the HOK model is correct; if the ratio remains very small (10− 4), the classical model is correct. Ni et al. have carried out the corresponding experiment.[21] Kosareva et al. investigated the conical emission in the two models, and found that the results obtained in classical model fit better with the experimental results.[22, 23] Wang et al. found that as HOK effects play the main defocusing role, some phenomena inconsistent with previous experiments can appear, indicating that the values of HOK coefficients are overestimated.[24] In addition, by measuring the plasma density experimentally, it is found that the measured value of plasma density is much higher than that calculated in the HOK model.[25, 26] Though considerable research has been conducted in this field, which model is more reasonable is still an open question.
The above studies suggest that the ionization of the media is the main factor that brings about the most significant difference between the classical and the HOK models. For the intensity concerning the filamentation, the electron density can be well described by multi-photon ionization MPI, and the MPI cross section is the main factor that determines the MPI process. In this paper, by adopting different values of MPI cross section, [29, 30] we investigate the filamentation process in the two models and attempt to find out the cause that leads to the difference between the two models.
The propagation of femtosecond laser pulses in gaseous medium can be described by numerically solving the following extended NLSE:

The equation applies to femtosecond laser pulses moving in their group-velocity frame (τ = t − z/vg), with central wave number k0 = 2π /λ 0 and angular frequency ω 0 = 2π c/λ 0. The first term on the right-hand side accounts for the transverse diffraction, and the remaining terms refer to the normal GVD with the coefficient k' ' = ∂ 2k/∂ ω 2 | ω 0. Kerr effects of air with the nonlinear refractive indices n2q (i.e., Kerr indices) and the plasma absorption (real part) and plasma defocusing (imaginary part) with inverse bremsstrahlung cross section σ and electron collision time τ c. The last term describes multi-photon ionization with coefficient σ K, ρ O denotes the number density of oxygen at one standard atmospheric pressure. For the oxygen whose characteristic ionization energy U is 12.1 eV and the laser pulse adopted whose central wavelength is λ 0 = 800 nm, the minimum number of photons K needed in the multiphoton ionization process is 8. The operator T ≡ 1 + (i/ω 0)∂ τ in the Kerr terms leads to self-steepening effect and T− 1 ≡ 1 − (i/ω 0)∂ τ results in space– time focusing effect.
Since the intensity during the filamentation process lies in the multi-photon regime, the evolution of electron density ρ e can be calculated through MPI
 |
and the avalanche ionization and electron recombination are omitted here due to their negligible role in filamentation. The number density of oxygen is ρ O = 5 × 1024 m− 3.
As equation (1) contains the higher-order Kerr (HOK) terms, it refers to the HOK model, while as it is truncated to the second-order term, it refers to the classical model. For the values of the Kerr indices we use those of air which are measured by Loriot et al.[14, 15] i.e., n2 = 1.2 × 10− 23 m2/W, n4 = − 1.5 × 10− 41 m4/W2, n6 = 2.1 × 10− 58 m6/W3, and n8 = − 0.8 × 10− 75 m8/W4. In this paper, we select a Gaussian pulse whose envelope can be written as 
Firstly, it should be noted that the value of MPI cross section measured or calculated has great uncertainty, even different values can be obtained by the same group.[29– 32] To investigate the influence of the uncertainty of the MPI cross section’ s value on the two models, we select two extreme values of MPI cross section for the ionization of oxygen with 800-nm pulses which are used by Couairon et al.: σ 8 = 2.88 × 10− 99 s− 1 · cm16 · W− 8[29] and σ 8 = 2.81 × 10− 96 s− 1 · cm16 · W− 8.[30] Figures 1(a) and 1(b) present the maximum intensity and on-axis electron density during the propagation, as the MPI cross section is σ 8 = 2.88 × 10− 99 s− 1 · cm16 · W− 8. It can be seen from the figure that as the HOK effect is considered, the maximum intensity calculated is less than half of that calculated in the classical model (see Fig. 1(a)), and the on-axis electron density is two orders of magnitude lower than that calculated in the classical model (see Fig. 1(b)), which is identical to the results in Ref. [16]. It can also be seen from Figs. 1(a) and 1(b) that the filament length is much longer as HOK effects are considered, which can be attributed to the fact that plasma density is much lower in the HOK model as the MPI cross section is smaller, and thus less energy is depleted during the ionization of gas, as a result, the filament can sustain a longer distance. In contrast, as the larger MPI cross section is used, i.e., σ 8 = 2.81 × 10− 96 s− 1 · cm16 · W− 8, quite different results will be obtained: as is shown in Figs. 1(c) and 1(d), the electron density and clamped intensity calculated in the two models are nearly in agreement with each other, therefore we can say that the HOK effects are masked by the plasma effect, in which case, the two models cannot be distinguished only from the aspect of intensity and electron density. In the previous theoretical investigation, [16] the difference of electron density and clamped intensity between the two models may be attributed to the fact that the ionization rate is underestimated. Particularly, Chen et al. have carried out the direct time- and space-resolved measurements of the electron density in filaments, [26] and the electron density is much larger than that calculated in the HOK model and quite close to that calculated in the classical model, which further confirms the above conclusion. As a result, to illustrate the filamentation mechanism more clearly, more accurate methods to calculate the ionization rate need developing.
 | Fig. 1. Evolution of the maximum intensity (a) and on-axis electron density (b) with the propagation distance z, as the MPI cross section is σ 8 = 2.88 × 10− 99 s− 1 · cm16 · W− 8; [29] evolution of the maximum intensity (c) and on-axis electron density (d) with the propagation distance z, as the MPI cross section is σ 8 = 2.81 × 10− 96 s− 1 · cm16 · W− 8.[30] |
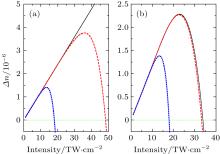
The phenomena described above can be well explained from the aspect of refractive index. As is known, the contribution of the second-order Kerr effect to the nonlinear refractive index is positive, i.e., Δ nKerr ≈ n2I > 0, making the intensity increase before the pulse collapses. Correspondingly, the plasma density will become increasing more in the classical model or the HOK effects will become stronger at the same time, whose contribution to the nonlinear refractive index is negative, where the total nonlinear refractive index can be approximatively estimated by

 |
where ρ e is the density of the free electron which can be roughly estimated from Eq. (2): ρ e ≈ σ K IKρ Oτ p, and 
Now, we can well describe the phenomena presented in Fig. 1: in the case of smaller MPI cross section (σ 8 = 2.88 × 10− 99 s− 1 · cm16 · W− 8), since the clamped intensity calculated in the classical model is about two times larger than that of the one calculated in the HOK model (see Fig. 1(a)), according to ρ e ≈ σ KIKρ Oτ p, the electron density in the classical model is about 256 (28) times larger than that in the HOK model, which fits well with the result in Fig. 1(b). If we increase the MPI cross section, say σ 8 = 2.81 × 10− 96 s− 1 · cm16 · W− 8, for the classical model, the clamped intensity decreases and becomes close to that in the HOK model, as shown in Fig. 1(c). From ρ e ≈ σ KIKρ Oτ p we know that the electron density calculated in the two models is close to each other, which is certified by the result in Fig. 1(d). In addition, we can also see from Fig. 1 that, the collapse distances calculated in the two models are identical to each other, which is independent of the value of the MPI cross section, and the cause of this phenomena can be attributed to the fact that the second-order Kerr effect plays the dominant role in the process before the pulse collapse.
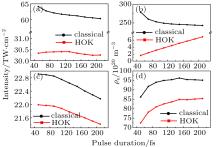
We present in Fig. 3 the evolution of the maximum intensity and on-axis electron density at the collapse position with the pulse duration. It can be clearly seen from the figure that in the case in which the HOK effects play the dominant defocusing role, the plasma density is proportional to the pulse duration [see the red squares in Fig. 3(b)], while in the case in which the plasma effect plays the dominant defocusing role, the plasma density changes a little [we can see from the black dots in Fig. 3(b) and the data in Fig. 3(d) that | ρ e(210 fs) − ρ e(50 fs)| < 20%]. We can also see from the figure that as the HOK effects play the dominant defocusing role, the clamped intensity is nearly independent of the initial pulse duration, as shown by the red squares in Fig. 3(a); while as the plasma effect plays the dominant defocusing role, the clamped intensity deceases with the increase of the pulse duration, as shown by black dots in Fig. 3(a) and the data in Fig. 3(c). These phenomena provide us with a way to determine which effect plays the dominant defocusing role.
In the strong field physics, there is such a recognition: under the action of the same laser pulse, the larger the ionization, the smaller the excitation will be, and vice versa. As it transits to the macroscopic propagation process, as the ionization is relatively large, the plasma effect is the dominant defocusing factor and masks the role of the HOK effect, while as the ionization is relatively small, the HOK effects are the dominant defocusing factors. Therefore, we can infer that the HOK effects are closely related to the excitation process, i.e., the transition between bound states.
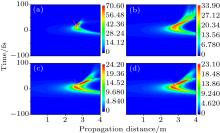
Figure 4 presents the time-evolution of the on-axis intensity along the propagation distance z I(t, z), and it can be clearly seen from the figure that the laser pulses split in the time domain shortly after their collapse (around z = 2.7 m). However, there is a difference between their temporal behaviors along the propagation distance: as the plasma effect plays the main defocusing role, the intensity of the leading part is higher than that of the tailing part, and eventually the intensity of the tailing part is higher than that of the leading part (e.g., z > 3.0 m), thus exhibiting the “ dip” structure, as shown by the pink arrows in Figs. 4(a), 4(c), and 4(d); in contrast, as the HOK effects play the main defocusing role, the intensity of the tailing part is always higher than that of the leading part, therefore, there is no “ dip” structure, as shown in Fig. 4(b). It can also be seen from Fig. 4 that the tailing part of the laser pulse will experience temporal splitting, which makes its temporal behaviors more complicated.
Our work does not intend to illustrate which filamentation model is right, for we just focus on the influence of the MPI cross section on filamentation calculated in two models. The inaccuracy of the calculation of the ionization may lead to the difference of clamped intensity and electron density in the two models. It is found that even if the higher-order nonlinear terms do exist, in the case in which the MPI cross section is relatively large, the electron density and clamped intensity calculated in the two models are nearly in agreement with each other, and consequently, the free-charge generation and the associated defocusing in a filament are enough to mask their effects. Through the analysis of the nonlinear refractive index with the plasma effect considered, the numerical results are further certified. Through the evolution of the maximum intensity and on-axis electron density at the collapse position with the pulse duration, it is found that as the HOK effects play the dominant defocusing role, along with the increase of the pulse duration, the plasma density is proportional to it and the clamped intensity nearly remains constant; while as the plasma effect plays the dominant defocusing role, with the increase of the pulse duration, along with the increase of the pulse duration, the clamped intensity deceases and the plasma density changes a little, which provides a way to determine which effect plays the dominant defocusing role. These studies demonstrate that ionization of the medium is the dominant factor that brings about the difference between the two models. Therefore, to make the results more clear, the model used to calculate the ionization needs to be modified. Only when the ionization rate or electron density is accurate, can the theoretical results fit better with the experimental ones.
| 1 |
|
| 2 |
|
| 3 |
|
| 4 |
|
| 5 |
|
| 6 |
|
| 7 |
|
| 8 |
|
| 9 |
|
| 10 |
|
| 11 |
|
| 12 |
|
| 13 |
|
| 14 |
|
| 15 |
|
| 16 |
|
| 17 |
|
| 18 |
|
| 19 |
|
| 20 |
|
| 21 |
|
| 22 |
|
| 23 |
|
| 24 |
|
| 25 |
|
| 26 |
|
| 27 |
|
| 28 |
|
| 29 |
|
| 30 |
|
| 31 |
|
| 32 |
|


