
Kinetics of protein adsorption/desorption mediated by pH-responsive polymer layer*
[Su Xiao-Hang, Lei Qun-Li, Ren Chun-Lai ]
]
]
|
|


†Corresponding author. E-mail: chunlair@nju.edu.cn
*Project supported by the National Natural Science Foundation of China (Grant Nos. 21274062, 11474155, and 91027040).
We propose a new way of regulating protein adsorption by using a pH-responsive polymer. According to the theoretical results obtained from the molecular theory and kinetic approaches, both thermodynamics and kinetics of protein adsorption are verified to be well controlled by the solution pH. The kinetics and the amount of adsorbed proteins at equilibrium are greatly increased when the solution environment changes from acid to neutral. The reason is that the increased pH promotes the dissociation of the weak polyelectrolyte, resulting in more charged monomers and more stretched chains. Thus the steric repulsion within the polymer layer is weakened, which effectively lowers the barrier felt by the protein during the process of adsorption. Interestingly, we also find that the kinetics of protein desorption is almost unchanged with the variation of pH. It is because although the barrier formed by the polymer layer changes along with the change of pH, the potential at contact with the surface varies equally. Our results may provide useful insights into controllable protein adsorption/desorption in practical applications.
Controllable protein adsorption is a sustained popular topic in modern biotechnology and biomaterials.[1– 6] For bio-compatible surfaces, biosensors, and biological catalysts, immune protein or unwanted nonspecific protein adsorption should be avoided as much as possible.[7– 11] In drug delivery systems, what is needed is a maximization of both the amount of adsorbed protein drug molecules during the process of pharmaceutical synthesis and the amount of desorbed proteins at the specific intracellular sites by drug releasing.[12– 14] At the same time, how to transport the drug carrier safely, steadily, and effectively also needs to be considered.[15] Grafting polymer layers onto the surface is a popular way to manipulate protein adsorption and that kind of surface could act as a biocompatible drug carrier.[16] Among the enormous choices, stimuli-responsive polymers are a promising candidate.[17– 19] Stimuli-responsive polymers have the ability to change their physicochemical properties when the external conditions are changed, such as temperature, pH, electric field, light, and so on.[20– 22] These distinctive properties make them competent to adsorb/desorb proteins[23] or load/release drug molecules.[16] This article will concentrate on the surface grafted by pH-sensitive polymers, since the variation of the pH value is relatively easy to implement both in vivo and in vitro.[24]
Theoretically, the thermodynamics of protein adsorption/desorption and other types of adsorption regulated by the polymer layer has been studied by the self-consistent field theory, [25, 26] the density functional theory, [27] and the Monte Carlo simulation.[28] However, the study of kinetics of protein adsorption/desorption is more imperative and challenging in practical applications. This is because protein adsorption/desorption by crossing a barrier is an activation process, which usually lasts several hours, making the computer simulation no longer a suitable method. To solve this problem, a generalized diffusion approach and a barrier-crossing kinetic approach are incorporated into a more sophisticated molecular theory (kinetic molecular theory) and both of them have been verified as the effective ways to study the dynamic process of the proteins.[29, 30] Compared with the other methods, the molecular theory has the advantage of explicitly including different conformations of the grafted chains, which is not limited to the Gaussian chain model. What is more, this theory is proven to be very successful in tacking the weak polyelectrolyte system with acid-base equilibrium, which has been verified to be in quantitative agreement with computer simulations and experimental measurements.[23]
In the present work, we use this kinetic molecular theory to investigate protein adsorption/desorption mediated by a pH-responsive polymer layer. We expect to achieve the controllable protein adsorption regulated by the pH of the solution. Furthermore, we aim to explore the different roles of each interaction and deepen our understanding of the mechanism of protein adsorption/desorption. The framework of this paper is as follows. First we present theoretical modeling for both thermodynamic and kinetics. Then we provide the relevant results to explore the main factors affecting the equilibrium and kinetics of protein adsorption/desorption. In the last section, we draw conclusions and put forward our prospects.
The system that we consider is composed of a surface of total area A spanning the x– y plane, onto which Ng weak polyelectrolytes are grafted (see Fig. 1). The monomers of the weak polyelectrolyte are ionizable moieties which can dissociate in an aqueous environment, thus the number of charged groups fluctuates to be a variable when the acidity or the ionic strength of the solution changes. For a single acid molecule AH in an aqueous environment, the dissociation can be described as a chemical reaction: AH ⇌ A− + H+ . The tethered polymer layer has a surface coverage of σ = Ng/A and each polymer chain has n segments. The polymer-grafted surface is put in contact with a protein solution at time t = 0. The proteins are dissolved in the solution with a concentration of ρ p, bulk or equivalently a chemical potential μ p, bulk. Due to the strong short-range protein– surface attraction, protein adsorption occurs although the steric repulsion resulting from the presence of the polymer layer exists. The protein we choose for study is lysozyme, which is an important enzyme with a globular shape in the treatment of many diseases. The previous work showed that the conformational change of lysozyme is little in a weak acid environment, [31] which means that lysozyme has a relatively stable structure in such conditions. Thus lysozyme can be treated as a hard sphere with a radius of 1.5 nm for the sake of simplicity of computation and discussion.[30] The experimental study revealed that the net charge of lysozyme does not change much from a neutral environment to a weak acid environment, [32] then we assume that the charge is constant and is fixed at 8e which corresponds to the experimental conditions at pH = 7 and the charge is homogeneously distributed on the surface.[33] Moreover, we do not include the conformational change before and after protein adsorption, the previous works have considered that effect, and the extension of this discussion is straightforward.[34] The solution contains monovalent salt. The monovalent salt is assumed to be completely dissociated into cations and anions. The water is also able to dissociate into protons (H+ ), hydronium ions (H3O+ ), and hydroxyl ions (OH− ). The existence of the surface induces an inhomogeneous distribution of all the molecular species, and we assume that the only inhomogeneous direction is perpendicular to the surface, that is, the z axis.
 | Fig. 1. Schematic representation of the modeled system that weak polyelectrolyte chains grafted on the surface are immersed in the protein solution, which also includes small ions: cations, anions, hydrogens, and hydroxyl groups. The big red spheres refer to big charged proteins. The wired purple spheres are undissociated weak polyelectrolyte monomers and the interspersed orange spheres are dissociated ones. The small blue spheres are ions with positive charge, and the brown spheres are ions with negative charge. The direction perpendicular to the surface is denoted by z. |
It should be mentioned that there are two very different timescales during the process of protein adsorption/desorption. One is the long timescale of the slow motion of protein crossing a barrier, which is an activation process, the other is the short timescale of the fast local motions of the polymer monomers, solvents, and ions.[30] Thus, we assume that the distributions of the polymers, solvents, and ions can get equilibrium around the larger, slower proteins. Based on the assumption, we can investigate both thermodynamic and kinetics effectively. For the whole framework of the theory, we start from the molecular theory, which gives us the whole idea of all kinds of interactions in the system, as well as the thermodynamic properties of the equilibrium state, then we move to kinetic theories.[23, 24] The free energy per unit area of the whole system is given by
 |
where W is the free energy and β = 1/kBT. The first term is the conformational entropy of the tethered polymer chains, where P(γ ) is the probability of the polymer at conformation γ . The second to the fourth terms are the translational entropies of the solvent, salt ion, and proton/hydroxyl, respectively. The μ i and 
 |
The charged compositions include the charged polymer segments, proteins, and small ions. The ρ i and qi represent the density and the charge density of the small charged ions, respectively. Given the fact of the charge neutrality of the whole system, one constraint of the system is ∫ ρ q(z)dz = 0, where the integral goes throughout the whole system. The other constraint is the incompressibility of the system, which results from the steric repulsions of different species. It can be expressed in the following form:
 |
where 〈 ϕ g(z)〉 and ϕ i(z) respectively represent the volume fractions of the polymer and the other small molecules. The integral term accounts for the proteins’ contribution to the volume fraction at position z, where the proteins locate at ɀ ′ . By minimization of the system’ s free energy, the probability of each conformation and the density profiles of all the species are determined. For details of the theory, its formulation, numerical implementation, and parameter selection, see supporting information.
As for the motion of proteins, the driving force is the gradient of the protein chemical potential. It is instructive to get the expression of the protein chemical potential at equilibrium, which is
 |
where β Umf(z) has the following form:
 |
Here Umf(z) is named as the potential of mean-force (PMF), which is the work required to bring the protein from the bulk solution to a distance z from the surface and also reflects the free energy felt by the protein resulting from all the other molecules’ interactions in the environment.[34] Based on the assumption of two very different timescales for the protein motion and the local motion of other species, the system of the polymer, solvent, and ions can be viewed as in a quasi-equilibrium state. Thus, we can write the time-dependent protein chemical potential as
 |
with the time- and position-dependent PMF of
 |
For the kinetics of the proteins, the diffusion equation[29] can be written as
 |
where we can obtain both the time- and position-dependent protein density ρ p(z; t) with the input of μ p(z, t). In order to obtain the time- and position-dependent chemical potential of protein μ p(z; t), at each time step, we need to know the distributions of the polymers and all other small molecules, the electrostatic potential, the charge densities of all the species, and the steric repulsion of the whole system. However, in most cases, we are only concerned with the amount of adsorbed proteins on the surface, which also is the dominating distribution of proteins, we can use the two-state model for simplicity. Now the proteins can be classified as two types: adsorbed on the surface and free in the solution. Based on the two-state model, the kinetics equation of protein adsorption crossing a barrier is given by[25, 30]
 |
where ρ pro, ads(t) represents the density of the adsorbed proteins on the surface, ρ pro, bulk is the free protein density in the bulk solution, and kads(t) and kdes(t) are the coefficients of proteins adsorbing and desorbing, respectively, which basically originate in the interactions between a single protein and all the other molecules. The first term on the right-hand side of Eq. (9) reflects the increase of the adsorbed proteins on the surface, while the second is the decreasing amount of the adsorbed proteins due to the desorption of the proteins. Therefore, the determination of kads(t) and kdes(t) is the key to the study of the kinetics. According to the previous works, the kinetic coefficients can be written as a function of the barrier felt by the protein during the process of adsorption/desorption, which is given by
 |
where Δ Uads(t) is the barrier of protein adsorption, which equals the difference between the maximum of PMF and the value of the bulk solution, i.e., Δ Uads(t) = Umf(z = zmax; t) − Umf(bulk). The barrier of protein desorption Δ Udes(t) is determined by the difference between the PMF at the maximum and that at contact with the surface, i.e., Δ Udes(t) = Umf(z = zmax; t) − Umf(z = 0; t). Clearly, for each time step, we need to obtain the profile of PMF, which results from the equilibrium distributions of the polymers, solvents, and ions at the given protein distribution. We should mention that the change of the updated adsorbed proteins for each time step should be small enough to ensure the convergence of the numerical calculations. On the basis of Kramer’ s theory, [25]k1 and k2 have the same form of k1 = k2 = D/(α L), where D is the diffusion coefficient. α is the width of the potential barrier at a distance kBT below the maximum, more specifically, 
In regards of protein desorption, the condition at t = 0 is that there is an amount of adsorbed proteins on the surface, while the density of free proteins in the bulk solution is zero. So the kinetic equation for desorption becomes
 |
where there is no gain term for the zero concentration of proteins in the bulk solution compared with Eq. (9). Another difference with the adsorption kinetics equation is the desorption coefficient, which now is
 |
where 
In this section, we present some representative results. The main purpose is to investigate the influence of pH on thermodynamics and kinetics of protein adsorption/desorption. For all the following calculations, the protein volume fraction of the bulk solution is fixed at ϕ pro, bulk = 0.001, and the monovalent salt concentration is chosen as ρ salt = 0.1 M. The weak polyelectrolyte has a chain length of n = 30 and the surface coverage of the grafted polymer is fixed at 0.1 nm− 2. The bulk equilibrium constant is defined as Ka = [A− ][H+ ]/[AH]. Here the dissociation constantpKa is chosen as 5, which is similar to that of the polyacrylic acid. The dielectric constant of the system is simplified as that of water, ε = ε w = 78.5.
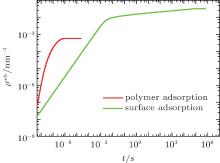
Given the fact that proteins can be adsorbed not only on the surface owing to the short-ranged protein– surface attraction but also on the polymer layer because of the electrostatic attraction between proteins and charged monomers, we first use the generalized diffusion approach to calculate the time- and position-dependent protein density of the whole system. Here we separate the surface-adsorbed proteins, ρ p(z = 0, t), from the polymer-adsorbed proteins, ∫ ρ p(z > 0, t)dz, where the integral is carried throughout the polymer layer. Figure 2 shows the kinetics of the two types of adsorption. We find that the polymer adsorption occurs within the time scale of microseconds, while the surface adsorption lasts for hours. Furthermore, the final amount of adsorbed proteins on the surface is almost two orders of magnitude larger than that on the polymer layer. It can be concluded that polymer adsorption is quick and rare while surface adsorption is much slower. Obviously, surface adsorption dominates the process of protein adsorption. Regarding the surface adsorption, it is suitable for us to use the kinetic equation (9) instead of the generalized diffusion equation (8), which increases the computer efficiency dramatically.
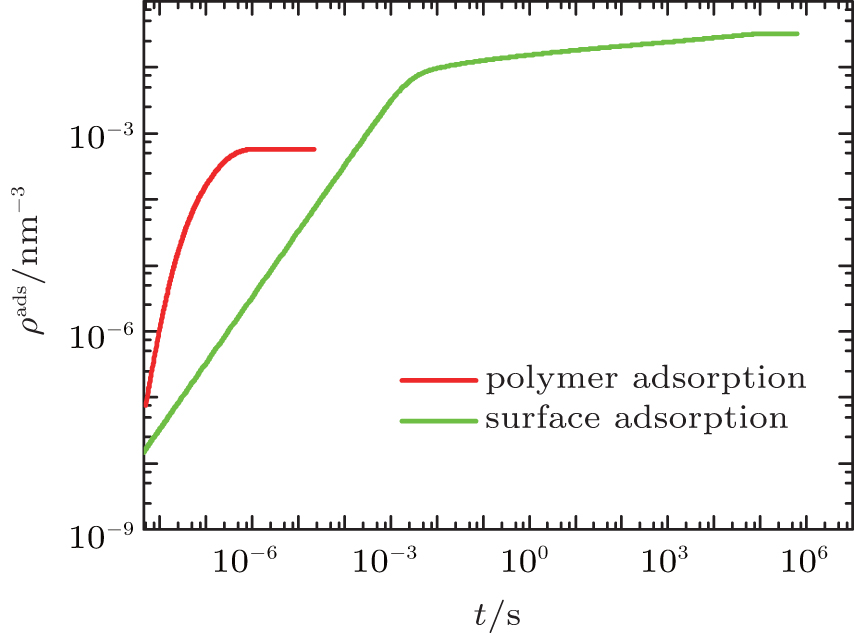 | Fig. 2. The amount of adsorbed proteins as a function of time for polymer adsorption (red) and surface adsorption (green) at the case of pH = 7. |
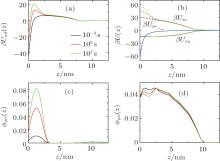
To explore the mechanism of protein adsorption, we need to analyze both the time-dependent potential felt by the protein and the time-dependent layer structure, which are correlated to determine the whole dynamic adsorption process. Figures 3(a)– 3(d) show the potentials of mean-force (PMF), different contributions to PMF, and volume fractions of protein and polymer at the early, middle, and final stages of protein adsorption, respectively. In Fig. 3(a), as we can see, during the process of surface adsorption, the positive maximum Umf(z = zmax; t) (the barrier) increases continuously, while the negative minimum close to the surface Umf(z = 0; t) decreases gradually. The minimum, Umf(z = 0; t), determines the thermodynamic amount of adsorbed proteins on the surface. While the barrier, Umf(z = zmax; t), is the key to tune the kinetics of surface adsorption. It also should be noted that there is a shallow minimum at the interface between the polymer layer and the bulk solution, which is the reason for the polymer adsorption. From the PMF, we can find why polymer adsorption and surface adsorption are so different.
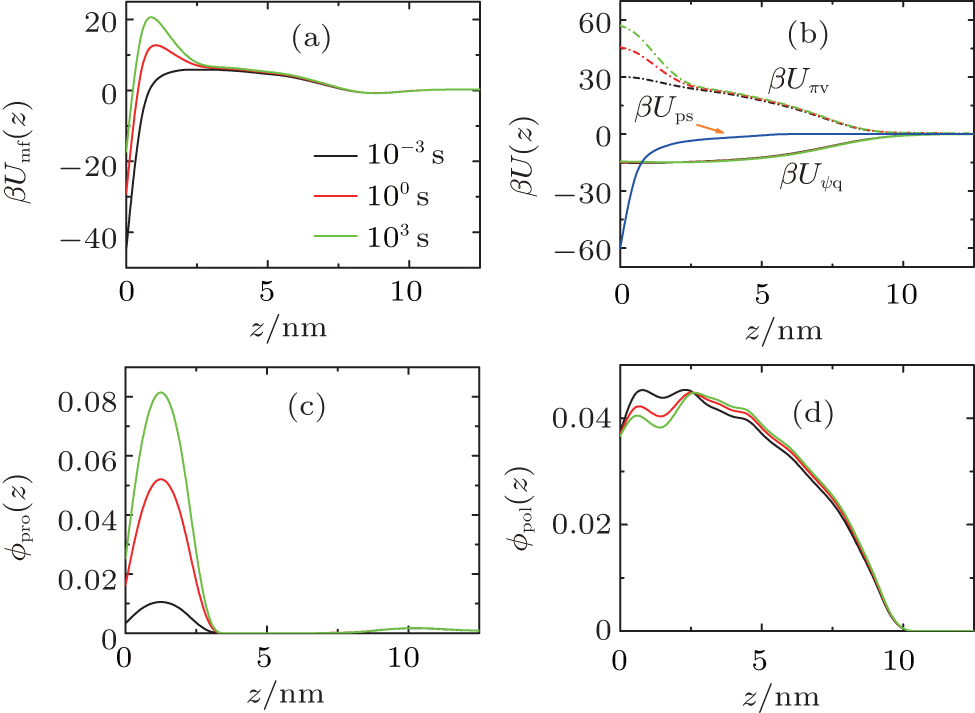 | Fig. 3. (a) Potential of mean-force (PMF), (b) different contributions to PMF: the protein-surface attraction β Ups, the steric repulsion β Uπ V, and the electrostatic attraction β UΨ q within the layer, (c) protein volume fraction and (d) polymer volume fraction as a function of position for three different stages during the protein adsorption at pH = 7. |
It should be mentioned that PMF results from all the interactions between the protein and all the other molecules in the system. What is the main factor leading to the barrier rising? To answer this question, it is necessary for us to study the different contributions to PMF. According to Eq. (7), there are three terms attributing to PMF, as illustrated in Fig. 3(b). It can be found that the increasing barrier of PMF mainly comes from the increment of the steric repulsion within the layer. As the amount of adsorbed proteins increases, the free room close to the surface decreases and the steric repulsion within the layer goes up. Meanwhile, the structure of the layer changes accordingly. The volume fractions shown in Figs. 3(c) and 3(d) reflect that, with the increase of adsorbed proteins on the surface, the local polymer monomers are repelled to avoid the strong steric repulsion.
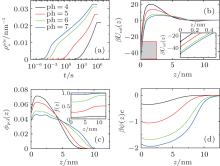
So far we have only studied the condition of pH = 7. Considering the fact that the dissociation degree of the grafted chains can be changed by the variation of pH, we expect that the kinetics of surface adsorption can be tuned by the controllable barrier. In Fig. 4(a), we present the number of adsorbed proteins as a function of time under different acid environments. From pH = 4 to 7, both thermodynamics and kinetics of surface adsorption increase dramatically. Figure 4(b) shows PMF formed by the polymer layer at four different pH levels at the beginning of protein adsorption. It can be seen that, from pH = 4 to 7, the positive barrier decreases as well as the minimum at the surface. When the pH is reduced, the dissociation degree of the polymer segments becomes higher, as illustrated in the inset of Fig. 4(c). There are more negative-charged groups on the polymer chains, the stronger electrostatic repulsion among charged segments makes the chains swell, as shown in Fig. 4(c), which implies the weakened steric repulsion within the layer. At the same time, figure 4(d) indicates that the electrostatic attraction between the negative-charged polymer segments and the positive-charged proteins becomes stronger. Therefore, they are the two main factors leading to the decline of both the maximum and the minimum of PMF, with the increase of pH, the proteins can more easily cross the barrier, and the final adsorbed amount at the equilibrium gets bigger. It should be mentioned that for the condition of pH = 7, as indicated in the inset of Fig. 4(c), the dissociation degree of the polymers is close to 1.0, which means that the segments are completely dissociated or charged. Thus if the pH is further increased, the change of thermodynamics and kinetics of protein adsorption can be ignored.
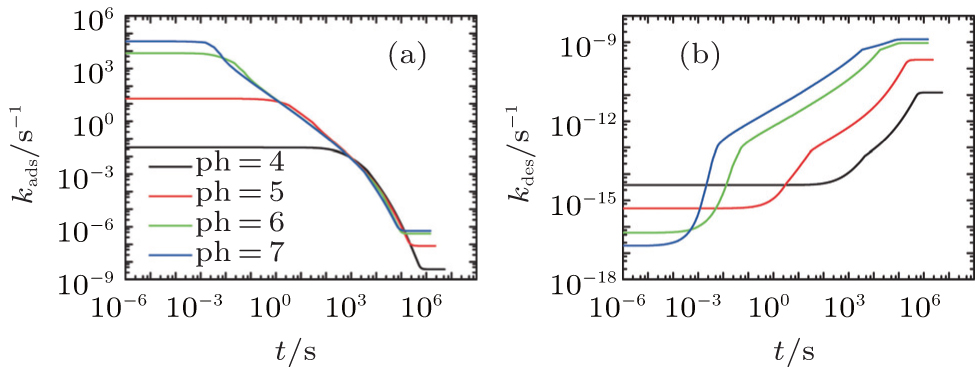
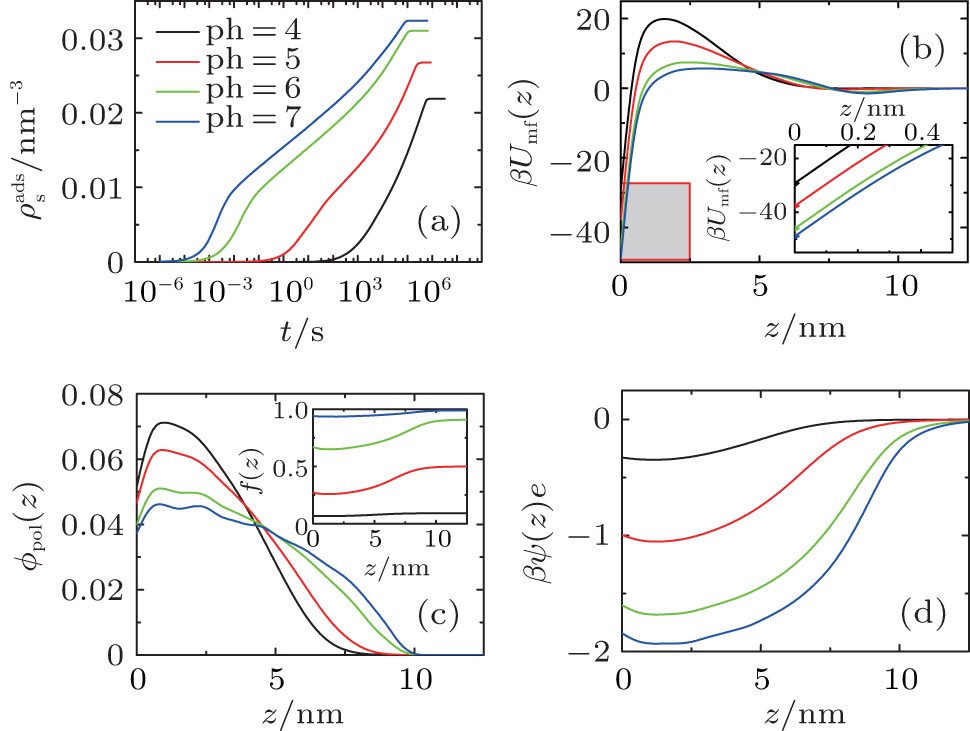 | Fig. 4. (a) The amount of adsorbed proteins during the process of protein adsorption, (b) potentials of mean-force in the initial state before surface adsorption, the inset is the local enlarged profile at the adjacent area (the grey box) of the surface, (c) volume fractions of grafted polymers, the inset is the dissociating fraction of the polymer, and (d) dimensionless electrostatic potentials within the layer for four different pH cases. |
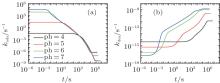
On the other hand, the effect of pH on thermodynamics and kinetics of protein adsorption is reflected by the change of adsorption and desorption coefficients as a function of time. Figures 5(a) and 5(b) show kads(t) and kdes(t) for four different pH cases, respectively. It can be seen that kads(t) is several orders of magnitude larger than kdes(t) during the course of protein adsorption, which is shown in Eq. (10). For example, kads(0) and kdes(0) equal around k1exp[− 6] and k2exp[− 49] respectively at pH = 7. With the time going on and the adsorbed proteins increasing, kads(t) goes down while kdes(t) goes up, till the protein adsorption finishes at kads(t) = kdes(t). Clearly, kads(t) plays the dominant role during the course of protein adsorption. So the the height of the barrier is the most important factor affecting the kinetics. From pH = 4 to 7, Umf(z = zmax; t) decreases, as shown in Fig. 4(b), which determines the increasing adsorption coefficient. Therefore, the kinetics of protein adsorption is increased.
 | Fig. 5. (a) The adsorption coefficient and (b) the desorption coefficient as a function of time. All the parameters are the same to those in Fig. 4. |
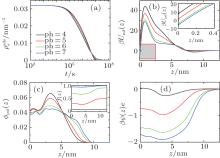
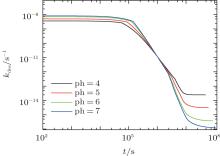
Similarly, we investigate the influence of pH on the protein desorption. However, the desorption is quite different from the situation of adsorption. Figure 6(a) shows that changing pH has no obvious effect on the desorption process. Different from the adsorption case, the desorption rate depends on the difference between the maximum and the minimum of PMF, that is Δ Udes(t) = Umf(z = zmax; t) − Umf(z = 0; t). From pH = 4 to 7, as shown in Fig. 6(b), the whole PFM profile goes down, thus not only the maximum value of the barrier but also the potential at contact with the surface decrease. Figures 6(c) and 6(d) tell us that the change of PMF is caused by the different dissociation degree of polymer. But the key point of the desorption independent of pH is that, Δ Udes(t), the difference between maximum and minimum of PMF, is almost unchanged with the change of pH. More specifically, at the beginning of desorption, Δ Udes(0) = 37.45kBT for the case of pH = 4, Δ Udes(0) = 37.12 kBT for pH = 5, Δ Udes(0) = 36.78 kBT for pH = 6, and Δ Udes(0) = 36.63 kBT for pH = 7. It can be concluded that the difference on kdes(0) for these four cases is small. Just as Fig. 7 shows, the distinct difference on kdes(t) for different pH cases can be seen only at the end of the process of protein desorption. However, the amount of the adsorbed proteins is so small at that time. So the influence of the difference on kdes(t) on the desorption isotherm is very limited. Another obvious difference between protein adsorption and desorption is that the kinetics of desorption is much slower than that of adsorption. The reason is that for an adsorbed protein leaving from the surface, it not only needs to overcome the barrier formed by the polymer layer, but also needs to resist the surface attraction; while for a free protein which is to adsorb onto the surface, it just needs to overcome the barrier.
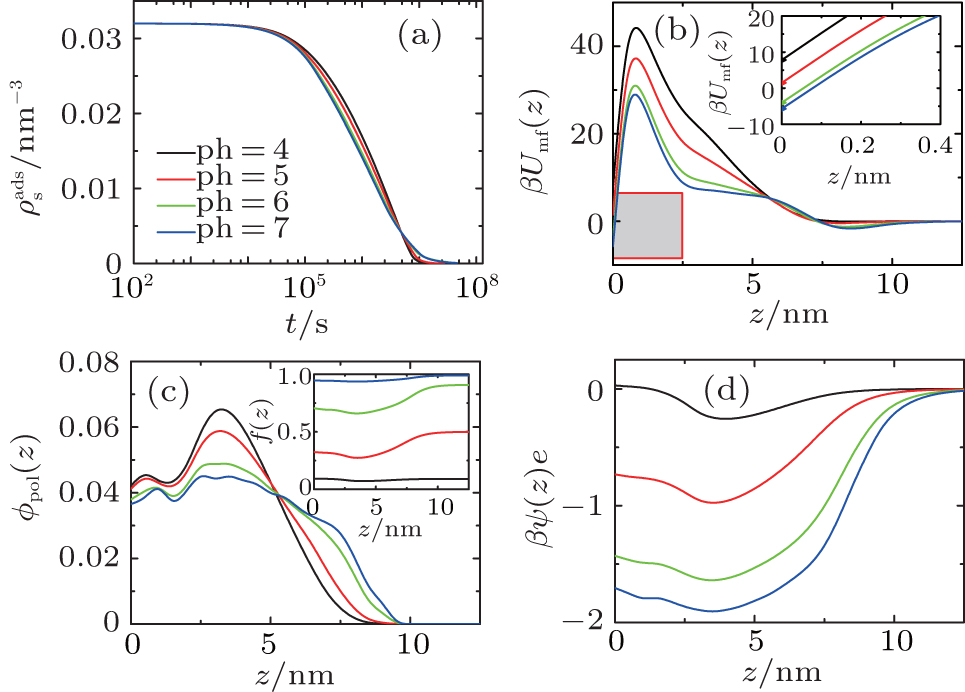 | Fig. 6. (a) The amount of adsorbed proteins during the process of protein desorption, (b) potentials of mean-force in the initial state before surface adsorption, the inset is the local enlarged profile at the adjacent area (the grey box) of the surface, (c) volume fractions of grafted polymers, the inset is the dissociating fraction of the polymer, and (d) dimensionless electrostatic potentials within the layer for four different pH cases. |
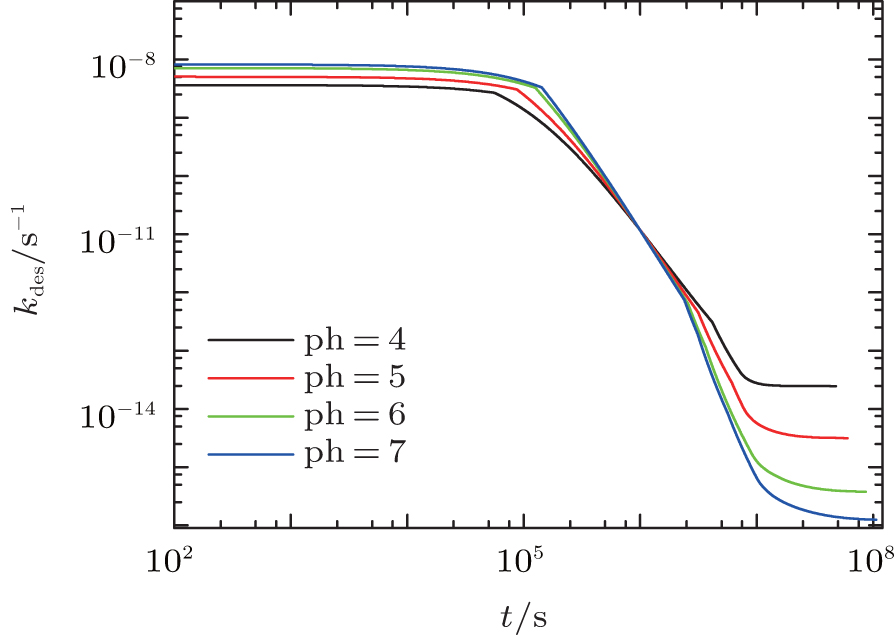 | Fig. 7. The desorption coefficient as a function of time. All the parameters are the same as those in Fig. 6. |
We use the molecular theory, accompanied by the generalized diffusion approach and the barrier-crossing kinetic approach, to perform a systematic study of the thermodynamic and kinetic properties of protein adsorption/desorption. We find that changing the solution’ s pH could alter the barrier felt by the protein during the process of adsorption, that is an effective way to tune the kinetic process of protein adsorption. However, it is verified that the desorption is not regulated by pH since the difference between the maximum and the minimum of PMF is almost constant with the variation of pH. With regard to the thermodynamics, it is determined by all the interactions including the protein– surface attraction, the electrostatic interaction, and the steric repulsion. However, the change of the steric repulsion aroused by the variation of pH is the main factor affecting the process of protein adsorption/desorption.
It is also necessary to mention that there are still some limitations in the present work. First, we do not include the possibility of counter-ion condensation on the polymer chains, which affects the extension of the polymer layer and the steric repulsion within the layer. Furthermore, the specific structure and the change of the conformations of the protein is not included. These issues will be dealt with in our further works. However, the present work gives us the fundamental understanding of the effect of pH on the thermodynamic and kinetics of protein adsorption and desorption mediated by the weak polyelectrolyte layer, which is useful for related pH-responsive systems.
We are grateful to the high performance computing center of Nanjing University for doing the numerical calculations on its IBM blade cluster system. We benefitted a lot from the insightful discussions of Dr. Feng Chao and Dr. Feng Jia-Wei throughout the different stages of this work, we greatly appreciate their capable assistance.
| 1 |
|
| 2 |
|
| 3 |
|
| 4 |
|
| 5 |
|
| 6 |
|
| 7 |
|
| 8 |
|
| 9 |
|
| 10 |
|
| 11 |
|
| 12 |
|
| 13 |
|
| 14 |
|
| 15 |
|
| 16 |
|
| 17 |
|
| 18 |
|
| 19 |
|
| 20 |
|
| 21 |
|
| 22 |
|
| 23 |
|
| 24 |
|
| 25 |
|
| 26 |
|
| 27 |
|
| 28 |
|
| 29 |
|
| 30 |
|
| 31 |
|
| 32 |
|
| 33 |
|
| 34 |
|
| 35 |
|