

Spatiotemporal distribution characteristics and attribution of extreme regional low temperature event
[Feng Tai-Chena) , Zhang Ke-Quana) , Su Hai-Jingb) , Wang Xiao-Juana), b) , Gong Zhi-Qiang†c)  , Zhang Wen-Yu
a) ]
, Zhang Wen-Yu
 , Zhang Wen-Yu
†Corresponding author. E-mail: gzq0929@126.com
*Project supported by the National Natural Science Foundation of China (Grant No. 41305075), the National Basic Research Program of China (Grant Nos. 2012CB955203 and 2012CB955902), and the Special Scientific Research on Public Welfare Industry, China (Grant No. GYHY201306049).
Based on an objective identification technique for regional low temperature event (OITRLTE), the daily minimum temperature in China has been detected from 1960 to 2013. During this period, there were 60 regional extreme low temperature events (ERLTEs), which are included in the 690 regional low temperature events (RLTEs). The 60 ERLTEs are analyzed in this paper. The results show that in the last 50 years, the intensity of the ERLTEs has become weak; the number of lasted days has decreased; and, the affected area has become small. However, that situation has changed in this century. In terms of spatial distribution, the high intensity regions are mainly in Northern China while the high frequency regions concentrate in Central and Eastern China. According to the affected area of each event, the 60 ERLTEs are classified into six types. The atmospheric circulation background fields which correspond to these types are also analyzed. The results show that, influenced by stronger blocking highs of Ural and Lake Baikal, as well as stronger southward polar vortex and East Asia major trough at 500-hPa geopotential height, cold air from high latitudes is guided to move southward and abnormal northerly winds at 850 hPa makes the cold air blow into China along diverse paths, thereby forming different types of regional extreme low temperatures in winter.
Under the background of global warming, the temperatures in most areas of China and even Asia display a significant upward trend, and the low temperature days in most areas of Northern China present a marked decreasing trend.[1– 5] In the last 50 years, low temperature events in winter have generally reduced. In particular, since the mid-1980s the frequency of low temperature events around 40° N in China has decreased obviously. However, since 2000 the frequency and intensity of low temperature events have been higher than those in the 1980s and 1990s. Particularly, in winter 2007 and 2008 of East Asia, a wide range of continuous low temperature weather occurred in Southern China, which had a tremendous influence on the economy and society.[6– 9] In addition, in winters between 2010 and 2011, between 2011 and 2012, as well as between 2012 and 2013, low temperature events with maximum duration, coverage area, and losses occurred in East Asian areas, which increases in the frequency of abnormal low temperature events in East Asia.[10, 11] Therefore, a study of low temperature events in winter (especially extreme low temperature events) has attracted a number of researchers.
Research on extreme climate events develops from extreme value analysis of stations or grid points to both spatiotemporal characteristics. Some new concepts have been proposed, such as spatial and temporal mass extreme events, [12, 13] regional events, [14, 15] etc. Generally, regional low temperature events (RLTEs) are wide in space range and high in intensity, and they last a long time, which causes enormous casualty loss. There are certain similarities between this type of event and a cold air or cold wave, such as low temperature, abnormal impacted area, etc. Nevertheless, there are differences between them: the eruption of a cold wave lasts 1 to 2 days and the falling temperature in the cooing process rises gradually, while RLTEs last a relatively long time (more than 30 days at maximum) and these events include many processes of cold wave or cold air.[16– 18] The occurrence of RLTEs is likely to experience various cooling processes. For example, low temperature events are probably caused by cold wave at the very start, and they continue to occur due to cold air, or the temperature slowly drops down to the standard of continuous low temperature. Therefore, the physical mechanism of RLTEs probably has different characteristics from the processes of cold wave or cold air.
For the detection, analysis, and research on RLTEs, Gong et al., [19] developed an objective identification technique for regional events (OITRLTEs), [20] improved and generated an objective identification technique for regional extreme low temperature events, and established corresponding RLTE database. From spatial distribution and temporal variation tendencies, Ren et al., [20] Zhao et al., [21] and Wang et al.[22] studied the spatial and temporal variation characteristics of RLTEs and revealed their overall variation trend in the last 50 years. The extreme low temperature events (ERLTEs) were identified and classified into six types, according to the spatial distributions of these events, that is: nationwide style, east style, northeast– north China style, north– south China style, south style, and northwest– South China style. The circulation backgrounds of different styles of low temperature events were also analyzed.[23– 26] Zhang and Qian, [27] by means of physical decomposition of air variable, [28] found synoptic scale disturbing signals which indicate extreme events, and they also studied the early signals of RLTEs in winter in China. Bueh et al.[29] analyzed the typical large-scale circulation characteristics of RLTEs in winter in China, and argued that a pair of trough and ridges of Eurasian scale, located at the middle troposphere and leaning towards northeast– southwest direction, is an important circulation mode of RLTEs in winter in China. Zhao et al., [30] Gong et al., [31] and Kistler et al.[32] studied the relationship between abnormal configuration of Eurasian key areas at 500-hPa geopotential height and RLTEs in winter in China. In addition, there were some other international studies about regional events at low temperature. Zhou et al.[33] studied the extreme characteristics and the climate background on low temperature sleet weather in the south of China from January to February in 2008. Shulski[34] did some research on the spatiotemporal evolution characteristics of RLTEs which lasted 37 days in winter in Alaska. But international to identify the RLTEs still use the traditional temperature anomaly. There is relatively less research of the objective identification technique.
In researching the intensity of RLTEs, previous studies have measured he duration, influencing area, accumulated intensity, and integrated index. RLTEs can be divided into different grades, that is: extreme, severe, moderate, and minor. At present, most research focuses on analyzing the overall spatial and temporal evolution characteristics and causes of RLTEs, and those that have enormous influence on society and the economy mainly refer to ERLTEs, similar to the low temperature event in the winter of 2008. Thus, it is essential to select the ERLTEs from broad regional low temperature events (RLTEs) and study them separately. On the one hand, the spatial and temporal evolution characteristics of these events (ERLTEs) are analyzed. On the other hand, the possible causes forming these events are analyzed from an external intensity and circulation background, which helps to understand some new features of RLTEs. In the present paper, we carry out preliminary studies into this problem. Our materials and methods are discussed in Section 2, and the temporal evolution characteristics and spatial distribution of extreme low temperature events are given in Section 3. The differences between circulation backgrounds corresponding to the frequency of extreme low temperature events are mainly presented in Section 4. The corresponding relation between different blocking high distribution types and extreme low temperature events is demonstrated in Section 5. Finally, the main summary and relevant discussion are given in Section 6.
The daily minimum temperatures at 731 stations are adopted in this paper, which is a quantity controlled and issued by National Meteorological Information Center (between November and March in the following year during the period from 1960 to 2013). Considering the problem of missing data, 35 stations with relatively high defect detection rate are eliminated and, in fact, there are 696 stations to be analyzed. NCEP/NCAR daily height field and wind field are used to analyze circulation background, with a horizontal resolution of 2.5° × 2.5° and a vertical resolution of 17-layers. The monthly sea surface temperature (SST) from 1961– 2010 is derived from the data set of NOAA ERSST, [35] with a resolution of 2° × 2° .
The RLTEs are identified by using the objective identification technique for regional extremely low temperature events, which are developed by Ren et al.[20] The method is used for: 1) determining the thresholds of extreme low temperature; 2) identifying the regions of extremely low temperature events; 3) extracting a continuous process of the regions; and, 4) establishing an index system. The regions of extremely low temperature events, and the coincident information about temporary events and low temperature belts are identified sequentially, and finally the information is integrated so that extremely low temperature events of continuous process can be identified objectively.
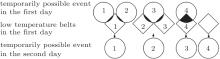
In this study, the daily minimum temperature data cover the period from November to the next March during the period of 1971– 2000. The threshold value of extremely low temperature events is determined based on the percentile. 5% of the temperature value is considered as the threshold value of extremely low temperature. The weather chart analysis method is improved to identify the space domain of the daily extremely low temperature events and the information combination of temporary events and low temperature belts (Fig. 1). The RLTE is adopted to identify daily minimum temperatures during the period from 1960 to 2013, and 690 regional low temperature events are detected.
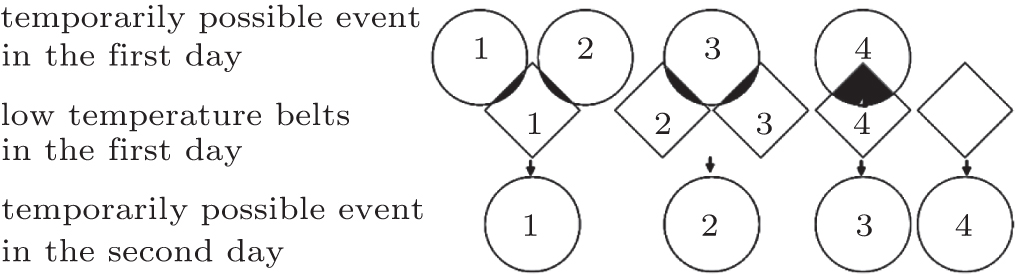 | Fig. 1. Information combination of temporal possible events and low temperature belts. Circle denotes the temporal possible events, diamond denotes the low temperature belts, and shadow denotes the overlapped part between temporal possible events and low temperature belts. |
Regional low temperature events include both spatial and temporal characteristics, so we take two indicators to identify them: the first indicator is process amount, the second indicator is daily variation. The second indicator is mostly used to describe the daily evolution of a regional low temperature event, including the daily process extreme value (Qd), daily accumulated process intensity (Ld), daily accumulated influenced area (Ad), daily maximum influenced area (Amax). The integrated index (Zd) includes all of these three kinds of characteristics, and is expressed as follows:


Here, j represents the station which reaches the daily threshold of low temperature events, 


where d is the day that the event happened; and, e1, e2, e3, e4, and e5, are weight coefficients. By normalizing single indices and combining them with economic losses and affected population caused by low temperature disasters, after repetitive calculation and detection, the values of weight coefficients e1, e2, e3, e4, and e5 are determined to be – 0.21, – 0.18, 0.15, 0.22, and 0.24, respectively.
We mentioned in Subsection 2.2 that 690 regional low temperature events are detected during the period from 1960 to 2013. Abnormally extreme events have taken place six times in the last 60 years, and if 10% is rated as a criterion of dividing these events, ERLTEs that have had a considerable integrated influence have occurred 60 times. The common characteristics of 60 ERLTEs are wide influenced area, long duration, high intensity, as well as enormous influences over society and the economy. The annual average variation characteristics of ERLTE indices are shown in Fig. 2.
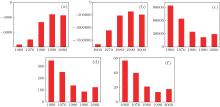
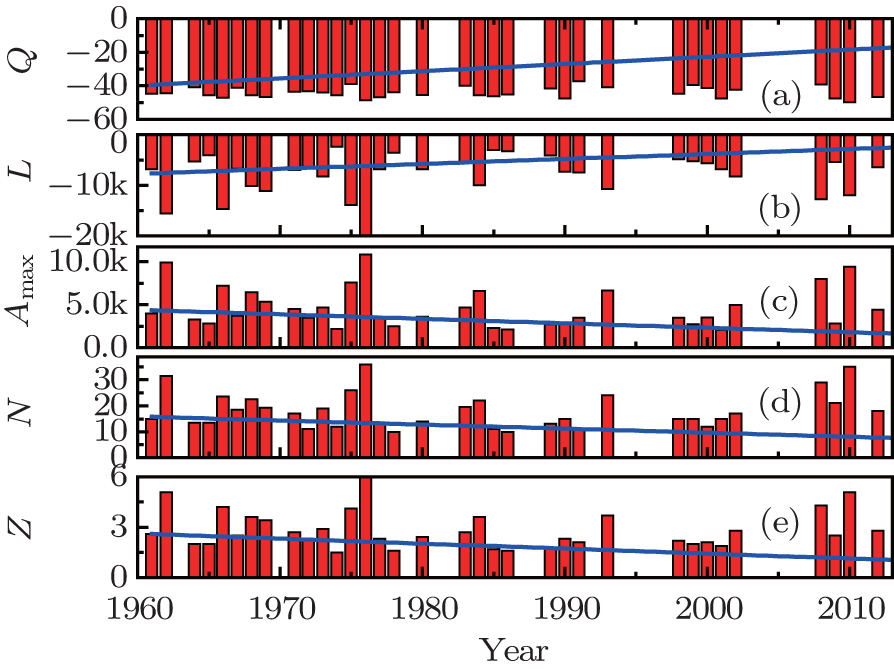 | Fig. 2. Annual variation trends of ERLTE (strong event) indices (1961– 2013), showing (a) extreme intensity index, (b) accumulated intensity index, (c) accumulated influenced area index, (d) duration index, and (e) integrated index. |
It can be seen that the extreme intensity and accumulated intensity of ERLTEs generally present a downward trend (indices are negative values, and the smaller the values, the higher the intensities of these events are, so the intensities fall as the indices rise), but the tendency of former is relatively weak. Meanwhile, the accumulated influenced areas, durations, and integrated indices of ERLTEs each display a downward tendency. Therefore, ERLTEs have been decreasing overall since 1961. Nonetheless, it is worthwhile noting that the frequency of ERLTEs increased to some extent around the year 2010 and these events took place frequently between 1960s and 1970s, in the mid-1980s, and around 1990, 2000, and 2010.
The decadal accumulated variation characteristics of regional extreme low temperature event indices (namely total indices of decadal extremely low temperature events) are given in Fig. 3. Our results show that from the 1960s the intensity, influenced area, and duration of the regional extreme low temperature events in China present an overall decreasing trend, but in the first 10 years of the twenty-first century the accumulated indices of these events varied significantly and comprehensively. Since the 2010s, extremely low temperature events have taken place frequently in winter, which indicates that China is likely to enter into an increasing stage of extremely low temperature events, providing a reference for future studies and a prediction of extremely low temperature events in winter.
 | Fig. 3. Decadal accumulated variation of ERLTE indices (1961– 2013), showing (a) extreme intensity index, (b) accumulated intensity index, (c) accumulated influenced area index, (d) duration for annual average index, and (e) integrated index. |
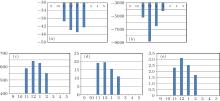
Most of the ERLTEs concentrate in winter. In order to study the evolution processes of ERLTEs better, the monthly accumulated distributions of 60 ERLTE indices between 1961 and 2013 are given in Fig. 4. It is shown that ERLTEs mainly took place between November and February of the following year. Among 60 ERLTEs, there were two events in November, 23 in December, 30 in January, and five in February. In terms of each index, both the extreme intensities and accumulated intensities of these events in December and January are obviously higher than those in other months.
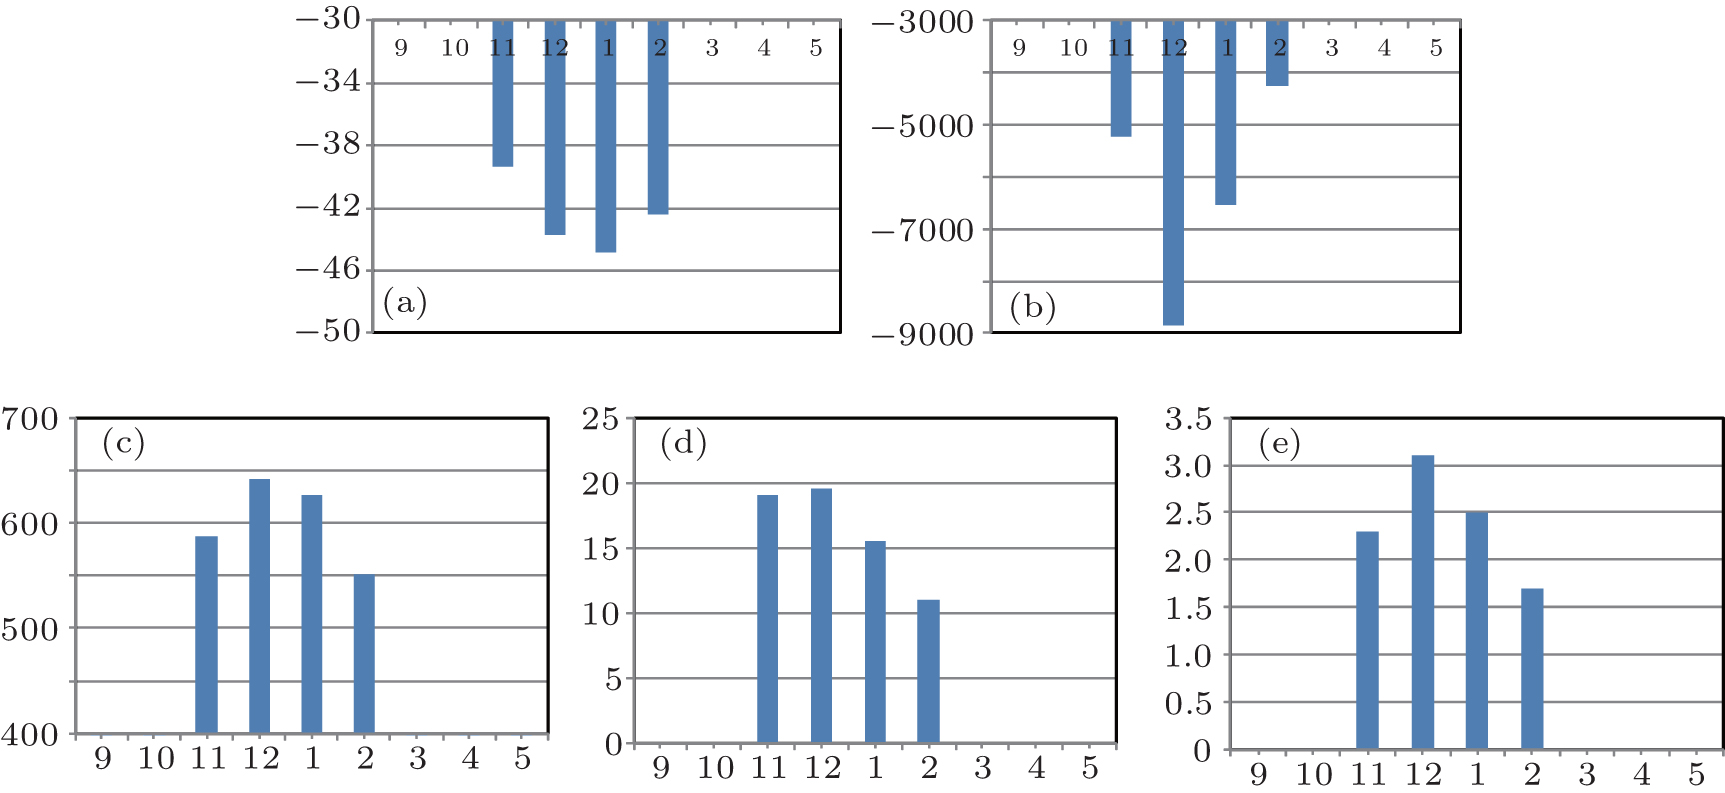 | Fig. 4. Monthly accumulated variation trends of ERLTEs (1961– 2013), showing (a) extreme intensity index, (b) accumulated intensity index, (c) accumulated impacted area index, (d) duration index, and (e) integrated index. |
The temporal evolution characteristics of ERLTEs have been analyzed above, but there are enormous differences between the southern and northern parts of China, the mechanisms for producing low temperature events at different latitudes are diverse, and the intensities and durations of ERLTEs are also distinct, so it is essential to effectively study the spatial distributions of nationwide ERLTEs.
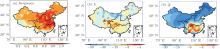
The spatial distributions of indices of 60 ERLTEs with maximum integrated index values between 1961 and 2013 are shown in Fig. 5. The frequency distributions of ERLTEs at nationwide stations between 1961 and 2013 are given in Fig. 5(a), where it is shown that these events mainly occurred in central and eastern parts of China, which have a great influence on our national economy and society, with a wide area of influence and high frequency. The accumulated intensity distributions of ERLTEs at all stations between 1961 and 2013 are shown in Fig. 5(b), where it is shown that the regions with higher accumulated intensity are mainly located in the northern part of China, especially in the northern Northwest, Inner Mongolia, and central Northeast, which are affected by regional extremely low temperatures for a longer time. Meanwhile, the extreme intensity distributions of ERLTEs at all stations between 1961 and 2013 are shown in Fig. 5(c), where it is shown that the strongest low temperature events take place in eastern part of Inner Mongolia and northern Northeast, indicating that the highest intensities of strongest low temperature events in these areas.
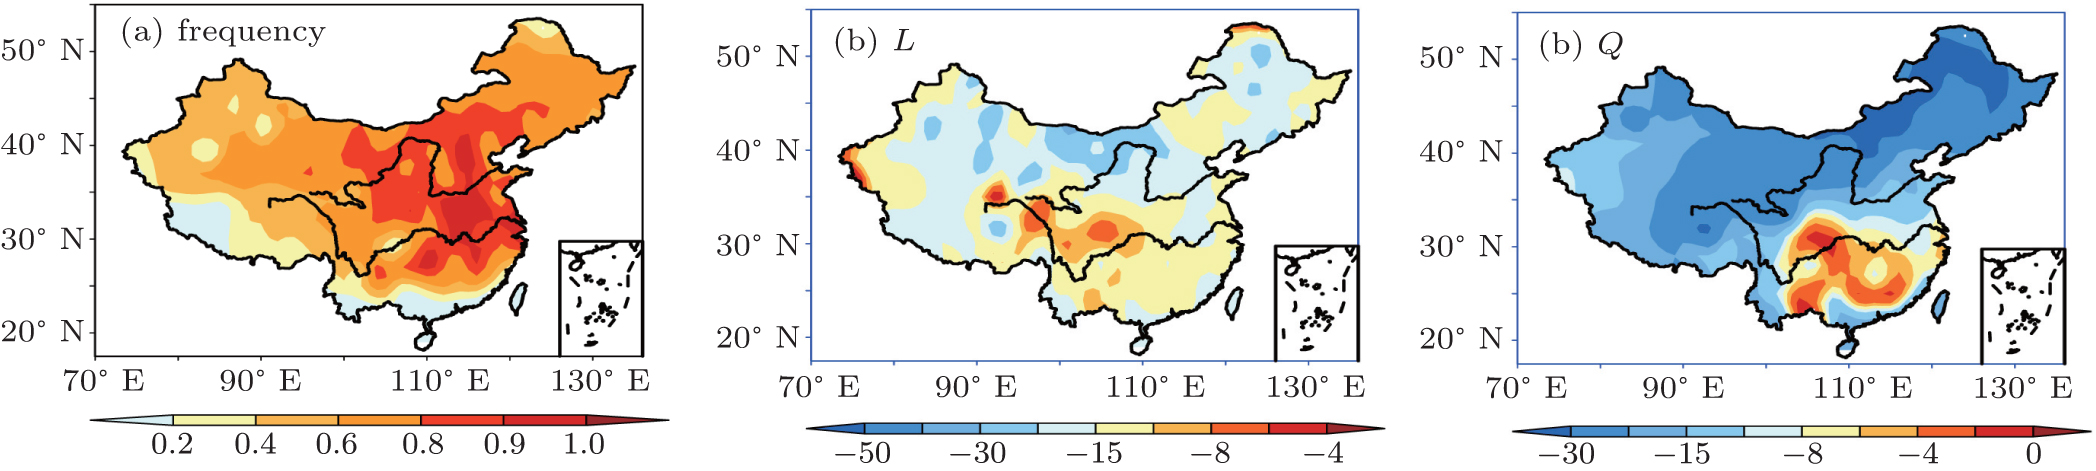 | Fig. 5. Station frequencies of 60 ERLTEs with maximum integrated index values (1961– 2013), showing (a) accumulated intensity index, (b) extreme intensity index, and (c) space diagram of index. |
In accordance with the maximum influenced areas of the 60 events, we first select the six different types of events. We then calculate the ACC between the six events and others, in order to obtain the most correlated events for each type of ERLTEs. In this way, 60 ERLTEs with maximum integrated index values[36, 37] can be divided into six types (as shown in Fig. 6), including: 19 National events, 15 East events, five Northeast– North China events, seven North China– South China events, three North events, and ten Northwest– South China events.
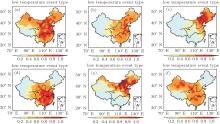
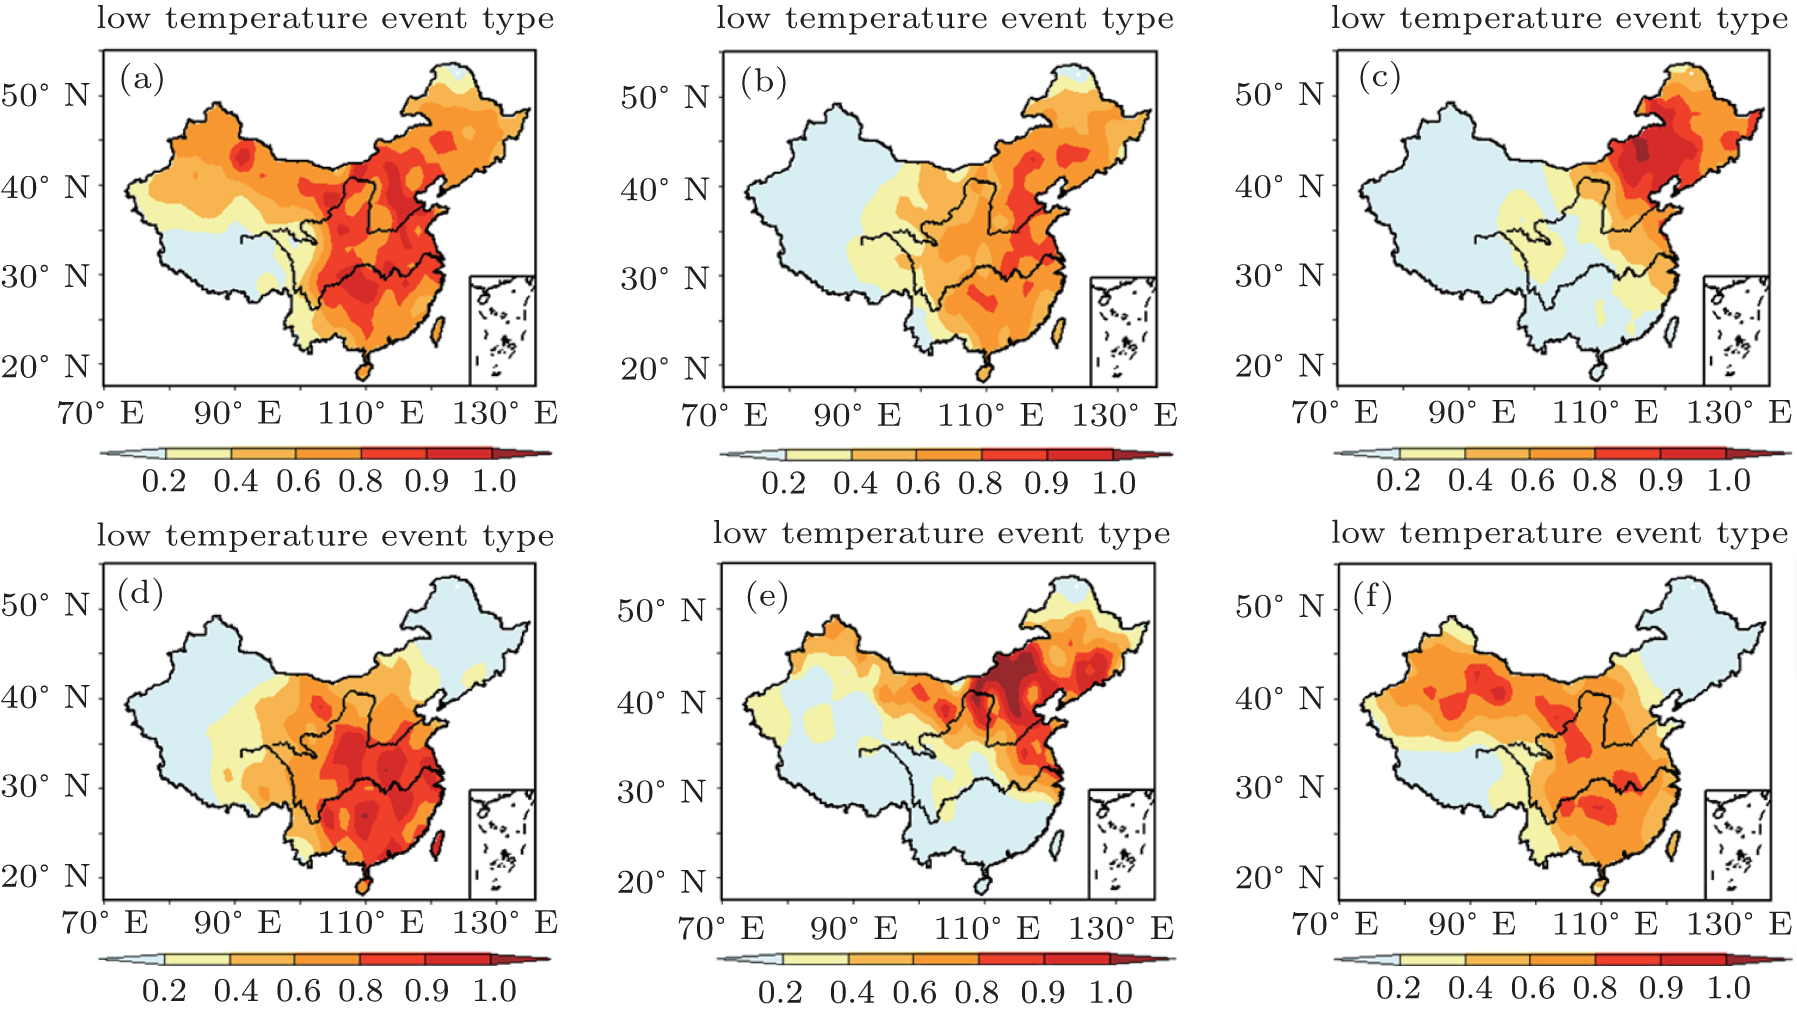 | Fig. 6. Classification of 60 ERLTEs with maximum integrated index values, showing. (a) National event, (b) East event, (c) Northeast– North China event, (d) North China– South China event, (e) North China event, and (f) Northwest– South China event, where colors symbolize the relative frequencies of ERLTEs of stations. |
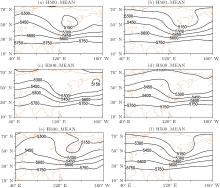
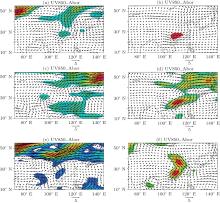
To better analyze the six types of ERLTEs in this subsection. Figures 7(a) and 8(a) show the compositions of the corresponding synthetic distribution graphs of 19 national ERLTEs at 500-hPa geopotential height and 850-hPa winds abnormally, respectively. It is shown that, influenced by stronger blocking high of Ural and northeast cold vortex as well as stronger East Asia major trough at 500-hPa geopotential height, the cold air is guided in moving southward from East and West paths, and that the northerly wind at 850 hPa becomes stronger, which is helpful for the decrease of the whole. Figures 7(b) and 8(b) show the compositions of the corresponding synthetic distribution graphs of 15 East ERLTEs at 500-hPa geopotential height and 850-hPa winds abnormally, respectively. It is shown that influenced by a little stronger blocking hight of Ural, stronger blocking hight of Lake Baikal as well as stronger East Asia major trough at 500-hPa geopotential height, the cold air is guided in moving southward from central and east paths, and that the northerly wind at 850 hPa in Eastern China becomes stronger, which is helpful for reducing eastern China’ s temperature. Figures 7(c) and 8(c) show the compositions of the corresponding synthetic distribution graphs of five Northeast– North China ERLTEs at 500-hPa geopotential height and 850-hPa winds abnormally, respectively. It is shown that, influenced by a little stronger blocking heights of Ural and Lake Baikal, as well as slightly stronger East Asia major trough at 500-hPa geopotential height, the abnormal northerly wind at 850 hPa is guided in moving southward from central and east paths to about 30° N areas, while the circulation anomaly over the south area an is anticyclone, which is helpful for reducing Northeast– North China’ s temperature. Figures 7(d) and 8(d) show the compositions of the corresponding synthetic distribution graphs of seven East ERLTEs at 500-hPa geopotential height and 850-hPa winds abnormally respectively. It is shown that, influenced by stronger blocking hight of Lake Baikal, weaker polar vortex as well as stronger East Asia major trough (slightly leaning to East China) at 500-hPa geopotential height, the cold air is guided in moving southward from central path to North China– South China area, and that northerly wind at 850 hPa in this area becomes stronger, which is helpful for reducing North– South China’ s temperature. Figures 7(e) and 8(e) show the eight compositions of the corresponding synthetic distribution graphs of three North eight ERLTEs at 500-hPa geopotential height and 850-hPa winds abnormally, respectively. It is shown that, influenced by stronger blocking heights of Ural and Lake Baikal as well as stronger East Asia major trough at 500-hPa geopotential height, the circulation to the south of 40° N presents a straight distribution and that the abnormal north– east wind at 850 hPa appears only in North China, which contributes to reducing the temperature in the northern part of China. Figures 7(f) and 8(f) show the compositions of the corresponding synthetic distribution graphs of 10 Northwest– South China ERLTEs at 500-hPa geopotential height and 850-hPa winds abnormally, respectively. It can be seen that the most apparent feature at 500 hPa is abnormally stronger blocking hight of Ural and East Asia major trough, which helps to guide the cold air in moving southward from the West. Meanwhile, stronger north– west wind at 850 hPa takes place in the area north of 30° N and the stronger north– east wind at 850 hPa takes place in the area south of 30° N, corresponding to low temperatures in northwest– south China.
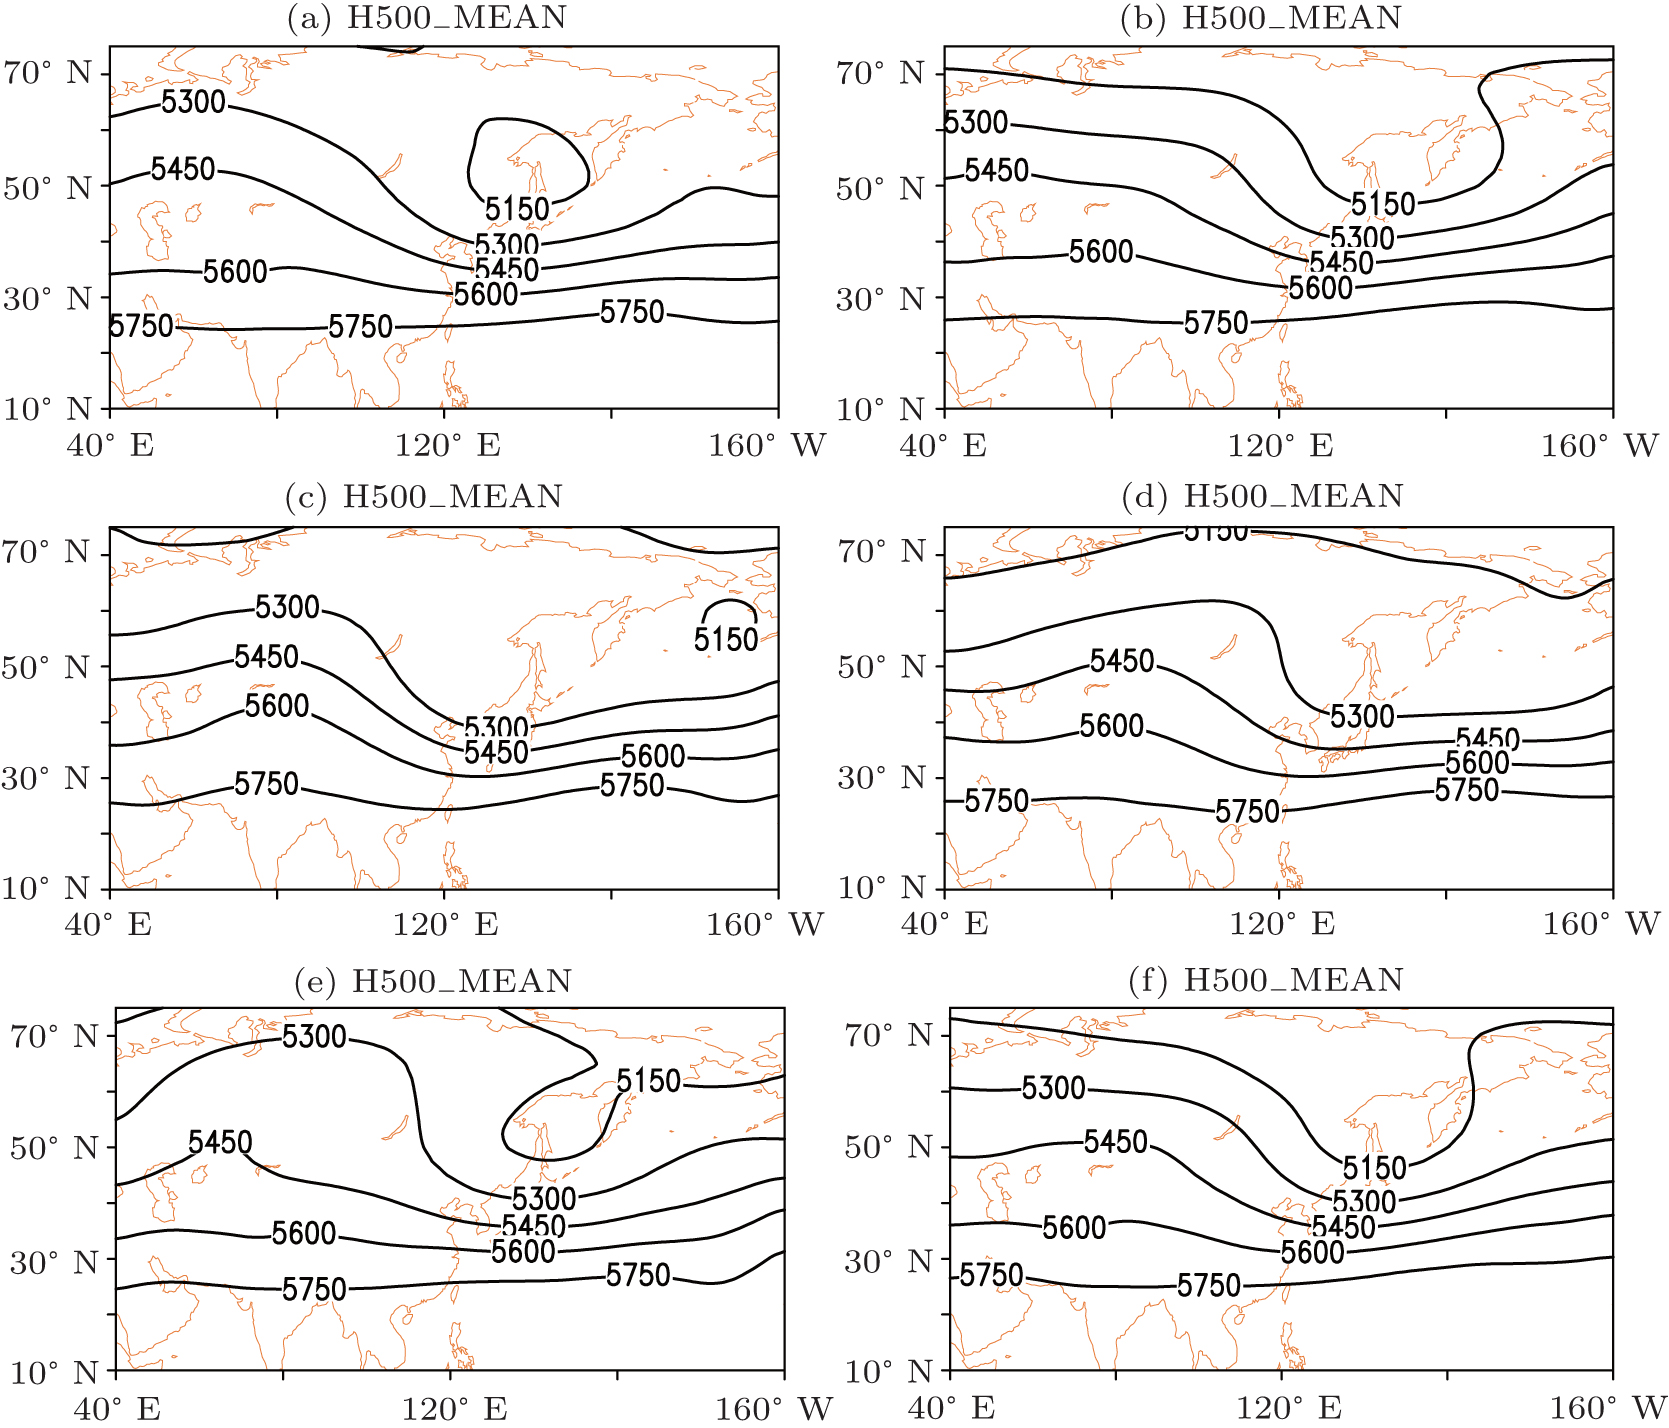 | Fig. 7. The 500-hPa geopotential height of six types of ERLTEs in the corresponding period. |
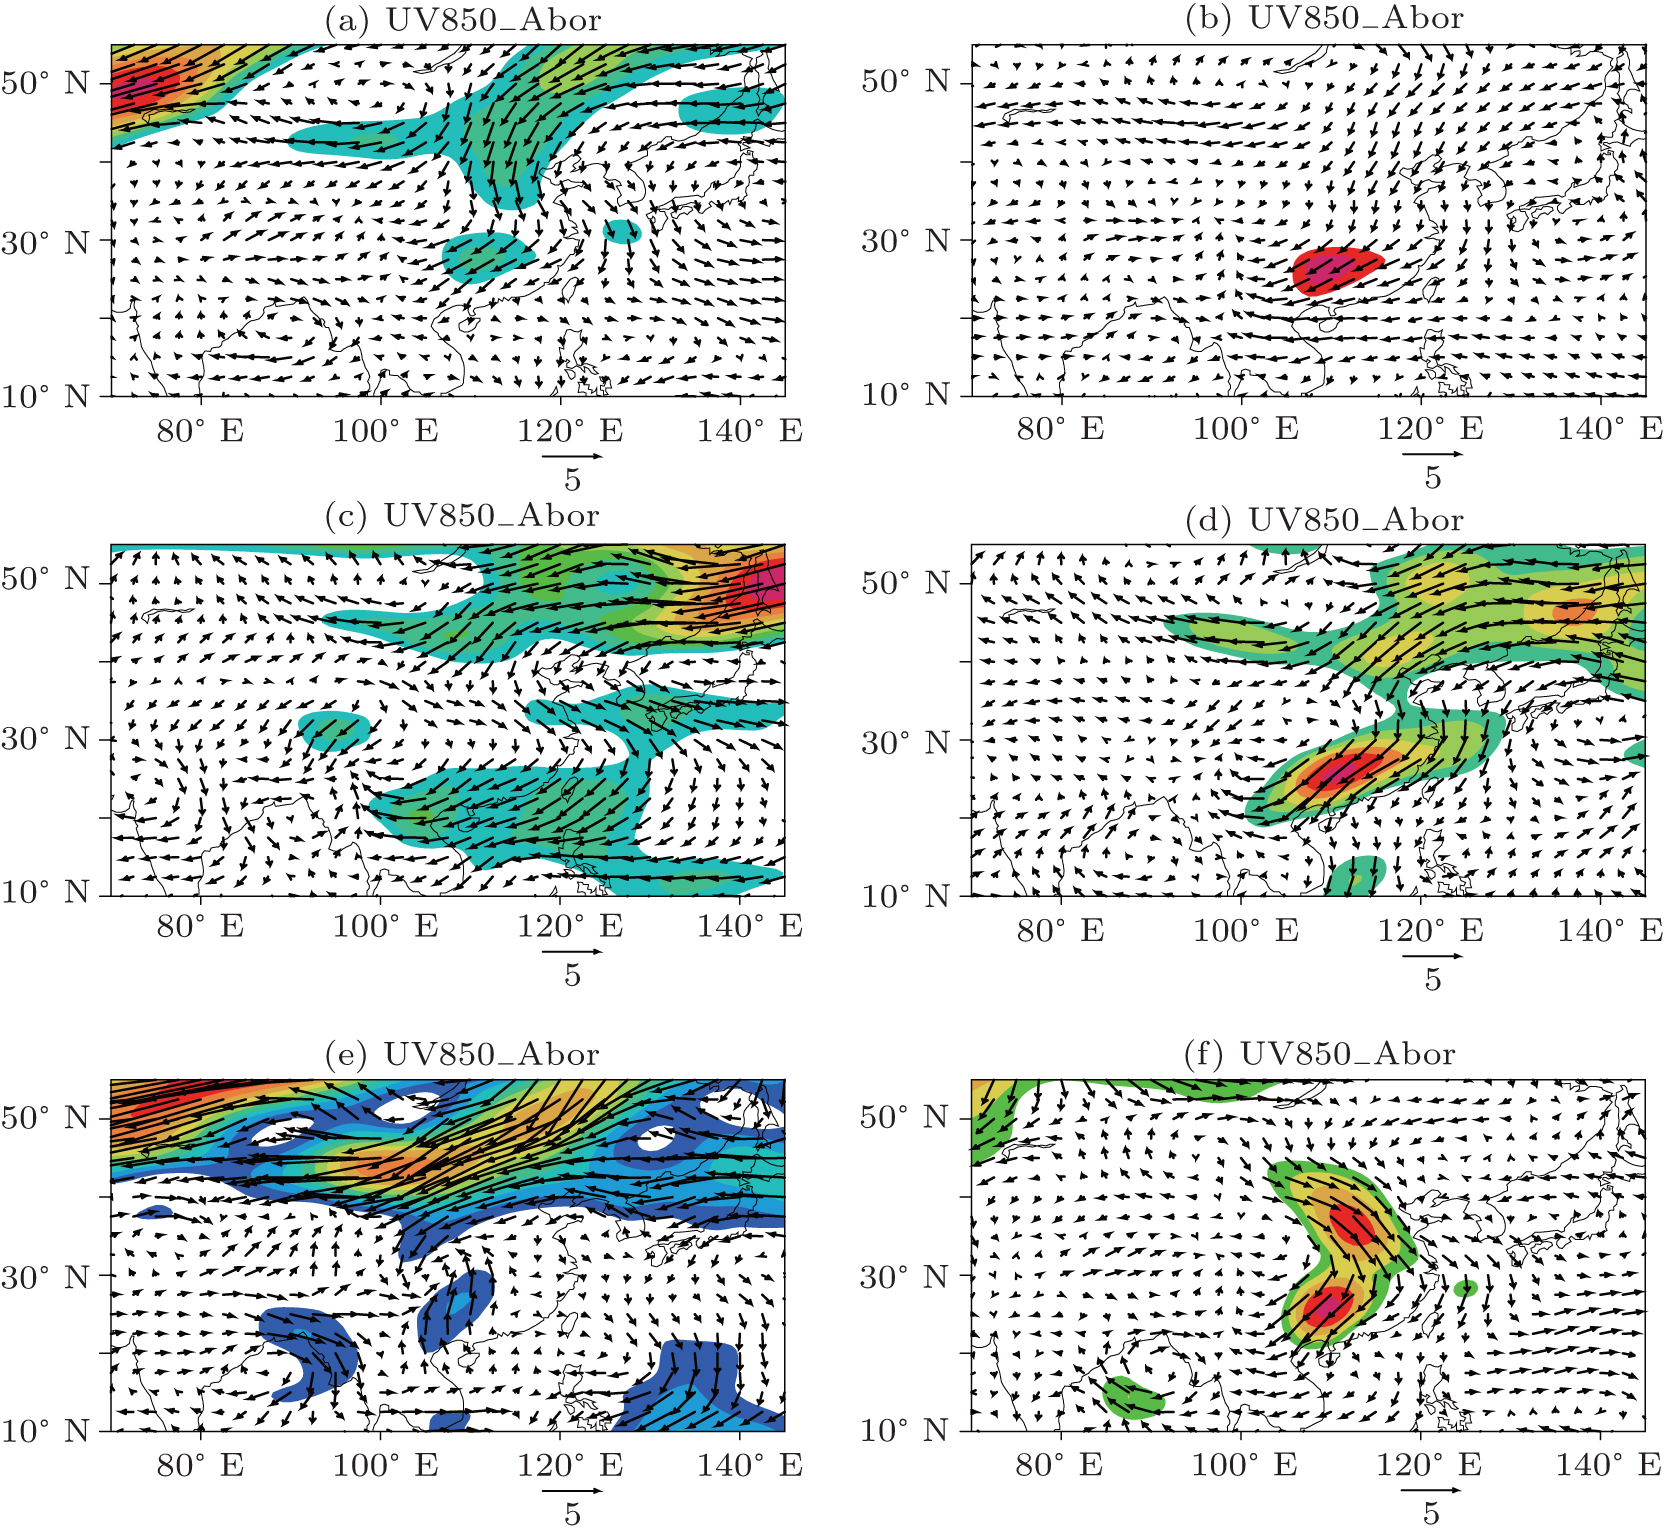 | Fig. 8. The 850-hPa winds abnormally of six types of ERLTEs in the corresponding period. |
In recent years, the ERLTEs in China have frequently taken place under the background of global warming, so there is an urgent need to analyze and study the climate characteristics and backgrounds during these frequent periods of low temperature events. In this paper, based on an objective identification technique of the ERLTEs, we investigate, detect, and analyze ERLTEs during the period from 1960 to 2013.
Since the 1960s, there have been 690 regional low temperature events, including 60 ERLTEs. By analyzing the spatiotemporal of the 60 events, it is found that the indices of ERLTEs display a downward trend from the 1960s, while this trend has changed since the 2000s, which provides a significant reference for predicting the temperatures in winter. These ERLTEs concentrate in December and January. From the spatial distribution of indices, the ERLTEs mainly take place in Northern China, as do the accumulated intensity and single-event intensity, especially in the Inner Mongolia and Northeast areas, while these events concentrate in Central and Eastern China, as does the frequency.
In accordance with the influenced areas of these events, 60 ERLTEs are divided into six types, in which the national and eastern types of events are high in frequency, reaching 19 and 15, respectively. Meanwhile, the circulation backgrounds, specific analyses, and influencing mechanisms of all types of events in the corresponding period are given in this paper. Our results show that, influenced by the stronger blocking hight of Ural and Lake Baikal, as well as the stronger southward polar vortex and East Asia major trough at 500-hPa geopotential height, the cold air from high latitudes is guided in moving southward, and that an abnormal northerly wind at 850 hPa makes the cold air blow into China along diverse paths, thereby forming different types of regional extreme low temperatures.
| 1 |
|
| 2 |
|
| 3 |
|
| 4 |
|
| 5 |
|
| 6 |
|
| 7 |
|
| 8 |
|
| 9 |
|
| 10 |
|
| 11 |
|
| 12 |
|
| 13 |
|
| 14 |
|
| 15 |
|
| 16 |
|
| 17 |
|
| 18 |
|
| 19 |
|
| 20 |
|
| 21 |
|
| 22 |
|
| 23 |
|
| 24 |
|
| 25 |
|
| 26 |
|
| 27 |
|
| 28 |
|
| 29 |
|
| 30 |
|
| 31 |
|
| 32 |
|
| 33 |
|
| 34 |
|
| 35 |
|
| 36 |
|
| 37 |
|