
Ion and water transport in charge-modified graphene nanopores
[Qiu Ying-Hua, Li Kun, Chen Wei-Yu, Si Wei, Tan Qi-Yan, Chen Yun-Fei† ]
]
]
|
|


†Corresponding author. E-mail: yunfeichen@seu.edu.cn
*Project supported by the National Basic Research Program of China (Grant Nos. 2011CB707601 and 2011CB707605), the National Natural Science Foundation of China (Grant No. 50925519), the Fundamental Research Funds for the Central Universities, Funding of Jiangsu Provincial Innovation Program for Graduate Education, China (Grant No. CXZZ13_0087), and the Scientific Research Foundation of Graduate School of Southeast University (Grant No. YBJJ 1322).
Porous graphene has a high mechanical strength and an atomic-layer thickness that makes it a promising material for material separation and biomolecule sensing. Electrostatic interactions between charges in aqueous solutions are a type of strong long-range interaction that may greatly influence fluid transport through nanopores. In this study, molecular dynamic simulations were conducted to investigate ion and water transport through 1.05-nm diameter monolayer graphene nanopores, with their edges charge-modified. Our results indicated that these nanopores are selective to counterions when they are charged. As the charge amount increases, the total ionic currents show an increase–decrease profile while the co-ion currents monotonically decrease. The co-ion rejection can reach 76.5% and 90.2% when the nanopores are negatively and positively charged, respectively. The Cl– ion current increases and reaches a plateau, and the Na+ current decreases as the charge amount increases in systems in which Na+ ions act as counterions. In addition, charge modification can enhance water transport through nanopores. This is mainly due to the ion selectivity of the nanopores. Notably, positive charges on the pore edges facilitate water transport much more strongly than negative charges.
As a single-layer two-dimensional crystal consisting of carbon atoms, [1] graphene has attracted a considerable amount of attention in the recent years. Owing to its excellent thermal properties[2] and remarkable electronic properties, [3] pristine graphene is widely used in thermal devices[4] and energy storage devices, such as supercapacitors[5] and Li-ion batteries.[6]
In addition, monolayer graphene is extremely thin, reaching a thickness on the atomic scale, but has outstanding mechanical properties.[7] Nanopores can be drilled in graphene membranes using transmission electron microscopy (TEM), [8] and other methods.[9, 10] The reduced porous graphene layer becomes indispensable for material separation, such as gas selection, [9, 11] and biomolecule sensing such as DNA sequencing.[8, 12] These applications take advantage of the size-excluding effect of nanopores; that is, small molecules can pass through nanopores while larger ones cannot. Due to its relative inertness and impermeability to all standard gases, graphene is an excellent material for molecular sieves. For example, using ultraviolet-induced oxidative etching, Koenig et al.[9] created sub-1-nm pores in micrometer-sized graphene membranes. Based on the sizes of the created pores, their resulting membranes could be used to select specific gas molecules, such as H2 and CO2. Since it is just single-atom-thick, which is comparable to the distance between base pairs, [13] monolayer graphene is a promising candidate for use in DNA sequencing. Recently, many simulations and experiments have been conducted to measure the ionic current accompanying DNA molecules translocation across nanopores.[8, 12] However, their results have shown that the ionic current noise levels were several orders of magnitude larger than those in silicon nitride nanopores, [12] which made it difficult to discriminate the four different bases in DNA.
The applications stated in the previous paragraph are based on pristine porous graphene membranes. Many graphene derivatives have been found that broaden the functional range of graphene layers.[14] Graphene oxide (GO) is an important example that is easy to fabricate and is likely to be amenable to industrial-scale production. Due to its advantages, such as hydrophilicity, GO layers facilitate material separation, especially separation of water molecules in vapor or liquid phases. Nair et al.[15] found that sub-micrometer-thick membranes made from GO could be completely impermeable to liquids, vapors, and gases, but still allow unimpeded permeation of water. They attributed these seemingly incompatible observations to the low-friction flow of a monolayer of water through two-dimensional capillaries formed by closely spaced graphene sheets. Joshi et al.[16] investigated permeation through micrometer-thick laminates prepared by vacuum filtration of GO suspensions. These laminates act as molecular sieves, blocking all solutes with hydrated radii larger than 4.5 Å . Smaller ions permeated through the membranes at rates thousands of times faster than what is expected for simple diffusion, which is attributed to a capillary-like high pressure acting on ions inside graphene capillaries.
Besides the derivatives, graphene can be functionalized with different chemical groups using a variety of methods.[17, 18] These functional ligands can realize or facilitate the filter functions of pristine graphene membranes. Many studies on modified porous graphene have been conducted, which provide inspiration for the design of nano-devices based on porous graphene, particularly in desalination. Using molecular dynamics (MD) simulations, Cohen-Tanugi et al.[19] pressed brine through graphene nanopores to explore the desalination performance as a function of pore size, chemical functionalization, and applied pressure. Their results indicated that, in addition to pore size and pressure, the membrane’ s ability to prevent salt passage depended on the type of chemical functional group. Hydroxyl groups could roughly double the water flux due to their hydrophilic character. Based on the ion prevention and enhanced water flux, nanopores with chemical functional groups modified could be used in seawater desalination with a lower energy cost.[20] Sint et al.[21] designed graphene nanopores that are functionalized by negatively charged nitrogen and fluorine, as well as positively charged hydrogen. They found that these functionalized nanopores had selectivity for ions with counter charge from the functional groups. Through analyzing the potential of mean force along the direction perpendicular to the pore, Konatham et al.[22] detected the ease of ion and water translocation across modified nanopores with different chemical groups in a NaCl solution. They found that charged groups could exclude co-ions effectively, but the effect became less pronounced as the pore diameter increased.
These chemical groups tethered on the rim of the nanopores change mainly the charge property of the nanopores, while some groups can change the pore hydrophobicity. Because the electrostatic force in solution is a strong long-range interaction, [23] the surface charges may have a considerable influence on the ion selectivity of nanopores, as well as water transport, which is particularly important in seawater desalination. Using MD simulation, we investigated ion and water transport in 1.05-nm nanopores to explore the influence of the charge sign and amount on their translocation through nanopores. The pore size in the simulation is moderate due to the small size-effect of the pore, [16, 22] i.e., ions and water molecules can pass through the pores, and the charges on the edges have an obvious effect on the transport of solution. As an effective tool to discover mysteries of the nano-world, MD simulation provides detailed characteristics of nanofluids that facilitate an understanding of this transport process and the mechanism of nanopore selectivity for ions. We think that such an investigation may provide some useful information to the device design for desalination and other applications involving porous graphene.
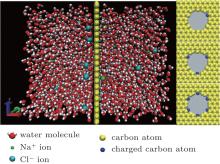
A schematic diagram of the model used in the simulations is exhibited in Fig. 1, [24] which is assumed to be infinite in all three directions using periodic boundary conditions. The graphene layer with a nanopore is set in the center of the system. The height and the width of the box are 5.0 nm and 2.84 nm, respectively. On each side of the graphene layer, the solution extends 3.2-nm along the axial direction of the nanopore. The edge of the pore is charged and the charged atoms are distributed as shown on the right side of Fig. 1. In our simulation, an external electric field with strength of 0.25 V/nm was applied in the negative x direction. During the simulation, the carbon atoms in the graphene layer were frozen, having nothermal vibration. Extra counterions were added in the charged systems to make them charge-neutral. The number of water molecules used in the simulations was 2880, and the concentration of NaCl was 0.5 M.
 | Fig. 1. Schematic diagram of the MD model and three different types of charged nanopores. |
In our simulations, the TIP4P model[25] was selected to simulate the water molecules, and the SETTLE algorithm[26] was chosen to maintain the water geometry.The Lennard-Jones (LJ) potential was used to describe the interactions between different atoms, except interaction pairs involving the hydrogen atom and carbon– carbon pairs.[19] The electrostatic interactions between ions, water molecules, and pore charges were modeled by the Ewald summation algorithm.[27] The motion equations were integrated using the leapfrog algorithm with a time step of 2.0 fs. The solution system was maintained at 298 K with Berendesen thermostat.[28] The first run lasting 1.5 ns was used to equilibrate the system. Another 2-ns-long run followed to gather the statistical quantities.
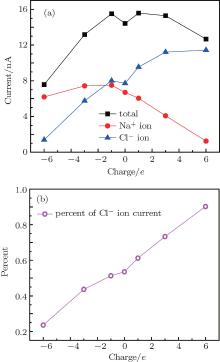
Figure 2(a) shows the ionic current as a function of the sign and amount of charges on the nanopore edge. In the neutral nanopore, the Cl– ion current is a little larger than the Na+ ion current due to the higher mobility of Cl– ions.[29] When the nanopore is charged, the total current shows an increase– decrease profile. When the charges are negative, the modified nanopore provides an attractive force to Na+ ions and a repulsive force to Cl– ions, which results in nanopore selectivity for Na+ ions. As the charge amount increases, both Na+ and Cl– ion currents decrease. This is due to the enhanced repulsion to Cl– ions and attraction to Na+ ions provided by the pore charges, as these ions pass through the pore (shown in the following). However, when the nanopore has positive charges, Cl– ions act as counterions and main current carriers. The nanopores have a specific selection for Cl– ions. As the positive charge amount increases, the Cl– ion current increases monotonically, and reaches a plateau accompanied by a total current drop that makes the percent of Cl– ion current to the total current much larger, as shown in Fig. 2(b). As the pore charges change from − 6e to + 6e, the percent of Cl– ion current rises monotonically from 23.5% to 90.2%, which means that co-ions rejection by the negatively and positively charged nanopores can reach 76.5% and 90.2%, respectively.
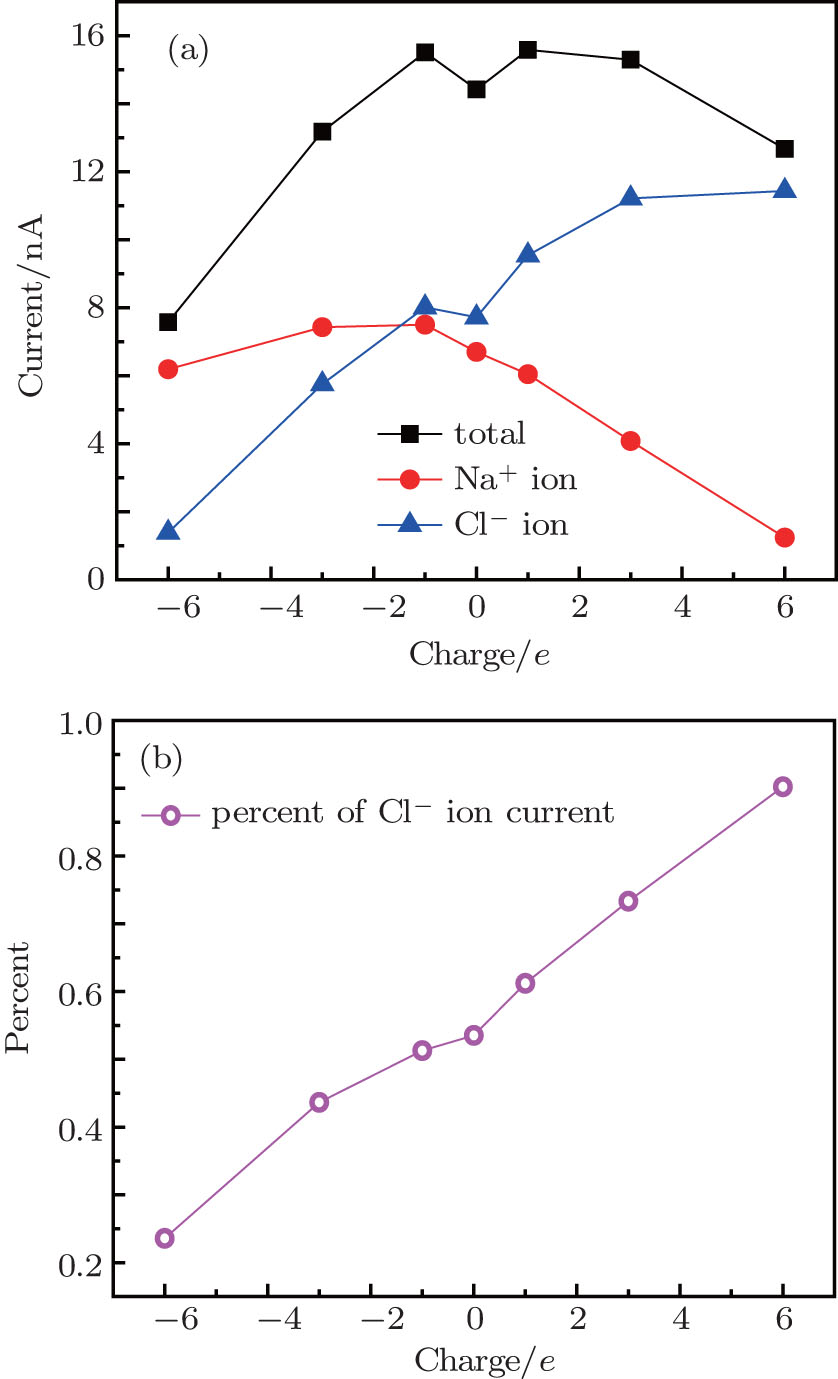 | Fig. 2. (a) Current through nanopores versus pore charge, (b) percent of Cl– ion current to the total current versus pore charge (e is elementary charge). The positive and negative numbers on the horizontal axis correspond to positive and negative charges on the pores. |
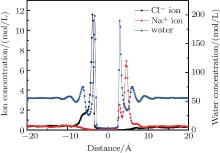
When the system reached equilibrium under the electric field, ion and water concentrations perpendicular to the graphene layer were analyzed. The results obtained in neutral case are plotted in Fig. 3. The monolayer graphene nanosheet was defined to reside at the zero position. When an external electric field is applied, Na+ and Cl– ions are driven directionally, and accumulate on the right and left sides of the graphene layer, respectively. The accumulating ions show a layering effect in Fig. 3. The main peak locations of Na+ and Cl– ions are 4.6 Å and − 3.8 Å , respectively. The difference is that the smaller peak of the Na+ ion profile is closer to the graphene layer, while that of the Cl– ions is farther away. From the Na+ ions distribution, it can be found that a few Na+ ions stay near the graphene layer. They are attracted by the water molecules which adsorbed by the membrane. By comparing the peak locations of the ions and water, most ions accumulate in the valley of the water concentration, which determines the main peak locations of ions. For the water density profile, the positions of the adsorption layer on each side of graphene are not symmetrical; i.e., the left peak is a little farther away than the right one. This positional difference is mainly caused by the different structures of water molecules in the adsorption layers under the electric field.
 | Fig. 3. Ion and water distributions perpendicular to the neutral porous graphene. |
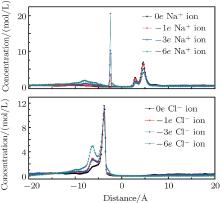
When the nanopore is negatively charged, Na+ ions are the selective ions. They can pass through the nanopore with priority. However, the negative pore charges have an attractive force for the Na+ ions after they pass through the pore, which makes another ion peak form on the left side of the graphene layer located at − 2.4 Å , as shown in Fig. 4. As the charge amount on the pore rim increases, more Na+ ions are adsorbed on the right side of the pores. Then, the counterion current is reduced. Cl– ions are non-selective by the pores. As more Cl– ions accumulate on the left side of the graphene layer, a smaller peak emerges at − 6.4 Å , which causes a drop in the co-ion current. When the charges on the pore are increased to − 6e, there are nearly no Cl– ions in the right part of the system.
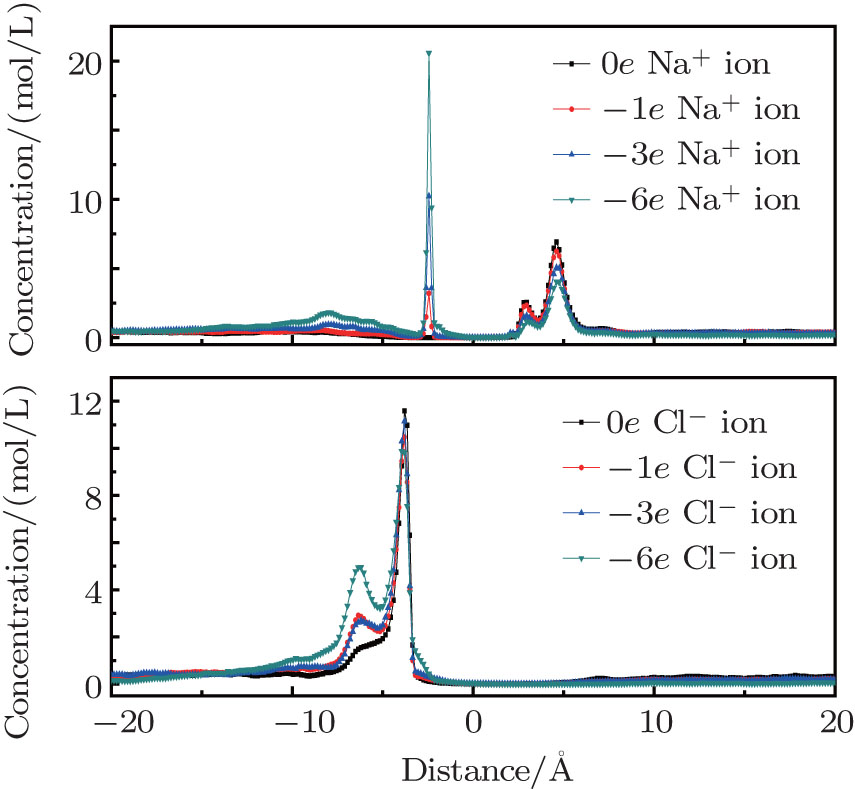 | Fig. 4. Ion distributions perpendicular to the graphene layers with negative charges. |
When the nanopores have positive charges, Cl– ions are the counterions and are selected by the nanopores. The peak locations are 2.8 Å and 4.6 Å for Na+ ions, and − 3.7 Å for Cl– ions, as shown in Fig. 5. Na+ ions accumulate on the right side of the nanopore. As the amount of charges increase, more Na+ ions are prevented from approaching the nanopores due to the rejection by the pore charges. The smaller peak reduces while the larger peak increases. The accumulating Cl– ion peak on the left side of the pore decreases because of its high flux through the nanopore. However, we found that fewer Cl– ions remained on the right side of the pore attracted by the charges. The ions that passed through the nanopores distributed themselves almost uniformly on the right side of the system, which may be due to their higher mobility. This is responsible for the increased counterion current when the charges are positive, which further affects water transport through the nanopores. In this system, co-ions seldom emerged on the left side of the pore when the charge reached + 6e, which is the same as in the negatively charged case.
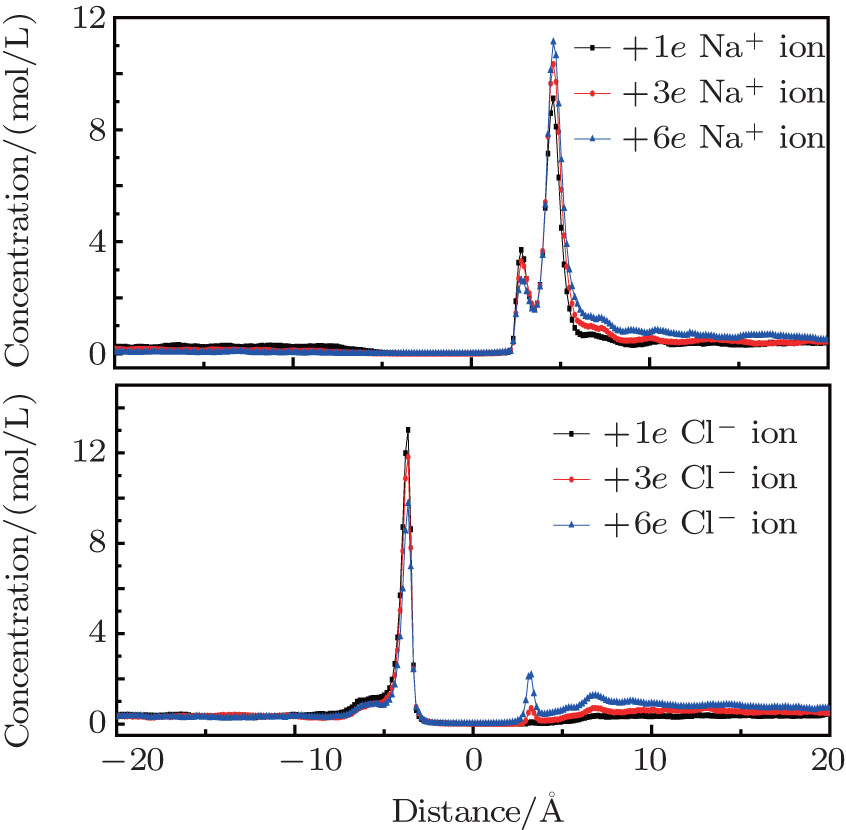 | Fig. 5. Ion distributions perpendicular to the graphene layers with positive charges. |
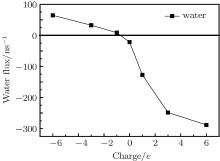
Under the electric field, water molecules have a directional movement due to the transport of ions. Figure 6 shows the water flux in the graphene nanopores depending on the sign and magnitude of charges. The positive direction is defined as the direction of Na+ ion translocation, which is along the negative x-axis. It is found that the water flux can be largely enhanced by the charges on the pore rim. Besides, it increases as the charge amount increases. An interesting phenomenon is that positive charges can make water transport through nanopores much easier than negative charges. The water flux in the positive nanopore is about 10 times of that in the negative pore when the charge amount is 3e. We think that this phenomenon is caused by the counterion transport through the nanopores, and it is of great importance to the control of water molecule transport in seawater desalination.
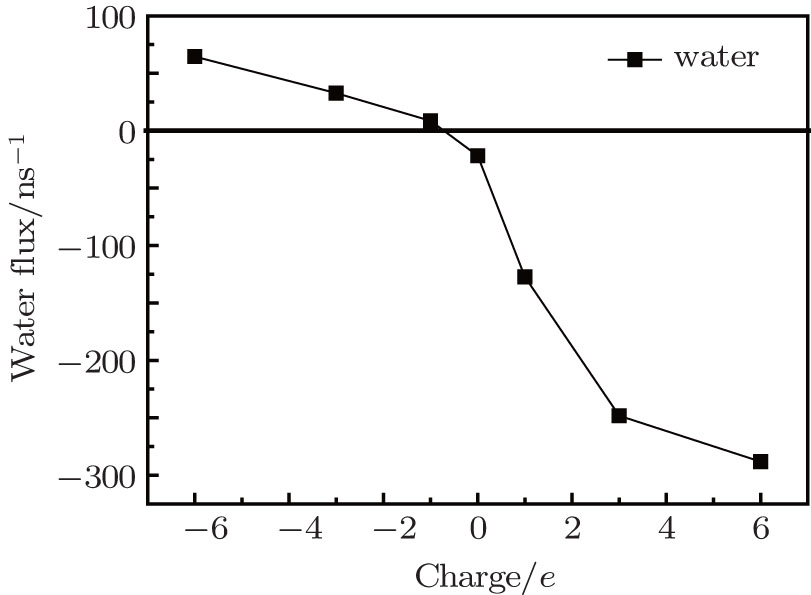 | Fig. 6. Water flux in the nanopore as a function of charge amount. |
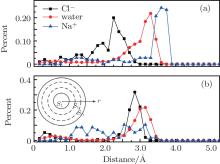
Through analyzing the position of the distributions of ions and water molecules that passed through the nanopore, we obtained the percent of ions and water flux to the total fluxes in the nanopore at different positions. The binning method is shown in the inset of Fig. 7(b). The percent of each location is calculated using Eq. (1).
where Si is the number of ions or water molecules that translocate across the nanopore in the layer with number i.
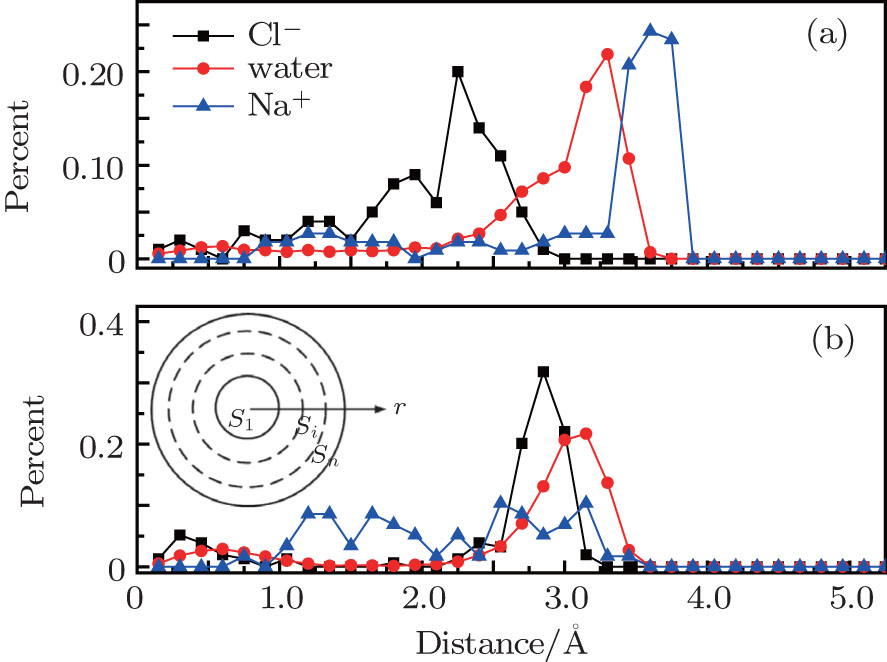 | Fig. 7. Percent distributions of ion and water contributions to the total flux at different positions in the nanopore. Panels (a) and (b) show results for negative and positive pores with charge amount 3e, respectively. The inset in panel (b) shows the binning method used in Eq. (1). |
When the pore is charged with 3e, counterions are attracted to the surface. Therefore, the counterions in solution pass through the nanopore close to the pore inner surface. The main position of Na+ and Cl– ions transport are 1.65 Å and 2.45 Å from the pore surface, respectively. The farther location of Cl– ions is mainly due to their larger hydration radius.[30] In both cases, co-ions pass through the nanopore in the center of the pores. For water molecules, the locations of the main positions of water molecule transport are nearly the same and near the pore walls. As a polar molecule with isosceles triangle geometry, water molecules form hydration layers around Na+ and Cl– ions. We think that the water flux is mainly caused by the water molecules in the hydration layers of ions that move with the ions.
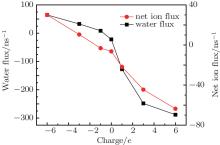
 | Fig. 8. Water and net ion flux versus surface charge. |
In order to confirm the direct correlation between water and ion transport across the nanopore, the net ion flux and water flux through the nanopores are shown in Fig. 8. The net ion flux is derived from the number of Na+ ions that translocate through the nanopore along the negative x direction reduced by the number of Cl– ions passing through the pore along the positive x direction. By comparing the net ion flux profile with the water flux profile, we find that the two curves share a similar trend. Hence, we can conclude that the water flux is directly correlated to ion transport in the nanopore, especially the counterion transport.
Under the same external electric field, we investigated the ion and water transport through positively and negatively charged graphene nanopores using MD simulation. When the nanopores are charged, counterions are the main contributor to the current, which is due to their priority passage through the nanopores. As the charge amount increases, the total ionic currents show an increase– decrease trend, and the counterions selectivity increases that enhances the water flux in the nanopores, especially in positively charged pores. Our simulation results provide a clear picture of the ion and water molecule transport through charged nanopores, which has wide application to the use of graphene in desalination and biomolecule sensing processes.
Graphene is an allotrope of carbon, which is the main compositional element of organisms. It has strong interaction with the lipid bilayers of cell membranes. Tu et al.[31] found that they could conduct destructive extraction of phospholipids from Escherichia coli membranes using graphene nanosheets. This is due to the strong dispersion interaction between graphene and lipid molecules. Titov et al.[32] simulated the sandwiched graphene– membrane superstructures, and found that graphene with different layers could be hosted inside the phospholipid bilayer membrane firmly. Meanwhile, Hu et al.[33] found that, when surrounded by proteins, the affinity between graphene and a membrane could be largely reduced. Based on these technologies, the interaction between graphene and cell membranes can be finely controlled in the near future. We think that a cell lab with a graphene gate can be sketched. On a cell, we can embed a porous graphene sheet to replace a membrane region. Through modifying the edge of the pore, we can control the material exchange between the cell and its environment.
| 1 |
|
| 2 |
|
| 3 |
|
| 4 |
|
| 5 |
|
| 6 |
|
| 7 |
|
| 8 |
|
| 9 |
|
| 10 |
|
| 11 |
|
| 12 |
|
| 13 |
|
| 14 |
|
| 15 |
|
| 16 |
|
| 17 |
|
| 18 |
|
| 19 |
|
| 20 |
|
| 21 |
|
| 22 |
|
| 23 |
|
| 24 |
|
| 25 |
|
| 26 |
|
| 27 |
|
| 28 |
|
| 29 |
|
| 30 |
|
| 31 |
|
| 32 |
|
| 33 |
|