Influences of neutral oxygen vacancies and α -quartz
[Li Hui-Rana) , Cheng Xin-Lu†a), b)  , Zhang Hong
a), c) , Zhao Fengd) ]
, Zhang Hong|
|


†Corresponding author. E-mail: chengxl@scu.edu.cn
*Project supported by the National Natural Science Foundation of China (Grant Nos. 11176020 and 11374217) and the Doctoral Program of Higher Education of China (Grant No. 20100181110080).
Our calculations demonstrate that the concentration of neutral oxygen vacancies can affect the geometrical structrue, electronic structure, and optical properties of α-quartz. Moreover, the distribution of the neutral oxygen divacancy can also exert some influence on the properties of α-quartz. The dissimilarity and similarities are presented in the corresponding density of state (DOS) and absorption spectrum. In addition, when a higher defect concentration is involved in α-quartz, the influence of
The intrinsic point defects can markedly affect material properties.[1– 5] For instance, point defects can cause the transmittance band position of multiphase zirconia film to shift[6] and enlarge the friction of carbon nanotube.[7] And the oxygen vacancies have a significant effect on the phonon mode of hexagonal HoMnO3 thin film.[8] While among the point defects generated in silica (SiO2) material, [9– 12] the oxygen vacancy (VO) is one of the most point harmful defects. It has been found that the VO is a dominant element in the percolation of SiO2 and is responsible for the breakdown in electric-field strength.[13– 15] The VO vacancy can increase the hole tunneling current passing through α -quartz.[16] In addition, when the number of VO vacancies increases, the leakage current can almost exponentially rise.[17] Therefore, VO has been extensively investigated from silica clusters[18] to solid materials.[19] In particular, a considerable amount of work has been carried out to investigate the α -quartz with deficient centers, [20, 21] including the theoreticalal study by using the density functional theory (DFT).[22, 23] According to the generalized gradient approximation (GGA) calculations, Kang et al.[24] indicated that a network of oxygen vacancies can drastically increase the gate leakage current. Furthermore, it has been found that the formation of the VO chain is energetically feasible once the isolated VO vacancies are created.[24] And Nadimi et al.[17] also reported a similar phenomenon that there is an attractive interaction between two neutral vacancies.
When the oxygen vacancy in α -quartz is exposed to radiation, the 


Because the above-mentioned defects have a major influence on the SiO2 materials, a complete understanding of them can help to improve the quality. It is necessary to make a further study of the neutral VO and 


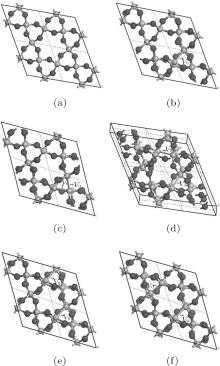
The periodic supercell applied in our investigation contains 72 atoms, which are obtained by 2a × 2b × 2c superlattice. The lattice parameters[39] of the used primitive cell are a = b = 4.913 Å , c = 5.4052 Å , α = β = 90° , and γ = 120° . The space group of the primitive cell is P3121, and there are three formula units per cell, that is to say, there are three Si atoms and six O atoms. The primitive cell in the supercell is shown by a dotted line in Fig. 1(a). According to Ref. [19], the neutral VO is created by removing the O atom from its lattice site in the intact crystal. With the purpose of producing a concentration of defects, one and two oxygen atoms are removed to establish 1– VO and 2– VO defects, respectively. So we have the vacancy concentration of 1.4% and 2.8%, respectively. To investigate the distribution of defects, a larger 8- membered (i.e. 8 Si– O– Si bonds) ring is chosen to vary the position of the VO. Therefore, the two oxygen vacancies are separated by different numbers of Si– O– Si bonds (0, 1, 2, or 3 Si– O– Si bonds). For convenience, the model of two adjacent VOs (separated by 0 Si– O– Si bond) is denoted as 2a– VO, and the oxygen divacancy separated by 1, 2, or 3 Si– O– Si bonds are represented by 2b1– VO, 2b2– VO, and 2b3– VO, respectively.
To build the model with the 


With the formation of the oxygen divacancy, two pairs of adjoining Si atoms (marked as Si1, Si2, Si3, and Si4) remain with the two VOs. In addition, Si2 and Si3 are adjacent to each other, and Si1 and Si4 are at the ends. The introduction of a positive charge into the system with the 2– VO center results in the model with one VO and one 


The relaxation of the related structures is performed at zero pressure by using the GGA– PBE and ultrasoft pseudopotentials.[40] All of the calculations are carried out by using the CASTEP software.[41] In the relaxation process, the total energy convergence accuracy is set to be 2.0× 10− 5 eV/atom and the maximum force acting on atom is 0.05 eV/Å . Additionally, the volume and cell shape are also relaxed, except for the atomic positions. The 4 × 4 × 4 Monkhorst– Pack k-point grid is used for the Brillouin zone integration. The maximum energy cutoff value for plane wave expansion is 340.0 eV. The optimized configurations of α -quartz with neutral VOs can be distinguished in Fig. 1.
 | Fig. 1. Configurations of α -quartz with different types of neutral VO: (a) without defect, (b) 1– VO, (c) 2a– VO, (d) 2b1– VO, (e) 2b2– VO, and (f) 2b3– VO. The gray and black spheres represent Si and O atoms, respectively. |
Because defects can modify electronic states and then affect optical properties. Thus, the density of state (DOS) is calculated to describe how the defects influence the electronic properties. To characterize the optical property, the absorption coefficient is calculated, which can be obtained by the complex dielectric function ɛ (ω ) (ɛ (ω ) = ɛ 1 (ω ) + iɛ 2 (ω )). The absorption spectrum is described by the following equation:[42]
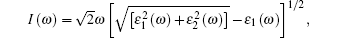
where ω is the frequency of light, and ɛ 1 (ω ) and ɛ 2 (ω ) are the real and imaginary parts of the complex dielectric constants, respectively.
The calculated lattice parameters of the perfect α -quartz supercell are a = b = 10.0795 Å , c = 10.9558 Å , α = 89.5366° , β = 90.4634° , and γ = 120.835° . Compared with the experimental values, the GGA values have the deviation within 2.6% for the lattice parameters. As for the cell volume, the result obtained by GGA approximation is about 5.7% larger than the experimental data. Additionally, for the Si– O bond length in the intact α -quartz, our setting predicts lengths in a range of 1.618 Å – 1.630 Å compared with the experimental value of 1.61 Å .[43] Meanwhile, the previous calculations give the values of 1.623 Å – 1.631 Å .[13, 15]
When the oxygen vacancy (1– VO) is introduced into α -quartz, the Si– Si bond length at the vacancy is 2.463 Å , which is similar to the previous results of 2.50 Å [44] and 2.44 Å .[15] It is also consistent with the observed Si– Si separation at the relaxed oxygen vacancy ∼ 2.50 Å .[45] At the same time, the range of the Si– O bond lengths surrounding the vacancy extends to 1.633 Å – 1.642 Å . Table 1 gives the structural parameters of the oxygen vacancies, when the α -quartz has a higher VO concentration (oxygen divacancy), there is a further expansion in the Si– Si length compared with the length in the crystal with 1– VO, except for 2b2– VO (2.424 Å and 2.423 Å ), which can be found in Table 1. Especially, with the defect of 2a– VO, the atomic structure of the vacancies is quite different from the others’ , and the Si– O bonds are severely distorted. But the atomic structures of the two vacancies are similar to each other, as well as the other types of 2– VO. For the type of 2b3– VO, the two vacancies share the same atomic structure in the Si– Si and Si– O bonds. Moreover, our calculated Si– Si bond length, 2.467 Å , is close to the reported value of 2.46 Å .[15]
| Table 1. Structural parameters of the oxygen vacancies for the configurations with oxygen divacancy, and the length bond is given in unit Å . |
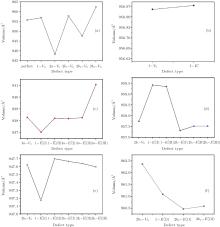
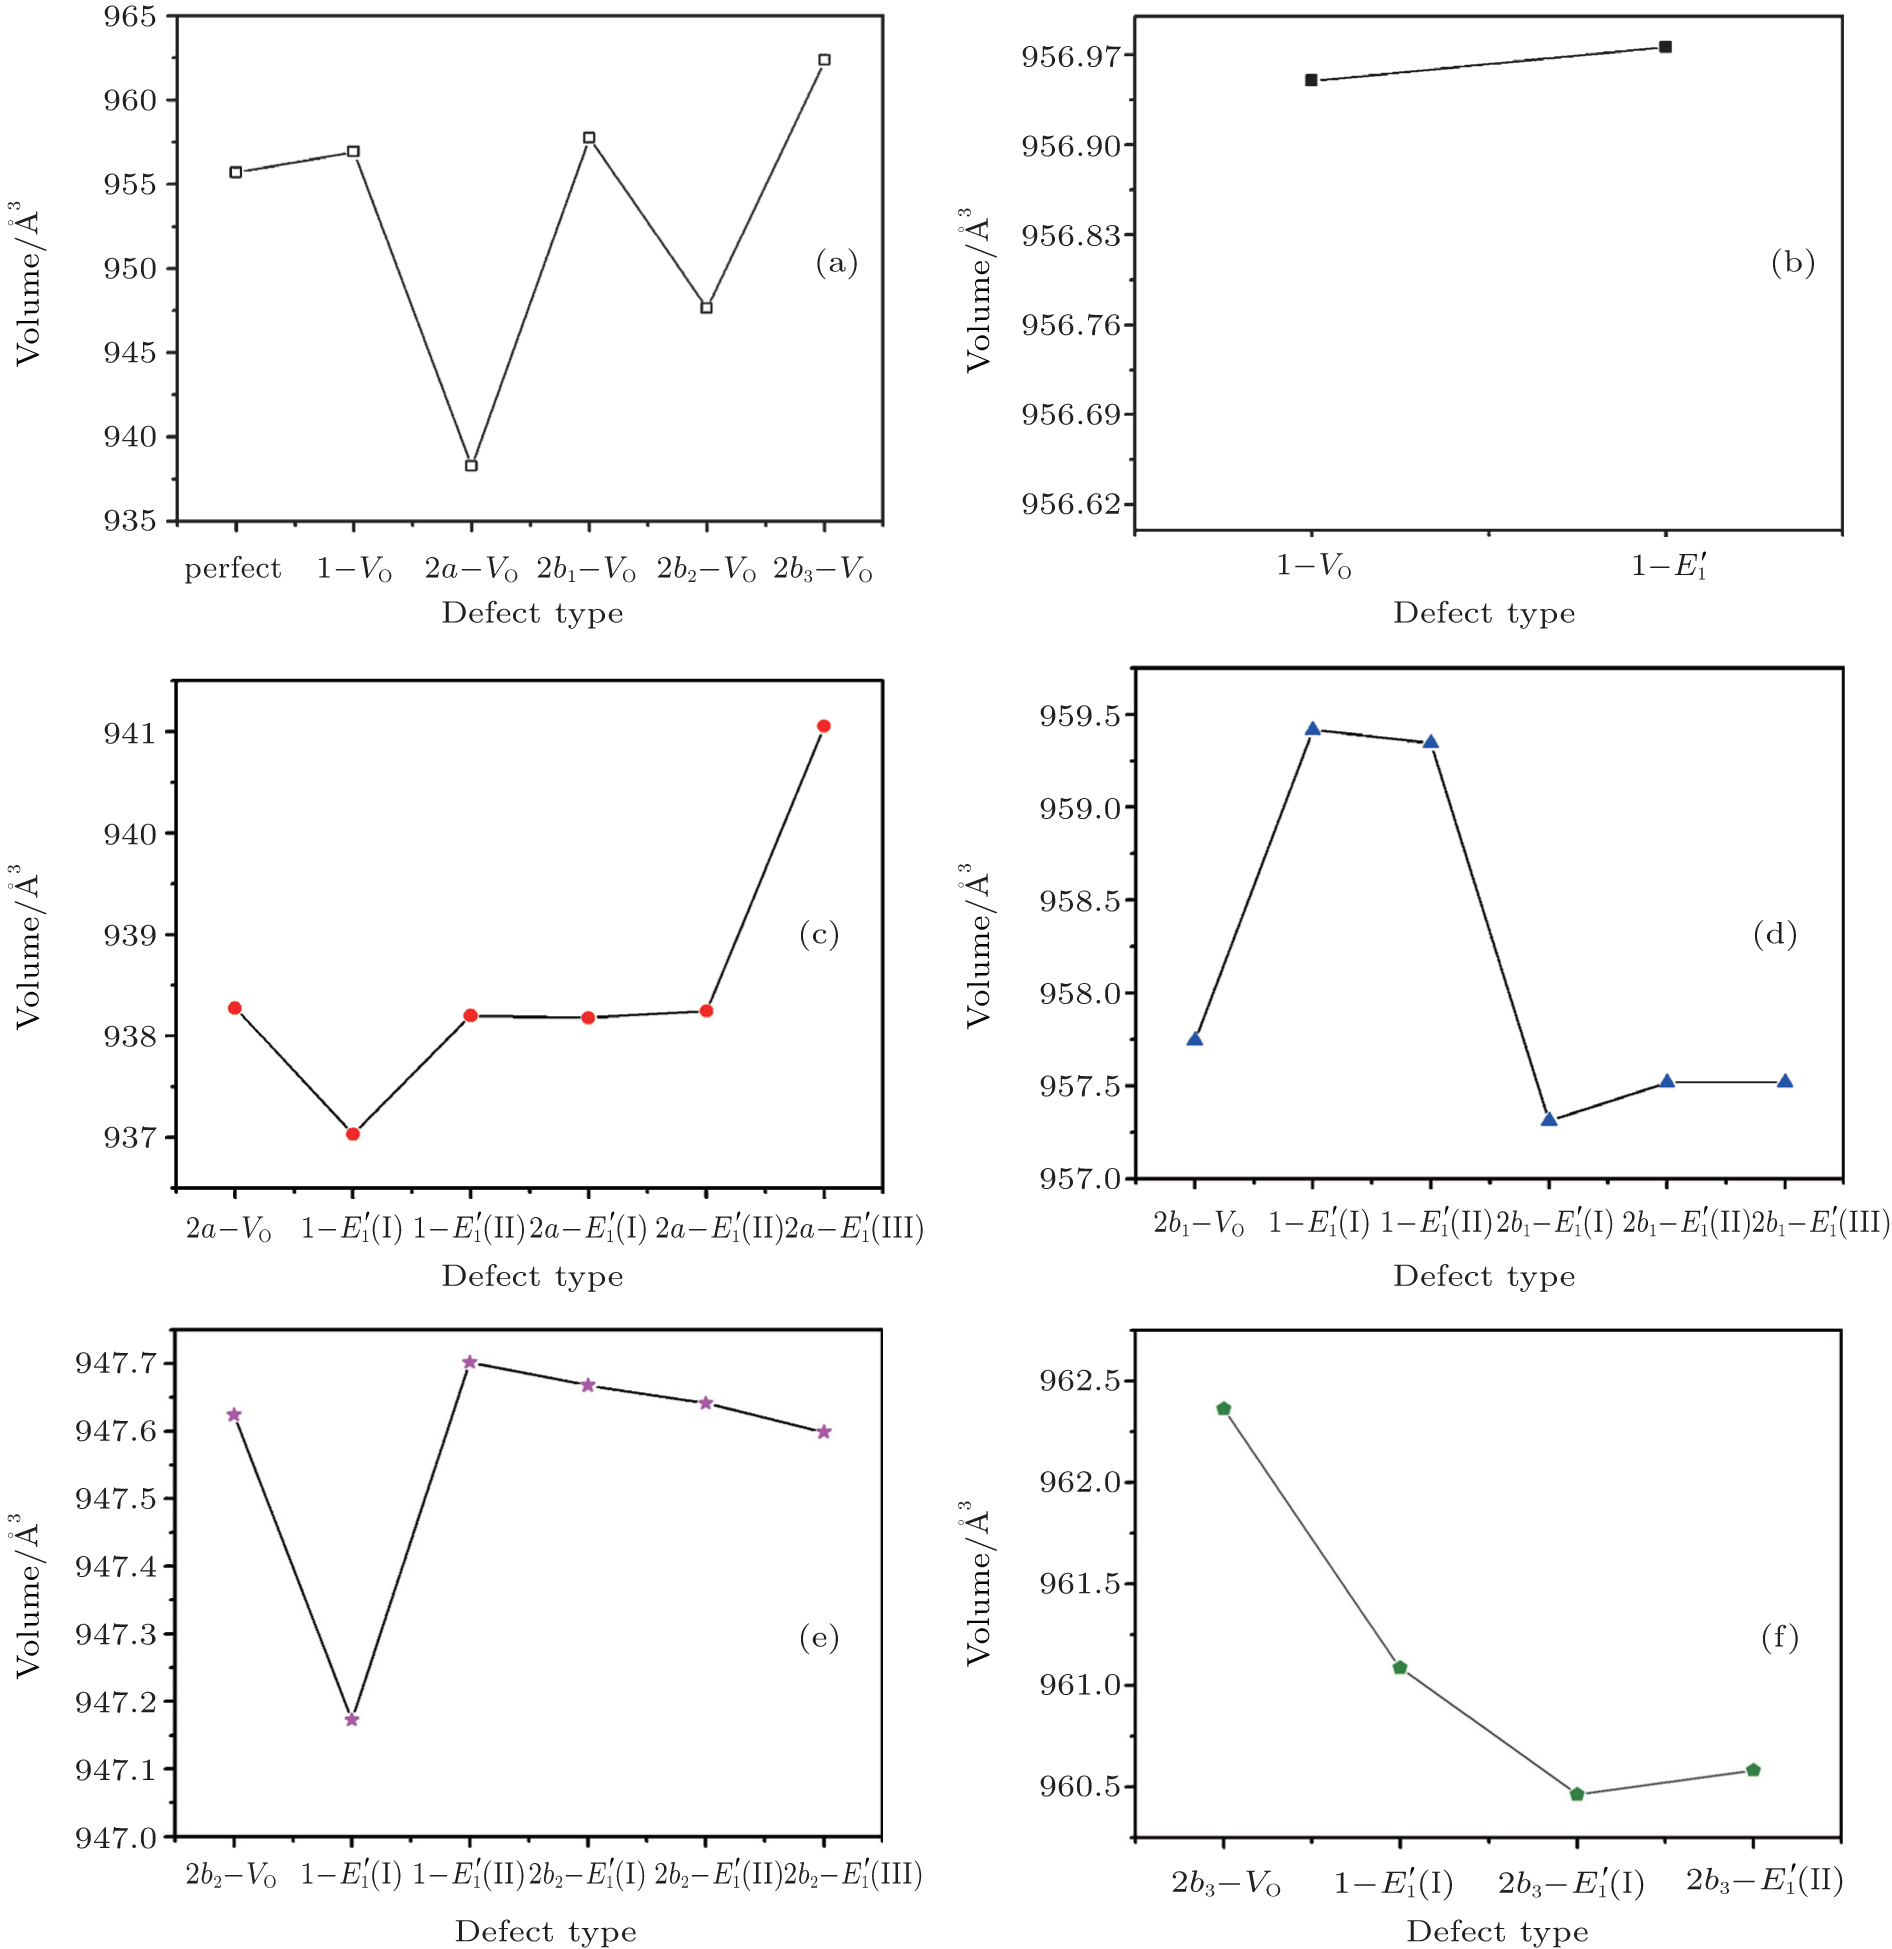 | Fig. 2. Calculated volumes of α -quartz with various defects: (a) neutral VO(s), (b) 1– VO, and      |
The volumes of α -quartz structures with various defects are listed in Fig. 2. 1– VO enlarges the geometry of α -quartz with a value of 1.264 Å 3 as shown in Fig. 2(a). However, different types of 2– VO result in different volumes and geometries. 2b1– VO and 2b3– VO lead to a further expansion in the volume. Whereas the volume becomes smaller than the perfect crystal size, when the structure with 2a– VO or 2b2– VO. It indicates that the distribution of the two vacancies can affect the geometry of α -quartz.
We can briefly analyze the effect of the 


3.2.1.Neutral oxygen vacancy
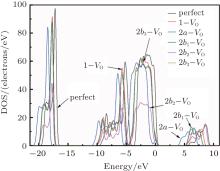
Figure 3 shows the calculated DOSs for the α -quartz with and without neutral oxygen vacancies. We can know that the band gap of the perfect α -quartz is 5.67 eV, which is smaller than the experimental values of 8.29 eV– 9.55 eV[46] and 8.9 eV.[47] But it is similar to the calculated values of 5.8 eV[15] and 5.7 eV.[16] As shown in Fig. 3, there are four distinct bands (three bands in the valence band and one band in the conduction band) in the DOS curve of the perfect α -quartz, and the highest occupied state (the maximum of valence band) is located near the Fermi level. Upon formation of the VO, the locations of the four bands evidently shift compared with those in the case of the intact crystal. Almost all of the bands move toward the lower energy level as described by Zhang et al.[15] In particular, the movement of the band in the conduction band results in the reduction of the band gap. Meanwhile, the peaks also decrease with the formation of VO. However, there is agreement in the positions of the DOS bands for the defective α -quartz, except for the model with 2a– VO. When the α -quartz has two adjacent VOs, further movement occurs in all bands, especially in the DOSs in the conduction band. As a result, the band gap becomes narrower than those of other structures. The changes in the DOSs may be a result of the redistribution of the two electron charges that remains after the O atom has moved to the two neighboring Si atoms.
In the valence band, each of the calculated DOSs is lower than that of the undefected α -quartz. Moreover, the DOS bands (in the valence band) continually decrease as the number of defects increases. However, the DOSs for the models with 2– VO centers are higher than those with 1– VO at the edge of conduction band, except for the model with the 2b2– VO center. In addition, we find that different types of 2– VO centers exhibit minimal differences in the DOS of the valence band, and the 2b2– VO center exhibits a noticeable decrease. The similarity in the DOSs is also present in 2b1– VO and 2b3– VO as their curves almost completely overlap. The variations observed in the calculated DOSs are attributed to the electrons activated at various levels. On the basis of these results, we infer that the concentration and distribution of vacancies can sufficiently affect the electronic structure.
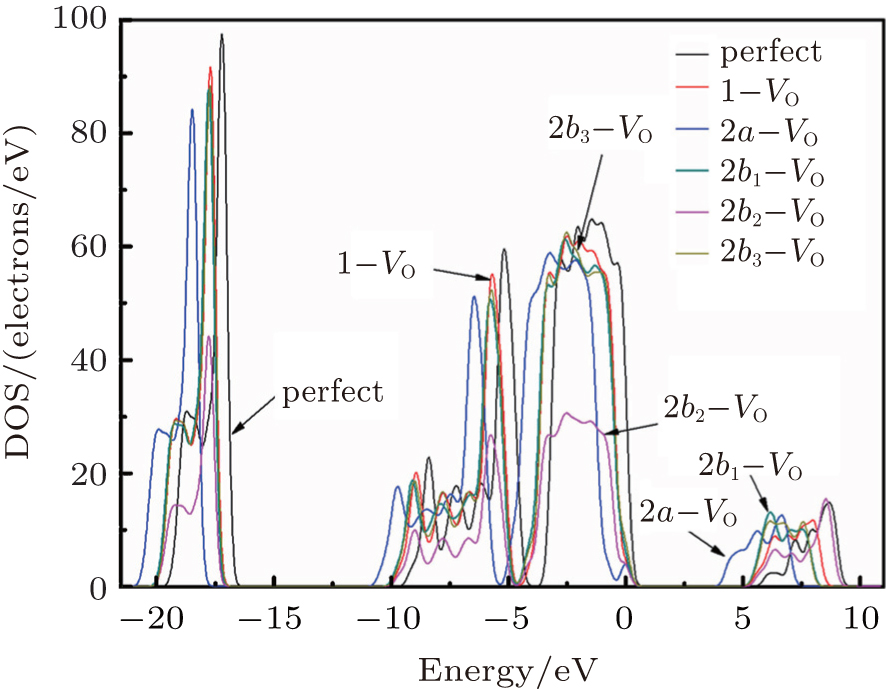 | Fig. 3. The calculated DOSs for α -quartz without and with neutral oxygen vacancy/vacancies. |
3.2.2.
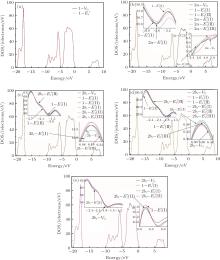
The DOSs of structures with 


Some minor differences emerge in the two bands near the Fermi level (in the conduction band and at the edge of valence band), when the 2a– VO center is introduced into the α -quartz as shown in Fig. 4(b). However, the differences from the other valence bands are undetected. The undetected differences imply that the 

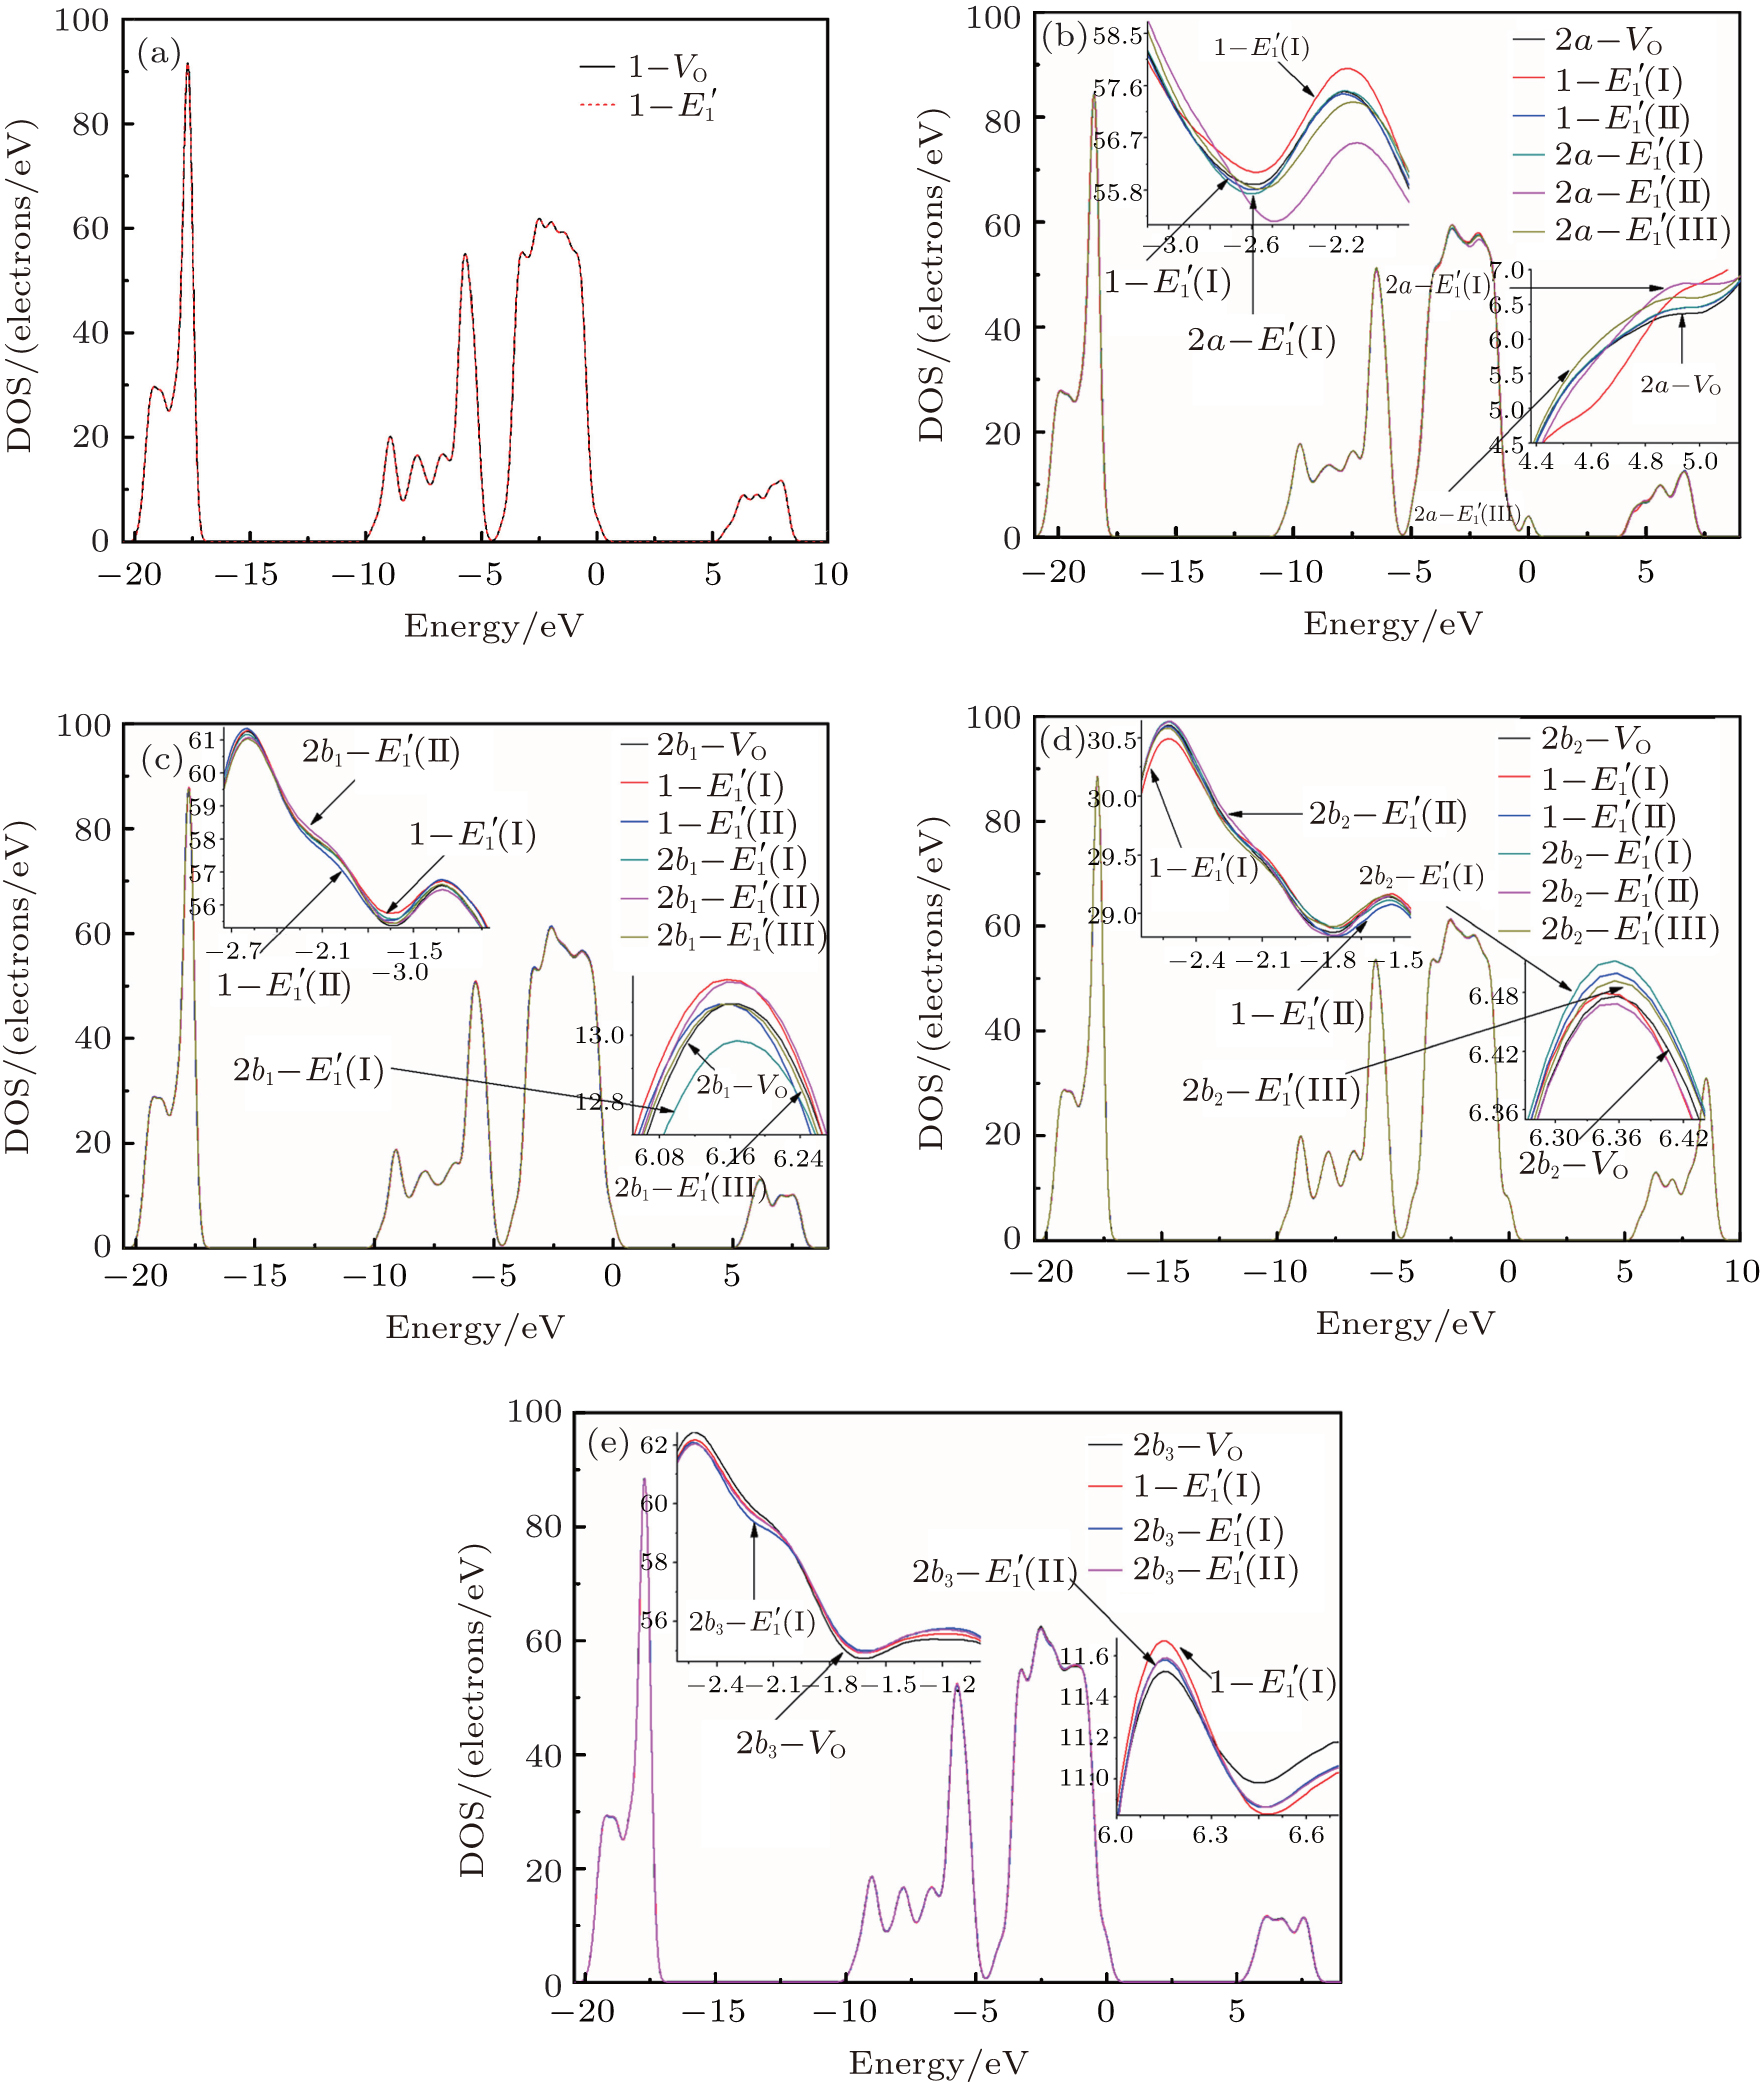 | Fig. 4. DOSs of different configurations with  |
3.3.1.Neutral oxygen vacancy
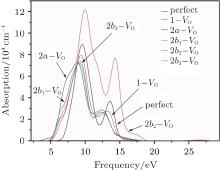
The absorption spectra for the related configurations with neutral VO(s) are displayed in Fig. 5. Notably, the absorption intensity, as well as the frequency where the peaks occur, decreases upon formation of the VO. Simultaneously, the optical absorption band widens compared with the shape of absorption spectrum curve for the perfect α -quartz. The changes indicate that the introduction of VO can remarkably influence the optical property of α -quartz. Once the two VOs appear, the absorption intensities are further reduced, except for the 2b2– VO type. The decrease observed in the absorption coefficient shows that the concentration of defects can affect the optical property of α -quartz. However, the absorption band widths of configurations with single VO and some types of 2– VO are still similar.
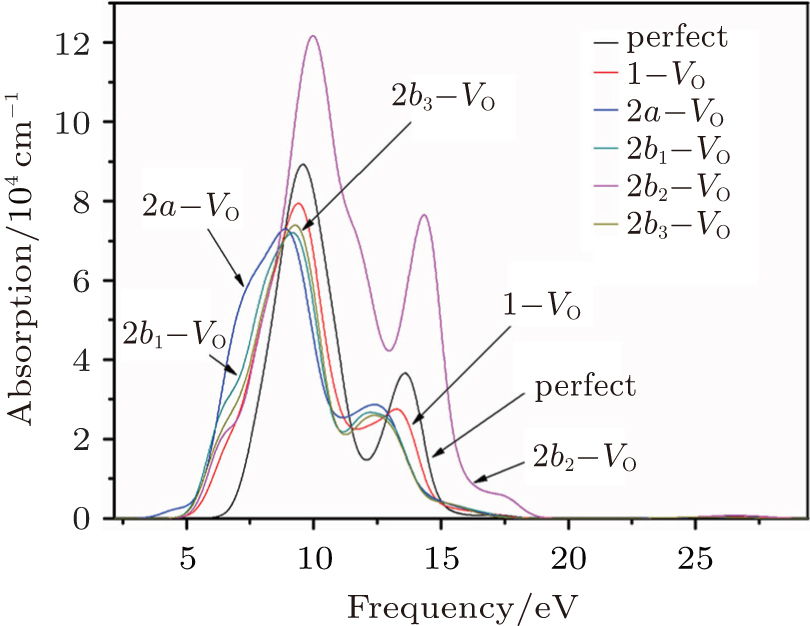 | Fig. 5. Absorption spectra for the α -quartz without and with neutral oxygen vacancy/vacancies. |
It should be emphasized that the influence of 2b2– VO on the absorption spectrum is profoundly different from those of the other types of defects. The 2b2– VO center results in a maximum absorption intensity that is considerably higher than those of other configurations, and the positions of the two peaks are at the lower energies. In addition, we can also notice that the 2b2– VO leads to the widest optical absorption band among the defective configurations. However, the lineshapes of the absorption spectrum for 2b1– VO and 2b3– VO are similar to each other, which is similar to the case of the corresponding DOSs. The dissimilarities and similarities reveal that the distribution of vacancies becomes more significant.
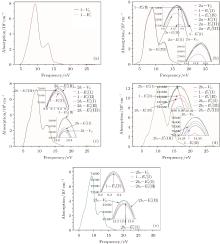
3.3.2.
According to Fig. 6, the absorption spectrum for α -quartz with 


 | Fig. 6. Absorption spectra for the α -quartz with  |
According to the calculations, the number of neutral VOs, as well as the type of 2– VO (2a– VO, 2b1– VO, 2b2– VO, and 2b3– VO), can affect the geometrical structrue of α -quartz. The presence of 

There are evident variations in the positions of the four bands of the DOSs upon the formation of the VO center, almost all of them move toward the lower energy level. The movement of the band in the conduction band results in the reduction of the band gap. In addition, different types of 2– VO centers can lead to some differences in DOS, and the 2b2– VO center results in a noticeable decrease. However, a similarity is also present as the curves of the DOSs for 2b1– VO and 2b3– VO almost completely overlap. The above descriptions suggest that the concentration and distribution of oxygen vacancies can cause changes in the electronic structure of α -quartz. At the same time, the similarity, which is observed in the DOSs between the configurations with 

Our calculations also show that the optical absorption band widens with the formation of the VO, and the absorption intensity becomes lower than that of the undefected α -quartz. The changes indicate that the introduction of VO can remarkably influence the optical properties of α -quartz. When the 2– VO center appears in the α -quartz, the dissimilarites and similarities are also reflected in the absorption spectra, similar to the case of DOSs. The results reveal that the concentration and distribution of neutral oxygen vacancies can influence the electronic structures and optical property of α -quartz.
| 1 |
|
| 2 |
|
| 3 |
|
| 4 |
|
| 5 |
|
| 6 |
|
| 7 |
|
| 8 |
|
| 9 |
|
| 10 |
|
| 11 |
|
| 12 |
|
| 13 |
|
| 14 |
|
| 15 |
|
| 16 |
|
| 17 |
|
| 18 |
|
| 19 |
|
| 20 |
|
| 21 |
|
| 22 |
|
| 23 |
|
| 24 |
|
| 25 |
|
| 26 |
|
| 27 |
|
| 28 |
|
| 29 |
|
| 30 |
|
| 31 |
|
| 32 |
|
| 33 |
|
| 34 |
|
| 35 |
|
| 36 |
|
| 37 |
|
| 38 |
|
| 39 |
|
| 40 |
|
| 41 |
|
| 42 |
|
| 43 |
|
| 44 |
|
| 45 |
|
| 46 |
|
| 47 |
|