

Dynamic mechanical analysis of single walled carbon nanotubes/polymethyl methacrylate nanocomposite films
[Badawi Ali†a)  , Al Hosiny N.
a), b) ]
, Al Hosiny N.|
|


†Corresponding author. E-mail: adaraghmeh@yahoo.com
*Project supported by Taif University (Grant No. 1/435/3524).
Dynamic mechanical properties of nanocomposite films with different ratios of single walled carbon nanotubes/polymethyl methacrylate (SWCNTs/PMMA) are studied. Nanocomposite films of different ratios (0, 0.5, 1.0, and 2.0 weight percent (wt%)) of SWCNTs/PMMA are fabricated by using a casting technique. The morphological and structural properties of both SWCNT powder and SWCNTs/PMMA nanocomposite films are investigated by using a high resolution transmission electron microscope and x-ray diffractometer respectively. The mechanical properties including the storage modulus, loss modulus, loss factor (tan δ) and stiffness of the nanocomposite film as a function of temperature are recorded by using a dynamic mechanical analyzer at a frequency of 1 Hz. Compared with pure PMMA film, the nanocomposite films with different ratios of SWCNTs/PMMA are observed to have enhanced storage moduli, loss moduli and high stiffness, each of which is a function of temperature. The intensity of the tan δ peak for pure PMMA film is larger than those of the nanocomposite films. The glass transition temperature ( Tg) of SWCNTs/PMMA nanocomposite film shifts towards the higher temperature side with respect to pure PMMA film from 91.2 °C to 99.5 °C as the ratio of SWCNTs/PMMA increases from 0 to 2.0 wt%.
During the last two decades, carbon nanotubes (CNTs) have attracted considerable attention since they possess novel properties, such as high thermal and electrical conductivity, low weight with large surface area, excellent mechanical strength and three-dimensional (3D) flexibility.[1– 3] Composites based on a low concentration of CNTs have received unique attention due to the significant enhancement of their properties with respect to the host material. The new type of nanocomposite opens novel electrical, biological and engineering applications, [3– 7] such as photovoltaic cells, [4] sensor applications, [8] transport layers and light emitting diodes (LED’ s).[9] Conductive adhesive composite materials have been widely used as a bonding material for electronic devices.[2] Furthermore, nanocomposites find their applications in dynamic conditions such as parts in automobiles, structural and industrial applications.[10– 12] Polymers are superior candidates to play the role of host materials because of their low costs and availability. Polymethyl methacrylate (PMMA) is a well-known polymer that can be used in many forms, such as sheets and films, because of its good film casting and simple preparation.[5] In our earlier work, [5] CdSe quantum dots (QDs) were used as fillers in a PMMA matrix. The optical and mechanical properties of the synthesized nanocomposite films were extremely enhanced. Khanna and Singh[9] concluded that CdS/PMMA composite film has better thermal stability than plain PMMA. Mazov et al.[13] proved that thermal conductivity of multi walled CNTs (MWNTs) filled polypropylene (PP) composites can be 2.5– 3 times higher than that of a pure PP matrix.
Many experimental techniques are used to study mechanical and thermal properties of nanocomposite films including: differential scanning calorimetry (DSC), thermo mechanical analysis (TMA), dielectric analysis (DEA), and dynamic mechanical analysis (DMA).[14, 15] DMA studies are most sensitive to the composites properties and are, thus, effective techniques for their evaluation. Using the DMA tool, Tg can be easily detected as it is associated with a large change in the mechanical properties.[10] DMA is a cost-effective alternative that involves assessing the change in molecular relaxation after a force has been applied as temperature changes.[14] As a function of temperature or frequency, DMA is a powerful technique for measuring the storage modulus (E′ ), loss modulus (E″ ), stiffness, glass transition temperature (Tg), and loss factor (tan δ ). Analysis of dynamic load bearing properties is more essential for different engineering applications. Tg is defined as the midpoint between the glassy and rubbery states of a polymer or polymer composite, since the change from the glassy state into a liquid or a rubbery state is gradual.[16] When using the DMA tool, it is common that Tg is the temperature at which the loss factor attains its maximum value.[17, 18]
In this work, nanocomposite films with different SWCNTs/PMMA ratios (0.5, 1.0, and 2.0 wt%) are prepared by using the casting solution technique. The effects of the SWCNTs/PMMA ratio on the structural and mechanical properties (E′ , E″ , stiffness, tan δ ) of the nanocomposite films are investigated. Moreover, the Tg values of the prepared films are also deduced. To the best of our knowledge, this is the first time that mechanical properties of nanocomposite films with different ratios of SWCNTs/PMMA in the PMMA matrix have been studied by using a dynamic mechanical analyzer.
Nanocomposite films of SWCNTs/PMMA with different SWCNTs concentrations were prepared using the solution casting method as discussed in our previous work.[5] Briefly, the PMMA solution was prepared by dissolving PMMA (Sigma Aldrich) in chloroform (Fluka) with weight ratio 1:27 with continuous stirring for 24 h. Nanocomposite films of SWCNTs/PMMA were prepared by adding the desired weight (wt) of SWCNTs powder (Chengdu Organic Chemicals Co. Ltd.) to the previous PMMA solution and stirring for 4 h in a magnetic stirrer. Then, the produced mixture was cast in Petri dishes and left in a ventilated fuming hood till it was completely dried and solidified. Nanocomposite films were obtained of x wt% of SWCNTs/PMMA (where x = 0.5, 1.0, and 2.0 wt%) in addition to a pure PMMA film. The dried films were reasonably homogeneous and clear.
2.2.1.Morphological and structural measurements
The morphology of SWCNT powder and SWCNTs/PMMA was measured by a high resolution transmission electron microscope (HRTEM) (JEOL JEM-2100 operated at 200 kV and equipped with a Gatan CCD higher resolution camera). The structural properties of SWCNT powder and nanocomposite films were investigated with an automated x-ray diffractometer (Bruker D8-advace diffractometer) with a Cu x-ray tube (wavelength: kα = 1.540598), the tube potential is 40 kV and the tube current is 40 mA.
2.2.2.Dynamic mechanical analysis (DMA) measurements
The mechanical properties of the prepared SWCNTs/PMMA nanocomposite films were measured by using a dynamic mechanical analyzer (TA instrument Q800). The tension mode was adjusted for our samples. In this mode, a frequency of 1 Hz of oscillation was applied, where the sample was placed in a tension between a fixed and moveable clamp using a film tension cantilever. A small static force of 0.01 N is applied in order to prevent the film from buckling. The films were cut into sections about 7 mm in width and ∼ 20 mm in length. The thickness of the films was about 0.5 mm. The sample was scanned over a temperature range from room temperature to 150 ° C. The heating ramp rate was 3 ° C/min for all measurements. The strain amplitude was 15 μ m. The mechanical properties for each film as a function of increasing temperature were recorded including: E′ , E″ , stiffness, and tanδ .
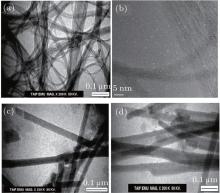
Figures 1(a) and 1(b) show a transmission electron microscope (TEM) micrograph and high resolution TEM micrograph of SWCNTs powder respectively, while figures 1(c) and 1(d) show the TEM micrographs of 1.0 wt% and 2.0 wt% ratio of SWCNTs/PMMA nanocomposite respectively by using JEOL JEM-2100 microscopy. The estimated outer diameter is about 2 nm and lengths of 5 μ m– 30 μ m. It is clearly observed that SWCNTs doped in PMMA are less fragmented than the powder case. This is due to the interactions with polymers as well as the fabrication method.
 | Fig. 1. (a) TEM image of SWCNT powder, (b) HRTEM image of SWCNT powder, (c) TEM image of 1.0 wt% SWCNTs/PMMA nanocomposite and (d) TEM image of 2.0 wt% SWCNTs/PMMA nanocomposite. |
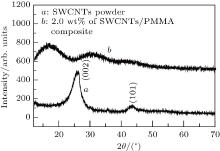
Figure 2 shows the x-ray diffraction (XRD) patterns of SWCNT powder and 2.0 wt% ratio of SWCNTs/PMMA nanocomposite film. It is clearly observed from curve a that there are two dominant diffraction peaks at 2θ = 26.6° and 43.45° corresponding to the hexagonal graphite structures of planes (002) and (101) respectively. Whereas, curve b confirms the amorphous nature of 2.0 wt% SWCNTs/PMMA nanocomposite film with broad diffraction peaks at 2θ = 17° and 32° corresponding to the PMMA matrix.[19] The absence of SWCNT diffraction peaks in the XRD of the nanocomposite film is mainly due to the homogeneous dispersion of SWCNTs in the PMMA matrix and the absence of SWCNT aggregation in the nanocomposite. Moreover, the low SWCNT weight percentages used in the composite may play a dominant role in this observation.[20] Similar results were obtained by others.[4, 20, 21] In our previous study, [4] we synthesized SWCNTs/TiO2 nanocomposite paste for photovoltaic applications. The characteristic peaks of SWCNTs at 2θ = 26.6° are also not observed in the XRD patterns of the SWCNTs/TiO2 nanocomposite. Furthermore, Oh and Cheng.[21] concluded the absence of multi walled CNT peaks in the XRD pattern of MWCNTs/TiO2 composite for photo-degradation activity.
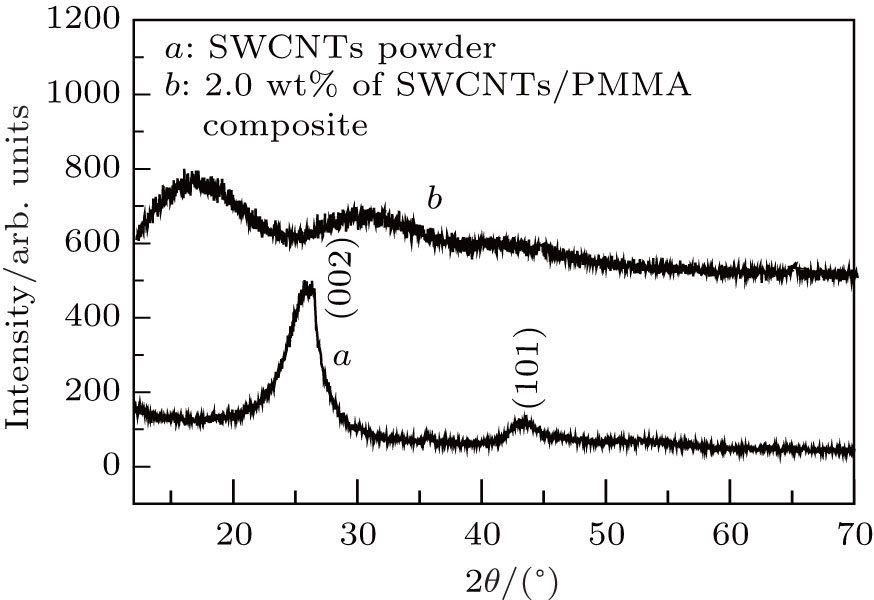 | Fig. 2. X-ray diffraction patterns of SWCNTs powder (curve a), and 2.0 wt% ratio (curve b) of SWCNTs/PMMA nanocomposite films. |
The dynamic mechanical properties (E′ , E″ , stiffness, and tan δ ) of pure PMMA film and SWCNTs/PMMA nanocomposite films are investigated by using a dynamic mechanical analyzer. DMA separates the dynamic mechanical response of the samples into two parts: the storage modulus (E′ ), which is an elastic part and related to the material stiffness and the stored energy; and the loss modulus (E″ ), which is the viscous part, and associated with the sample ability to dissipate mechanical energy by the cycle of motion. The dynamic (complex) modulus (E* = stress/strain) is given as:[22, 23]

where E′ = σ 0 cos(δ )/ε 0, and E″ = σ 0 sin(δ )/ε 0, with σ 0 and ε 0 being the stress and strain amplitudes respectively and δ being the angular shift between the stress and the corresponding strain. The tan δ (the loss factor) which is defined as the ratio of storage modulus to loss modulus per cycle of the applied force, and given as[14, 15, 22]

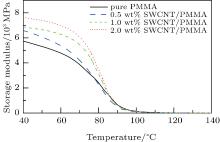
The curves of storage modulus (E′ ) versus temperature of pure PMMA film and nanocomposite films with different SWCNTs/PMMA ratios (0.5, 1.0, and 2.0 wt%), obtained from DMA measurements at 1-Hz frequency, are shown in Fig. 3. It is obviously seen that E′ depends on both temperature and the filler (SWCNTs). At any temperature, E′ values for nanocomposite films with all ratios of SWCNTs/PMMA are larger than E′ values of pure PMMA film. The increases of E′ values are mainly due to the decrease of vacancies in the nanocomposite films, [22] which leads to increases of the stiffness values of the nanocomposite films[6] as shown in Fig. 6. Moreover at up to 90-° C temperature, it is clearly seen that E′ values of the nanocomposite films increase as the SWCNTs/PMMA ratio increases to 2.0 wt%. This result can be explained as the fact that the quantity of SWCNTs increases, the volume of the vacancies and the free volumes decrease in the nanocomposite film. This makes the nanocomposite films denser and stiffer than that of pure PMMA film. Furthermore, at up to 70 ° C, E′ decreases slowly, and then decays sharply from 70 ° C to 90 ° C, which corresponds to the glass transition of the films to the rubbery state. This decrease in E′ is attributed to the energy dissipation phenomenon involving the cooperative motions of the polymer chains.[24] While more than 90 ° C, E′ for pure PMMA film and all nanocomposite films are approximately the same. Our result is in good agreement with other results.[24, 25] In our previous study, [5] we have studied the storage modulus of CdSe QDs/PMMA nanocomposite film using a DMA in temperature sweep mode. We conclude that at any temperature, E′ of the nanocomposite film is larger than that of pure PMMA film. The increase in E′ is due to the decrease in the free volume in the nanocomposite film. Sahooa et al.[25] showed that the modulus for MWCNTs/Polyurethane composites increases by 740% compared with that of pure polyurethane (PU). They attributed that to the strong interaction between the functionalized MWNTs and the PU matrix, thus strengthening the overall mechanical performance of the composite.
 | Fig. 3. Variations of storage modulus (E′ ) with temperature of pure PMMA film and nanocomposite films with different ratios (0.5, 1.0, and 2.0 wt%), obtained from DMA measurements at 1-Hz frequency. |
The loss modulus (E″ ) as a function of temperature of pure PMMA film and nanocomposite films with different SWCNTs/PMMA ratios (0.5, 1.0, and 2.0 wt%), at a frequency of 1 Hz is shown in Fig. 4. E″ is related to the dissipated energy in the films. It is clearly seen that E″ depends on the sweeping temperature and SWCNTs/PMMA ratio in the PMMA matrix. As the ratio of SWCNTs/PMMA in the PMMA matrix increases from 0 to 2.0 wt%, the maximum value of E″ is shifted to a higher temperature. This result may be due to the decrease in the vacancies and free volume as the filler (SWCNTs) ratio increases.[22]
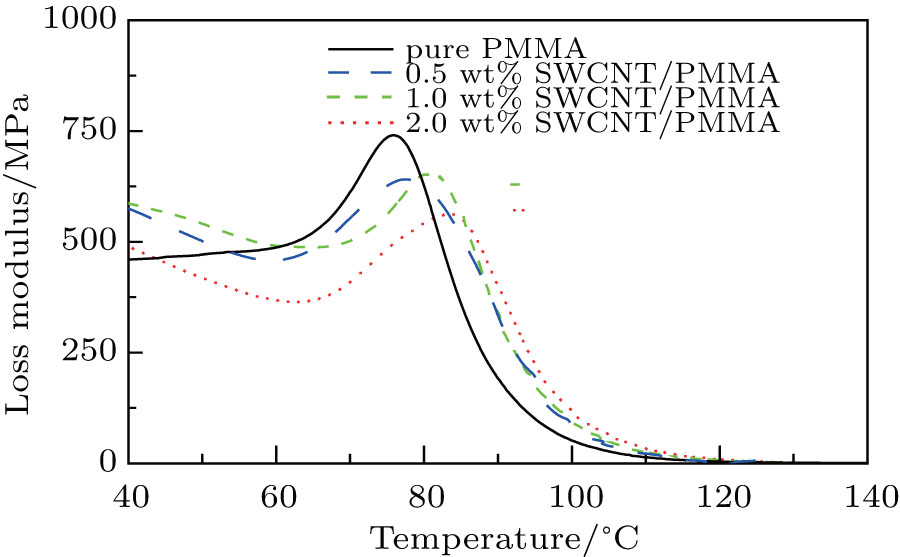 | Fig. 4. Curves of loss modulus (E″ ) versus temperature of pure PMMA film and nanocomposite films with different SWCNTs/PMMA ratios (0.5, 1.0, and 2.0 wt%), obtained from DMA measurements at 1 Hz frequency. |
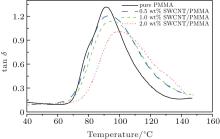
The loss factor (tan δ ) is defined as the ratio between the loss modulus (E″ ) and the storage modulus (E′ ). The temperature at which tan δ reaches its maximum value is called the glass transition temperature (Tg).[14] It is the temperature at which the polymers or composites transform from the glassy state to the rubbery state. Tg values of pure PMMA film and the nanocomposite films with different SWCNTs/PMMA ratios are deduced from the sweep temperature of the loss factor (tan δ ). Curves of tan δ versus temperature of the prepared pure PMMA and nanocomposite films, obtained from DMA measurements at 1-Hz frequency, are shown in Fig. 5. It is clearly noticeable that the magnitude of the tan δ peak of pure PMMA film is more than those of nanocomposite films with different SWCNTs/PMMA ratios. Also, as the SWCNTs/PMMA ratio increases from 0 to 2.0 wt%, the value of tan δ decreases from 1.32 to 1.01. The decrease in the tan δ value at its maximum peak represents the elastic character of the film, whereas the high value of tan δ shows the viscous character. This result implies that the mobilities of the PMMA molecules are drastically reduced after blending with SWCNTs. Moreover, the free volume and vacancies in SWCNTs/PMMA nanocomposite films are much smaller than that of pure PMMA film. This result is consistent with the data relating to E′ and E″ since tan δ = E” /E′ . Table 1 gives Tg values for pure PMMA film and nanocomposite films with different ratios of SWCNTs/PMMA. It has also been observed that Tg values of SWCNTs/PMMA nanocomposite film shift towards the higher temperature side with respect to pure PMMA film from 91.2 ° C to 99.5 ° C. Our results are in good agreement with other results.[22, 26] Sahooa et al.[25] showed that Tg values for MWCNTs/PU nanocomposite films increase from – 20 ° C to – 5 ° C.
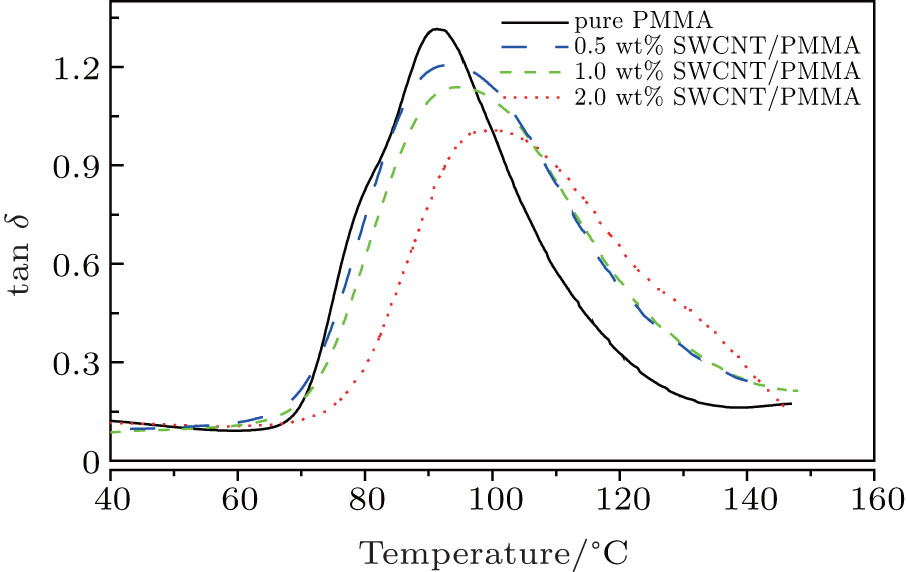 | Fig. 5. Variations of tan δ with the temperature of pure PMMA film and nanocomposite films with different ratios of SWCNTs/PMMA, obtained from DMA measurements at 1-Hz frequency. |
| Table 1. Glass transition temperature Tg values for pure PMMA film and nanocomposite films with different ratios of SWCNTs PMMA. |
The stiffness values of pure PMMA film and nanocomposite films with different ratios of SWCNTs/PMMA, obtained from DMA measurements at a frequency of 1 Hz is shown in Fig. 6. It is clearly seen that the stiffness depends on the temperature and the presence of SWCNTs. The stiffness values of nanocomposite films with different ratios of SWCNTs/PMMA are larger than those of pure PMMA films due to the decreases of vacancies and free volume in the matrix, since the addition of SWCNTs in the PMMA matrix restricts the mobility of the PMMA chain, which increases the stiffness values of the films. For example, at 60 ° C, the stiffness values of pure PMMA film and nanocomposite film with a SWCNTs/PMMA ratio of 2.0 wt% are 5.15 × 10⁵ N/m and 6.16 × 10⁵ N/m respectively. It is seen that the stiffness values of the nanocomposite films increase as the ratio of SWCNTs/PMMA in PMMA increases. This is due to the decrease in the free volume, since SWCNTs enter into the voids of the PMMA matrix.
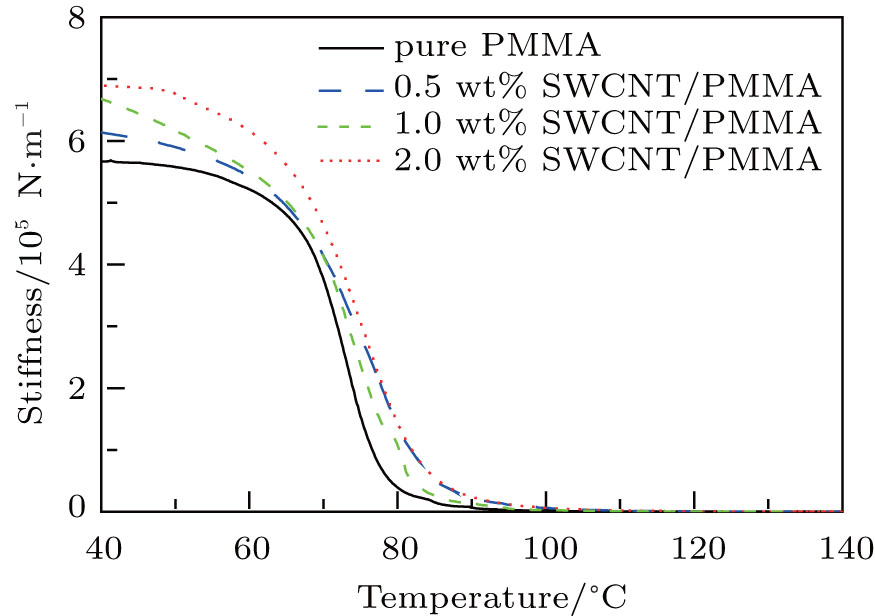 | Fig. 6. Varitions of stiffness value with temperature of pure PMMA film and nanocomposite films with different ratios of SWCNTs/PMMA, obtained from DMA measurements at 1-Hz frequency. |
Nanocomposite films with different SWCNTs/PMMA ratios (0.5, 1.0, and 2.0 wt%) are fabricated by using a casting technique. Morphological, structural and mechanical properties of the prepared nanocomposite films are investigated. The mechanical properties including storage moduli, loss moduli, tan δ values, and stiffness values of the nanocomposite films each as a function of temperature are recorded by using a dynamic mechanical analyzer at a frequency of 1 Hz. The storage moduli, loss moduli, and stiffness values are observed for different SWCNTs/PMMA ratios in the PMMA matrix each as a function of temperature and are compared with those of pure PMMA film. The intensity of the tan δ peak for pure PMMA film is larger than those of the nanocomposite films. Also, as the SWCNTs/PMMA ratio increases from 0 to 2.0 wt%, the value of tan δ decreases gradually from 1.32 to 1.01. It has also been observed that the Tg value of SWCNTs/PMMA nanocomposite film shifts towards the higher temperature side with respect to pure PMMA film from 91.2 ° C to 99.5 ° C as the SWCNTs ratio increases from 0 to 2.0 wt%.
We sincerely thank professor Hassan Talaat at Ain Shams University for the helpful and useful discussion.
| 1 |
|
| 2 |
|
| 3 |
|
| 4 |
|
| 5 |
|
| 6 |
|
| 7 |
|
| 8 |
|
| 9 |
|
| 10 |
|
| 11 |
|
| 12 |
|
| 13 |
|
| 14 |
|
| 15 |
|
| 16 |
|
| 17 |
|
| 18 |
|
| 19 |
|
| 20 |
|
| 21 |
|
| 22 |
|
| 23 |
|
| 24 |
|
| 25 |
|
| 26 |
|