


Quantitative calculation of reaction performance in sonochemical reactor by bubble dynamics
[Xu Zhenga), b) , Yasuda Keijib) , Liu Xiao-Jun†c)  ]
]
]
|
|


†Corresponding author. E-mail: liuxiaojun@nju.edu.cn
*Project supported by the National Natural Science Foundation of China (Grant Nos. 11404245, 11204129, and 11211140039).
In order to design a sonochemical reactor with high reaction efficiency, it is important to clarify the size and intensity of the sonochemical reaction field. In this study, the reaction field in a sonochemical reactor is estimated from the distribution of pressure above the threshold for cavitation. The quantitation of hydroxide radical in a sonochemical reactor is obtained from the calculation of bubble dynamics and reaction equations. The distribution of the reaction field of the numerical simulation is consistent with that of the sonochemical luminescence. The sound absorption coefficient of liquid in the sonochemical reactor is much larger than that attributed to classical contributions which are heat conduction and shear viscosity. Under the dual irradiation, the reaction field becomes extensive and intensive because the acoustic pressure amplitude is intensified by the interference of two ultrasonic waves.
Ultrasound and the ultrasonic effect have been widely investigated.[1– 6] Ultrasound irradiation at frequencies ranging from 20 kHz to a few MHz can result in a cavitation due to the sonochemical reaction.[1, 2] The cavitation is induced at acoustic pressure above the minimum pressure necessary to initiate bubble growth, i.e., the cavitation threshold. Cavitation bubbles are generated when the “ negative” pressure during the rarefaction phase of ultrasound is sufficiently large to disrupt the liquid.[3] Each bubble repeats expansion and contraction due to the acoustic cycle. Finally, the bubble undergoes an implosive collapse, and a high temperature and pressure field is generated by the adiabatic compression of the gas-phase inside bubbles. In this field, a solute in solution is decomposed at high temperature or reacts with radical species generated by the pyrolysis of the solute and the solvent.[4]
The sonochemical process offers various possibilities for industrial applications, for instance, chemical synthesis, extraction, crystallization, and nano-technology.[7] It is widely used in chemistry and chemical engineering because the operation is simple and safe, and secondary pollutants are difficult to form.[8] A major problem of designing sonochemical reactors is the non-uniform distribution of the reaction field which suppresses its reaction rate. This problem becomes serious in a large reactor for industrial applications.[9]
In order to extend the reaction field throughout the whole reactor, a superposition of ultrasonic fields by using multiple transducers has been widely investigated.[10– 14] Feng et al. reported that irradiation from three transducers at 28 kHz, 1 MHz, and 1.87 MHz enhanced the sonochemical reactions of potassium iodide and terephthalate ion.[11] Koda et al. investigated the effect of frequency on the sonochemical reaction rate of terephthalate ion. The frequencies of two transducers were individually changed from 176 kHz to 635 kHz, since the sonochemical reaction rate of potassium iodide by using one transducer had maximum values in a frequency range from 200 kHz to 600 kHz.[15] The sonochemical reaction rate had a maximum value when the frequencies of the bottom and side transducers were 422 kHz and 472 kHz, respectively.[14] The visualization of sonochemical reaction fields was also performed. A luminescence reaction of a luminal solution was employed, and the expansion of reaction fields was observed by dual irradiation. To evaluate the reaction performance of a sonochemical reactor, researchers are becoming more and more aware of the importance of the depiction of reaction fields. However, measurement of the reaction field is difficult. An ultrasonic hydrophone is damaged by cavitation. The quantitative analysis of reaction fields visualized by luminal solution is difficult.
Two factors are important to evaluate the performance of a sonochemical reactor: the area and the intensity of the reaction field. The area of reaction field is determined by the pressure distribution in a sonochemical reactor, which has been widely investigated.[16– 21] Klí ma et al. optimized the boundary conditions in a sonochemical reactor at 20 kHz.[16] To calculate the pressure distribution, Yasui et al.[17] and Servant et al.[18] suggested that the sound absorption coefficient of water in the sonochemical reactor was larger than the coefficient of classical absorption which is attributed to heat conduction and shear viscosity. The intensity of the reaction is determined by the temperature and the reactive species generated by a collapsed cavitation. The temperature in a cavitation bubble has been widely investigated: Flint and Suslick[22] experimentally analyzed the sonoluminescence spectra from silicone oil. Results indicated the cavitation temperature was about 5000 K during implosive collapse. Yasui numerically calculated the temperature variation with time inside a forced bubble.[23] One step more, a model to estimate the amount of chemicals generated in a bubble during the cavitation process was built.[24] From this model, it becomes possible to estimate the quantity of chemicals generated in a cavitation bubble by knowing external conditions. However, the distribution of generated chemicals in a sonochemical reactor has not been studied yet.
In this study, as a first step towards the development of a large sonochemical reactor with high generic efficiency, the reaction field in a rectangular sonochemical reactor with two ultrasonic transducers is estimated from the acoustic pressure distribution obtained by the numerical simulation. The effect of the number of transducers on the reaction field is investigated. The reaction field is compared with the experimental result reported in our previous paper.[14] The sound absorption coefficient in the reactor is evaluated. The vibration of the fountain is properly added to the calculation domain. One step more, the distribution of OH radical generated in this sonochemical reactor is estimated. The mechanism of the enhancement of the sonochemical reaction due to the irradiation from the dual transducer is discussed.
In order to calculate the acoustic pressure distribution in a sonochemical reactor, the inhomogeneous Helmholtz equation is used and written as

where p represents the acoustic pressure, and the angular frequency ω is defined as ω = 2 π f, with f being the ultrasonic frequency.
The acoustic absorption coefficient is not directly related to the physical properties of the medium. It can be expressed by the complex density ρ c and the complex sound speed cc:

Here, the complex wave number kc and the impedance Zc are shown as

where α is the absorption coefficient of the medium, cs and ρ 0 denote the sound speed in the medium and the density of the medium, respectively.
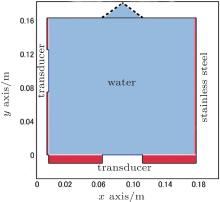
The geometry and subdomains for the numerical simulation are shown in Fig. 1. It is based on the reactor used in our experimental study.[14] The numerical simulation is performed in two dimensions because of the length of the required computational effort, i.e., a calculation element should be less than 1/10 of the ultrasonic wavelength (3.2 mm in water at 472 kHz) and thus the total number of elements in three dimensions becomes enormous. The reactor width and height are 0.175 m and 0.163 m, respectively. Two transducers each with a diameter of 0.050 m are located at the side and bottom walls of the reactor. Ultrasonic frequencies of the side and bottom transducers are 472 kHz and 422 kHz, respectively. The reactor is made of stainless steel, which acts as a linear elastic material in the model. The reactor walls are of stainless steel with density 7900 kg/m3, Young’ s modulus 1.1 × 10¹¹ Pa, and Poisson’ s ratio 0.31. Thickness values of the side and bottom walls are 0.002 m and 0.010 m, respectively. The density and the sound speed of the solution are considered to be those of water (density 1000 kg/m3 and sound speed 1500 m/s) since the concentration of the luminal in the aqueous solution is very low.[14]
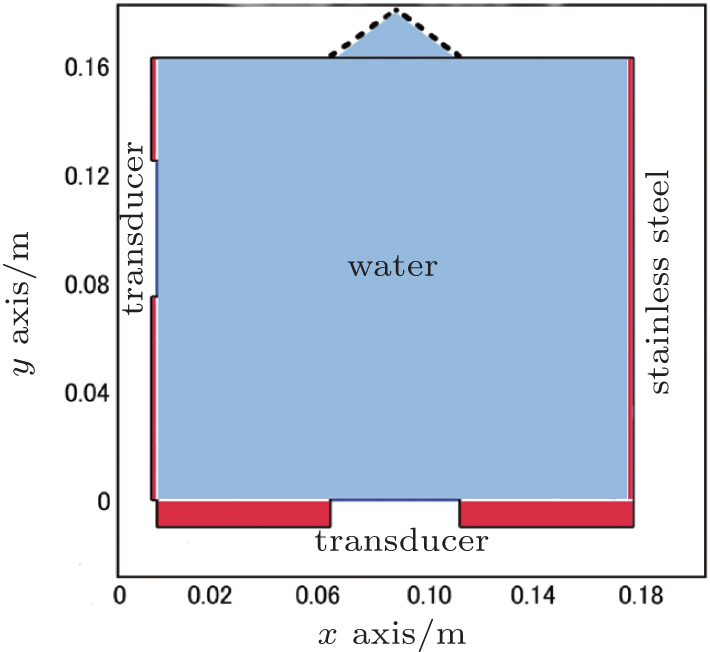 | Fig. 1. Geometry and subdomains for the numerical simulation. |
The boundary condition of transducer surfaces is determined by pressure. The pressure distribution is determined from previous experimental data.[25] Since the obtained point-by-point data are discontinuous, the Gaussian distribution is assumed to fit these data. The liquid surface acts as an impedance boundary, which indicates the reflection property at the interface between two materials. The boundary condition is written as

where Ze = ρ ece is the acoustic input impedance for the external domain, with ρ e and ce being the density and the sound speed of the external domain respectively.
The pressure distribution is calculated by using COMSOL MultiphysicsTM (COMSOL AB, Stockholm, Sweden). The mesh size is restricted within 0.3 mm. Triangle element is employed in the calculation. The degree of freedom in the model is 1.9 × 10⁶.
The visualization of the sonochemical reaction field has been carried out mostly by using the luminescence originating from the reaction between the luminol and the OH radical in an aqueous solution.[14, 17, 26] Luminescent sites in the sonochemical reactor correspond to places where the acoustic pressure amplitude is above the threshold for OH radical generation due to cavitation. According to the results carried out by Yasui et al., [27] the pressure amplitude for cavitation should be greater than the Blake threshold. In the present study, it is assumed that the reaction happens in the places where the acoustic pressure amplitude is above 1 × 10⁵ Pa.
Bubble dynamics induced by ultrasound is described by a revised Rayleigh-plesset equation:
where ρ L, σ , and η are the density of liquid (1 × 10³ kg/m3), surface tension (7.2 × 10− 2 N· m− 1), and viscosity (1 × 10− 3 Pa· s), respectively; c (1480 m/s) is the sound velocity in water; R is the bubble radius; t is the exciting time for ultrasound; Pt = [P0 − Pa sin(2π ft)] is the pressure outside of the bubble; P0 is the ambient pressure (1.013 × 10⁵ Pa); Pa and f are the exciting pressure and the ultrasound frequency, respectively; Pi is the bubble inner pressure, which is calculated from the Van der Waal’ s equation.
The calculation for the generation of chemicals in a cavitation bubble has been conducted by Yasui. The chemical equation is expressed as

Here a, b and m, n are the molecule numbers of A, B, M, and N respectively. Reaction rate (rγ f) in a unit time and unit volume is calculated from the following equation

Here kγ f = Aγ fTβ γ f exp(− Cγ f/T); Aγ f, β γ f, and Cγ f could be found elsewhere.[24] [A] indicates the concentration of material A. Backward reaction rate (rγ b) can be calculated in the same manner. Finally, the quantity of a specific material (nα ) is calculated as

where Σ (production) and Σ (destruction) are the quantity produced and the quantity destructed in a period of time (Δ t).
By the calculation results from FEM software, the pressure distribution in the sonochemical reactor is known. Consequently, the chemicals including OH radical generated in a cavitation bubble can be calculated according to Eqs. (6)– (8) by knowing ambient conditions and bubble initial radius. In this study, the ambient conditions are assumed to be the same as those in the experiment. The radii of initial bubbles radii (5 μ m) are all assumed to be 5 μ m, i.e., initial bubbles are assumed to be uniformly sized in reactor.
From the above calculation, it becomes possible to determine the generation of OH radical in a cavitation bubble. In order to calculate the OH radical generation in a unit volume, the bubble volume fraction should be determined. The assumption of a linear relation between the ultrasonic pressure and the bubble volume fraction has been widely used.[28– 30] Here, the same assumption as that in Ref. [30] is made:

where β represents the volume fraction of the cavitation bubble. Therefore, by a known distribution of ultrasonic pressure, the density of the cavitation bubble could be calculated.
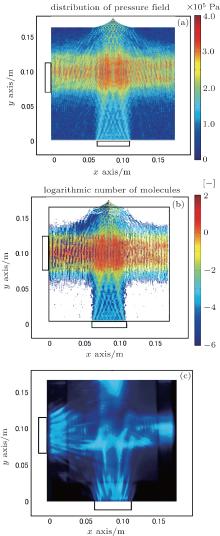
The pressure distribution induced by irradiation from the side transducer is numerically simulated. Figure 2(a) shows the numerical result for irradiation from the side transducer at 472 kHz. The sound absorption coefficient is 1.0 m− 1. It is observed that the pressure field induced by irradiation from the side transducer is a standing wave field. The wavelength of the standing field (∼ 1.5 mm) is half the emitted ultrasonic wave length. The distribution of OH radical generated by irradiation from the side transducer is calculated. The result is shown in Fig. 2(b). Since the number of OH radicals is in a wide range, a denary logarithm is used to express the number of OH radicals in the figure. The luminescence is induced by the reaction between the luminal and the OH radicals.[26] Therefore, the reaction intensity could be estimated by the generated OH radicals. In Fig. 2(b), the white areas in the reactor indicate the unreacted regions. For comparison, figure 2(c) shows the photograph of sonochemical luminescence for irradiation from the side transducer in our previous paper.[14] The bright areas are attributed to the sonochemical luminescence and indicate the reaction fields. The brightness of the reaction field indicates the reaction intensity. It could also be observed from Fig. 2(b) that the field with high OH radical generation is similar to the reaction field with high intensity in Fig. 2(c). However, it is deemed that the reaction intensity also relates to the maximum temperature during the contraction of cavitation bubble and the concentration of luminal solution.
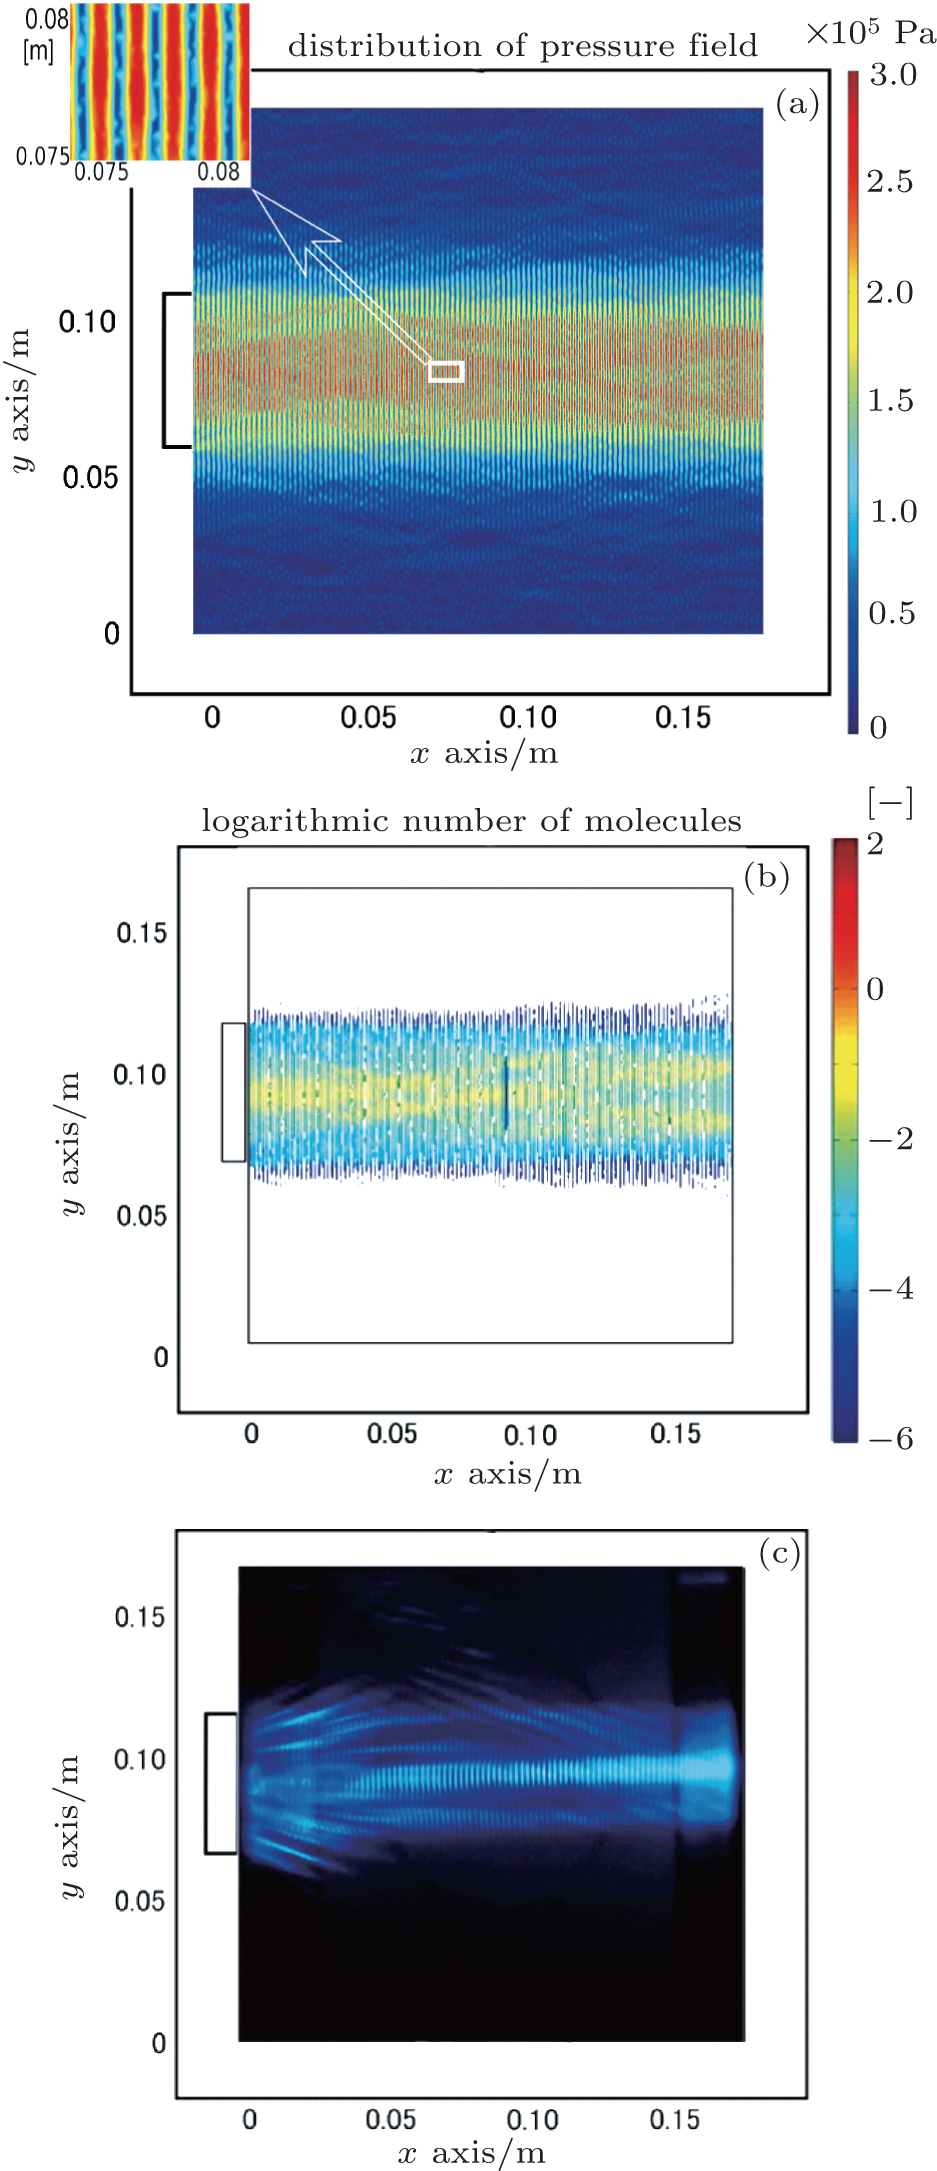 | Fig. 2. Reaction fields in sonochemical reactor for irradiation from the side transducer at 472 kHz. (a) Pressure distribution, (b) distribution of OH radical generation, and (c) photograph of sonochemical luminescence. |
To quantify the reaction regions obtained by the simulation and the experiment, the reaction area ratio is defined as the ratio of the reaction area to the reactor area (0.175 m × 0.163 m). Figure 3 shows the plots of the absorption coefficient in water versus reaction area ratio, obtained by the numerical simulation. The horizontal line indicates the reaction area ratio of the experiment (Fig. 2(c)). Here, it can be observed that with the increase in the absorption coefficient, the reaction area decreases.
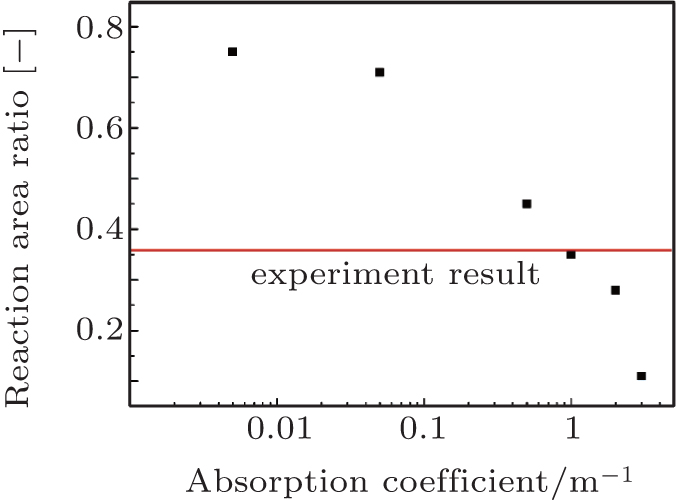 | Fig. 3. Plots of reaction area ratio versus acoustic absorption coefficient, obtained from numerical simulation. The side transducer is used. |
When the absorption coefficient is set to be 1.0 m− 1, the reaction area ratio is consistent with the result obtained by the experiment. By comparing the numerical results with the experimental results as shown in Figs. 2(b) and 2(c), it could be found that the distributions of the reaction fields are very similar.
Burton has measured the absorption coefficient of water by optical diffraction.[31] Ultrasound with low acoustic pressure, which is far below the cavitation threshold, irradiates into degassed water. The absorption coefficient at 500 kHz is found to be 0.005 m− 1. In this case, the absorption of acoustic energy is caused by the heat conduction and the shear viscosity in water[32] and referred to as the classical absorption. On the other hand, the air-saturated water is used, and the cavitation bubbles are generated by ultrasound irradiation with high acoustic pressure in our experiment.[14] The increase of the absorption coefficient in the sonochemical reactor is ascribed to the dynamics of cavitation bubbles, such as the generation, oscillation, and implosion: it transfers the ultrasonic energy into cavitation bubbles, thus inducing the sonochemical reaction. Therefore, the absorption coefficient with cavitation bubbles is much larger than that without cavitation bubbles.
The increase of the absorption coefficient has been discussed by a few researchers. Dä hnke et al.[28] considered that the absorption coefficient in the sonochemical reactor at 23 kHz should be 0.5 m− 1– 5 m− 1. Yasui et al.[17] thought that the absorption coefficient should be 5 m− 1 for the sonochemical reactor at 100 kHz. In our previous research, [33] the liquid flow distribution in the sonochemical reactor at 500 kHz has been numerically simulated. By the comparison between the simulation and the experiment results, the absorption coefficient is obtained to be 1 m− 1. This value is in accordance with the result obtained from the present study.
Figure 4(a) shows the pressure distribution estimated from the numerical simulation for irradiation from the bottom transducer at 422 kHz. The sound absorption coefficient is 1.0 m− 1. Figure 4(b) shows the distribution of OH radical generation for irradiation from the bottom transducer. For comparison, figure 4(c) shows the photograph of sonochemical luminescence for irradiation from the bottom transducer. When the bottom transducer is used, a formation of a fountain can be observed on the surface of the liquid. Therefore, to simulate the pressure distribution in a sonochemical reactor with irradiation from the bottom transducer, the shape and the fluctuation of the fountain should be taken into account. By measurement, the radius and height of the fountain are set to be 0.0225 m and 0.0170 m, respectively. In order to simulate the vibration of the fountain, the fountain shape is set as a Bezier curve and its heights are set to be 0.0170, 0.0161, 0.0152, and 0.0143 m. These values correspond to the distances of (46 + 3/4) λ , (46 + 1/2) λ , (46 + 1/4) λ , and 46 λ from the transducer plate to the liquid surface, respectively. Here, λ is the wavelength of the ultrasonic wave. Acoustic pressure distributions for four fountain heights are averaged, and the pressure distribution is estimated as shown in Fig. 4(a). It could be observed that the distribution of reaction field by the simulation is quite similar to that by the experiment. The reaction area ratio obtained from the simulation is 0.29, which is in excellent agreement with the experimental value (0.29). By the comparison of Fig. 4(c) with Fig. 2(b), it can be found that the OH radical generation with bottom irradiation is lower than that with side irradiation.
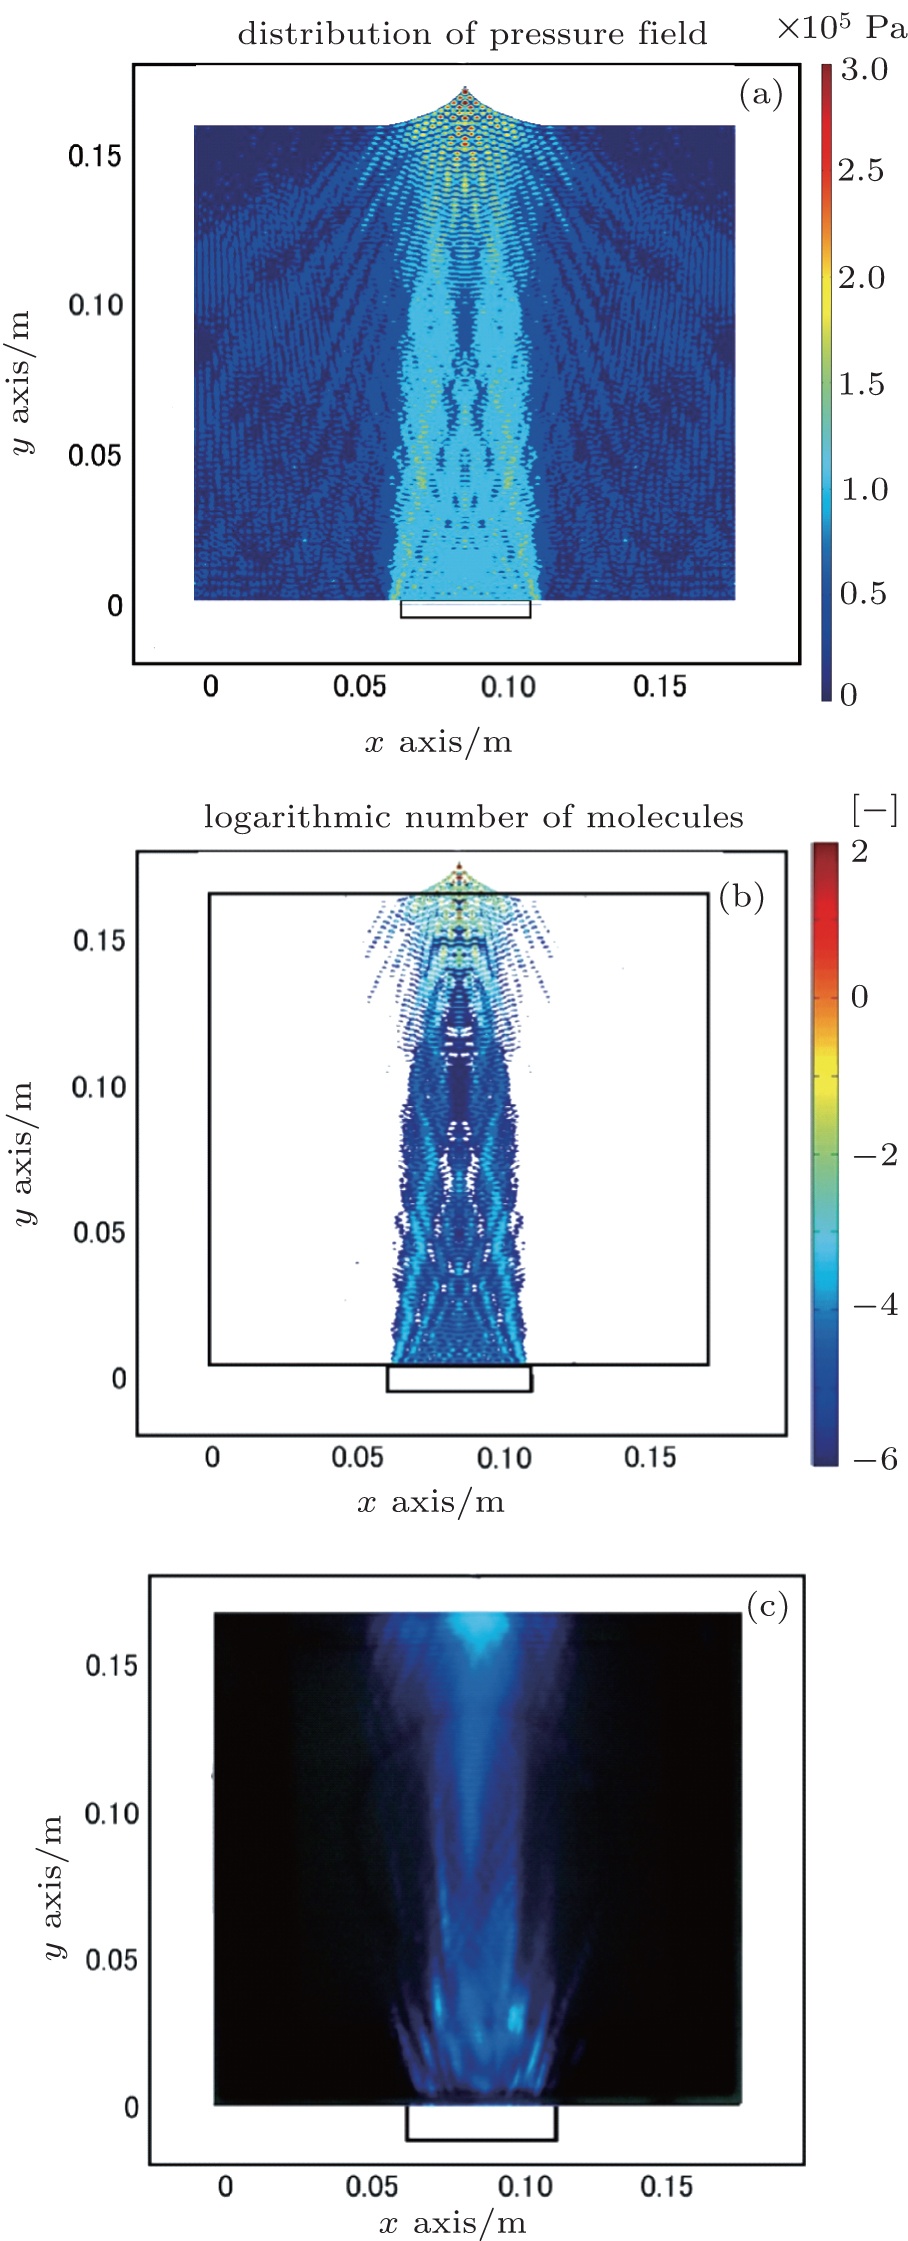 | Fig. 4. Reaction fields in sonochemical reactor for irradiation from the bottom transducer at 422 kHz. (a) Pressure distribution, (b) distribution of OH radical generation, and (c) photograph of sonochemical luminescence. |
Experimentally, it has been reported that the sonochemical reaction rate for irradiation from the bottom transducer was lower than that from the side transducer.[14] In the case of irradiation from the bottom transducer, it becomes obvious that ultrasonic waves are scattered at the fountain surface, and the reaction areas become smaller. In addition, the liquid surface should vibrate due to acoustic radiation force and liquid flow, and then the vibration of the liquid surface hinders the formation of standing waves. On the other hand, for the case of irradiation from the side transducer, standing waves are easy to form because of the reflection from the flat surface of stainless steel. Since the cavitation bubbles are gathered at antinodes of standing waves by the primary Bjerknes force, the sonochemical reaction intensively takes place there.[3] For irradiation from the bottom transducer, unstable standing waves are difficult to trap cavitated bubbles, and therefore the sonochemical reaction performance is low.
In our previous study, a sonochemical reactor with two transducers was used. The frequencies of the bottom and side transducers are 422 kHz and 472 kHz, respectively. The reaction rate for dual irradiation is higher than the sum of the reaction rates for single irradiations from the side and the bottom. The synergistic effect of sonochemical reaction appears for dual irradiation.[14]
In order to clarify the mechanism of the synergistic effect due to dual irradiation, reaction fields in this sonochemical reactor are investigated. The absorption coefficient is set to be 1.0 m− 1. The fountain size is the same as that in Fig. 4(a) because it is induced by the acoustic radiation force.[34] The acoustic radiation force generated from the side transducer has little effect on the fountain. Figure 5(a) shows the pressure distribution estimated by the numerical simulation. The distribution of OH radical generated from dual irradiation is shown in Fig. 5(b). The reaction area ratio is 0.67. For comparison, figure 5(c) shows the photograph of sonochemical luminescence for dual irradiation.[14] The reaction area ratio is 0.77. Reaction fields obtained from the numerical simulation are similar to those obtained in the experiment.
 | Fig. 5. Reaction fields in the sonochemical reactor for irradiation from the bottom (472 kHz) and side (422 kHz) transducers. (a) Pressure distribution, (b) distribution of OH radical generation, and (c) photograph of sonochemical luminescence. |
In the numerical simulation, the reaction area ratio for dual irradiation (0.67) is larger than the sum of the reaction area ratios for single irradiations from the side (0.35) and the bottom (0.29). This is because the amplitude of acoustic pressure in the reactor increases due to the interference of ultrasonic waves, and it exceeds the threshold of the reaction around the intersection part of dual irradiation.
Moreover, it can be observed from Fig. 5(b) that the OH radical generation at the intersection part increases by dual irradiation, which is due to the increase of pressure amplitude, so that the reaction field becomes more intensive. It should be noted that the increase of pressure amplitude may result in the decrease of the OH radical generation: by the calculation from Yasui, the generated chemicals may decrease due to the increase of ultrasound amplitude at a pressure of around 2 × 10⁵ Pa and frequency of 20 kHz. However, this phenomenon is not observed in a high frequency case (300 kHz and 1000 kHz).[35] From calculation, the total numbers of OH radicals generated by the irradiation from bottom, side, and dual transducers are 406800, 510130, and 1201740, respectively. Therefore, the irradiation from the dual is more efficient than the sum of irradiation from the bottom and side transducers.
It should be noted that the reaction area ratio obtained in the experiment is slightly larger than that obtained from the numerical simulation. It is considered that this difference is caused by the liquid flow in the reactor. The sonochemical reaction is enhanced by the liquid flow[33, 36] since the liquid flow prevents the cavitation bubbles from aggregating, and supplies the acoustic field to reactants and bubble nuclei. In the case of dual irradiation, the liquid flow should be stronger than that for single irradiation due to the superposition of acoustic pressure.
From this study, it becomes possible to estimate the reaction field in the sonochemical reactor for single irradiation from side, bottom, and dual irradiations. The liquid flow in the reactor should be examined in the near future. Through such studies, we hope to design a sonochemical reactor with high reaction efficiency.
The reaction field in the sonochemical reactor has been studied by the numerical simulation. The influences of the location and the number of transducers are examined. The reaction field estimated from the numerical simulation is in agreement with that obtained in experiment. The following points are clarified:
(i) the absorption coefficient in a sonochemical reactor is much greater than classical absorption coefficient; (ii) for the irradiation from the bottom transducer, the vibration of the liquid surface should be added to the geometry of the calculation domain; (iii) for dual irradiation, reaction fields become extensive and intensive because the acoustic pressure amplitude increases by interference of ultrasonic waves.
| 1 |
|
| 2 |
|
| 3 |
|
| 4 |
|
| 5 |
|
| 6 |
|
| 7 |
|
| 8 |
|
| 9 |
|
| 10 |
|
| 11 |
|
| 12 |
|
| 13 |
|
| 14 |
|
| 15 |
|
| 16 |
|
| 17 |
|
| 18 |
|
| 19 |
|
| 20 |
|
| 21 |
|
| 22 |
|
| 23 |
|
| 24 |
|
| 25 |
|
| 26 |
|
| 27 |
|
| 28 |
|
| 29 |
|
| 30 |
|
| 31 |
|
| 32 |
|
| 33 |
|
| 34 |
|
| 35 |
|
| 36 |
|