Analysis of gain distribution in cladding-pumped thulium-doped fiber laser and optical feedback inhibition problem in fiber-bulk laser system
[Ji En-Cai† , Liu Qiang, Hu Zhen-Yue, Gong Ma-Li]
, Liu Qiang, Hu Zhen-Yue, Gong Ma-Li]
|
|


†Corresponding author. E-mail: qiangliu@mail.tsinghua.edu.cn
*Project supported by the National Natural Science Foundation of China (Grant No. 61275146), the Research Fund for the Doctoral Program of Higher Education of China (Grant No. 20120002110066), and the Special Program of the Co-construction with Beijing Municipal Government of China (Grant No. 20121000302).
The steady-state gain distribution in cladding pumped thulium-doped fiber laser (TDFL) is analytically and numerically solved based on the rate equations including loss coefficients and cross relaxation effect. With the gain curve, a problem, which is named optical feedback inhibition (OFI) and always occurs in tandem TDFL-Ho:YAG laser system, is analyzed quantitatively. The actual characteristics of output spectra and power basically prove the conclusion of theoretical analysis. Then a simple mirror-deflected L-shaped cavity is employed to restrain the external feedback and simplify the structure of fiber-bulk Ho:YAG laser. Finally, 25 W of 2097-nm laser power and 51.2% of optical-to-optical conversion efficiency are obtained, and the beam quality factor is less than 1.43 obtained by knife-edge method.
Laser emissions near 2.1 μ m based on holmium-doped gain medium can make tremendous contributions to many fields, for its human eye-safety, high atmosphere transmittance, and special spectral characteristics, [1] such as the laser radar system, [2] including Doppler coherent wind radar, and differential absorption radar; the medical applications[3] in surgery through silica fiber conduction, or serving as a light source of endoscopic laser system; the pump source for optical parametric oscillator (OPO) to obtain mid-infrared even THz laser.[4] Currently, the most effective way to obtain high power 2.1-μ m laser is in-band-pumped un-sensitized holmium-doped bulk with a thulium-doped fiber laser (TDFL), namely hybrid fiber-bulk laser, [5] for its low quantum defect, lessened thermal loading, reduced up-conversion probability, elimination of energy transfer, and high extraction efficiency.[5, 6] Meanwhile, a very important research direction for 2.1-μ m laser is to realize a moderately high repetition frequency (> 0.5 kHz), high energy (> 100 mJ), and narrow pulse output by Q-switched technology.[7, 8] As the power scaling of laser diode cladding-pumped TDFL, [9– 11] more than 1-kW continuous laser output has been obtained.[11] Recently, we also obtained 227 W of output power in TDFL centered at 1908 nm.[12]
However, when TDFL pumped a holmium bulk, we observed the output ability of TDFL was severely influenced by the vertically back reflection from subsequent mirrors. We name this problem optical feedback inhibition (OFI), and it may be similar to parasitic lasing (PL) also resulting from back reflection. Although parasitic lasing mostly occurs in high power or Q-switched high gain laser system, like slab laser, thin-disk laser or fiber amplifier, [13– 18] and can make optical damage with spectrally bright and small spatial divergent beam, to date, no direct evidence has indicated that OFI can make optical damage and we have not observed the temporal spikes with InGaAs detector either. We still speculate that the OFI problem is one type of PL, dissimilar to an amplified spontaneous emission (ASE), with two basic phenomena: the backward spectrum is sharp and the gain is clamped around 1987 nm. Although the back reflection between optical surfaces is very common for laser design and easy to avoid, no one has paid enough attention to the OFI problem and analyzed it concretely.
In this paper, we attempt to theoretically expound the mechanism of OFI based on the analysis of gain distribution in cladding-pumped TDFL and adopt a simple mirror-deflected L-shaped cavity for Ho:YAG laser to easily avoid OFI problem.
The rate equations of cladding-pumped TDFL as given in Eq. (1), are based on Jackson’ s and Frith’ s models.[19, 20] We have proven the effectiveness of Jackson’ s model in previous work under different approximation conditions.[12, 21, 22] Similarly, we neglected the effects from ASE, excited state absorption (ESA), and energy transfer up-conversion (ETU), and assumed that the length of cavity was the same as that of the gain fiber. But here in the present paper, the expression of cross relaxation is the same as that from Frith’ s model, [20] and we only consider the spontaneous lifetimes to simplify the equations.
where τ 3, τ 2, and τ 1 are the spontaneous lifetimes of 3H4, 3H5, and 3F4 levels, respectively; N0(z, t), N1(z, t), N2(z, t), and N3(z, t) are the population densities of 3H6, 3F4, 3H5, 3H4 levels, respectively, Ntot is the Tm3+ dopant concentration distribution and set to be a constant; CR1 refers to the cross relaxation term; W03(z) is the pumping rate from 3H6 to 3H4, S10(z) is the stimulated emission rate from 3F4 to 3H6, S01(z) is the stimulated absorption rate from 3H6 to 3F4.
The expressions of CR1, W03(z), S10(z), and S01(z) are given as follows:
where kCR1 is the cross relaxation rate; nTm is the Tm3+ concentration corresponding to 1-wt% dopant situation; h is the Planck constant; c is the light speed in vacuum; λ p and λ s are the wavelengths of pump light and signal light in vacuum, respectively; Aclad and Acore are the cross-section areas of inner cladding and fiber core, respectively, Aeff is the effective mode area; Γ p = Aclad/Acore and Γ s = Aeff/Acore are the pump and signal power filling factors in fiber core, respectively; σ a(λ p) and σ a(λ s) are the absorption cross sections of pump light and signal light, respectively; σ e(λ s) is the emission cross section of signal light; Pf(z) and Pr(z) are the forward pump power and reverse pump power at position z respectively; Sf(z) and Sr(z) are the forward signal power and reverse signal power at position z respectively.
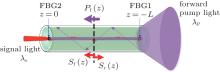
Considering only forward pumping condition as shown in Fig. 1, and choosing the position of fiber Bragg grating 2 (FBG2) as origin, the steady-state analytical solution is obtained as follows:
 | Fig. 1. Schematic diagram of the light propagation in double-clad thulium-doped fiber (TDF) with forward pumping way. |
where B1 is related to the cross relaxation; B2 and B3 are related with the transition rates; B1, B2, and B3 are expressed as
Meanwhile, the power distributions of pump light and signal light along the fiber length are shown below
where α (λ p, z) is the total pump absorption coefficient of gain fiber at position z, g (λ s, z) is the total signal gain coefficient of gain fiber at position z, and α (λ p, z), g(λ s, z) are expressed as
where δ (λ p) and δ (λ s) are the intrinsic absorption of pump light and signal light by the host glass, respectively.
The boundary conditions of Eq. (5) are given as follows:
where Pin is the input pump power; R1(λ p) and R2(λ s) are the reflectivities of FBG1 and FBG2 at wavelength of signal light, respectively.
The single-pass gain spectrum is equal to the integration of gain coefficient along the whole active fiber as shown below

where G(λ , L) is the single-pass total gain at wavelength of λ .
To obtain the g(λ , z) and G(λ , L), we can solve Eq. (5) numerically based on Eqs. (3), (4), (6)– (8) with the function bvp4c in Matlab software. The simulation parameters are listed in Table 1, the emission cross section σ e(λ ) and absorption cross section σ a(λ ) of TDF pumped by 790-nm LDs are cited from the paper by Jackson and King.[19]
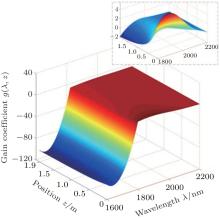
The distribution of steady-state gain coefficient g(λ , z) in TDFL versus position z and wavelength λ is shown in Fig. 2. And in a wavelength range between 1800 nm and 2200 nm, a detailed view is shown at the upper right. The gain cutoff wavelength λ gc is around 1847 nm, and g(λ , z) decreases gradually along the forward pump light direction.
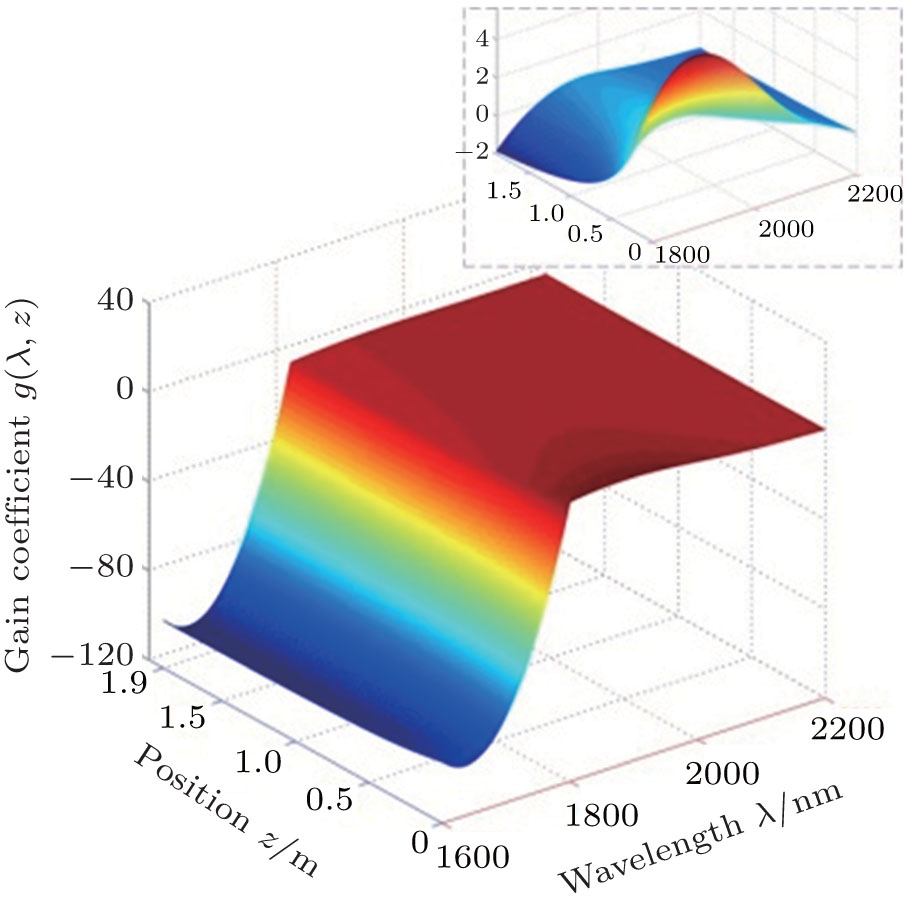 | Fig. 2. Distribution of gain coefficient g(λ , z) in cladding-pumped TDFL when Pin = 34 W and L = 1.9 m. |
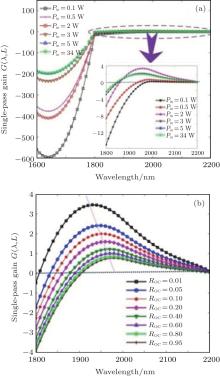
Meanwhile, the distribution of steady-state single-pass gain G(λ , L) under several conditions is shown in Fig. 3. The first group of G(λ , L) is obtained with six different input pump powers as indicated in Fig. 3(a), and G(λ , L) changes significantly when Pin < 5 W, but becomes steady when Pin ≥ 5 W. The peak gain wavelength λ gp is around 1950 nm and the 3-dB gain width is about 150 nm when Pin = 34 W. The second group of G(λ , L) is obtained with eight different reflectivities of FBG2 as shown in Fig. 3(b). The gain cutoff wavelength λ gc and peak gain wavelength λ gp will both have red shift with the increase of Roc(λ s), namely λ gc = 1808 nm, λ gp = 1930 nm when Roc(λ s) = 1% and λ gc = 1905 nm, λ gp = 1980 nm when Roc(λ s) = 95%. Apparently, high reflectivity of FBG2 is bad for the output of 1908-nm signal light.
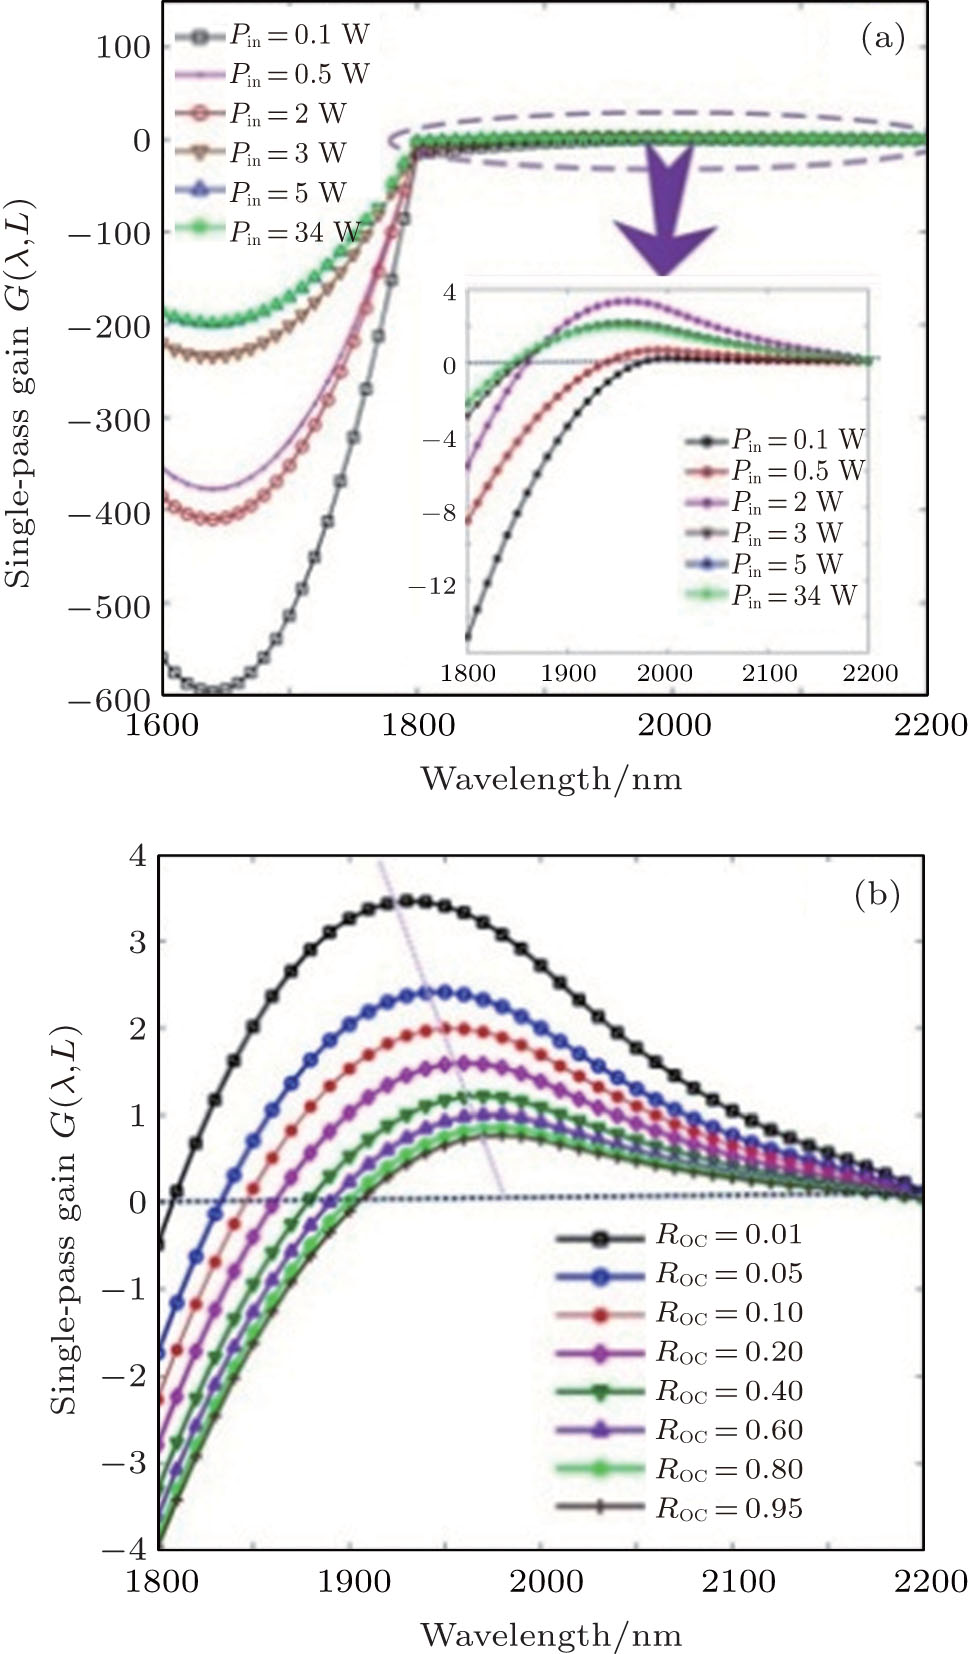 | Fig. 3. Distributions of single-pass gain G (λ , L) in cladding-pumped TDFL when L = 1.9 m. (a) G (λ , L) under six different pump powers: Pin = 0.1 W, 0.5 W, 2 W, 3 W, 5 W, and 34 W; (b) G(λ , L) with eight different reflectivities of output mirror: Roc (λ s) = 0.01, 0.05, 0.10, 0.20, 0.40, 0.60, 0.80, 0.95. |
| Table 1. Simulation parameters used in the calculation of gain distribution in TDFL. |
The theoretical output power of TDFL is compared with our experimental results under eight different situations, as shown in Table 2. Considering the fact that the relative error is roughly reasonable, the above theory model is effective to predict the output capacity of cladding-pumped TDFL.
| Table 2. Comparisons between experimental and theoretical output powers with different gain fiber lengths. |
Figure 4(a) shows the detailed schematic diagram for the light transmission with OFI and figure 4(b) shows a simplified one. The detailed parameters of TDFL will be described in the next section. With 34 W of 793-nm pump power, the output from TDFL is about 8 W measured at the position between dichroic mirror and M2. When the mirror M2 (AR@ 1908 nm & HR@ 2.1 μ m) is placed into the laser path and its surface is precisely perpendicular to the 1908-nm light, we observe that the transmitted laser power of M 2 drops down to zero through repeated experiments, and the transmitted power increases quickly to about 7.4 W if we deflect the mirror M2 smoothly.
It is not easy to understand OFI problem if we figure that only a little 1908-nm signal laser is reflected by M2, because there seems to be no emerging mode taking part in the mode competition. First, we consider the signal light reflectivity of M2 resulting in the OFI problem. The mirror M2 and FBG1 constitutes a new cavity, a three-mirror cavity, in Fig. 4(b). So the FBG2 and M2 could be equivalent to an output mirror with considering only the 1908-nm signal light reflectivity of M2, and the total reflectivity Roc(λ s) is expressed as follows:

According to the above analysis of gain distribution in Fig. 3(b), the increased reflectivity of output coupler is bad for the output of 1908-nm laser, but unless Roc(λ s) changes a lot, the oscillation of TDFL should not stop. For example, assuming RM(λ s) = 8%, then Roc(λ s) = 16.5%, we can obtain a 12.4-W output power based on the above model, which has little effect on output capacity. So the OFI problem cannot be explained by considering only the signal light reflectivity of M2.
 | Fig. 4. Schematic diagram of the light transmission with OFI. (a) Detailed diagram; (b) simplified one. |
In essence, the cavity chooses the oscillating modes through mode competition process from the much wider fluorescence spectrum, so we may take the emission spectrum, gain distribution, and coating characteristics of M2 as entry points to understand how the feedback light stops the TDFL oscillating. Generally, spontaneous emission is continuously generated once the active cavity is excited. A narrow linewidth feedback light around 1908 nm is obtained when spontaneous emission field passes through FBG2, and the cavity will not oscillate unless it obtains another stronger feedback light from M2, which has the absolute competitive edge to encroach on the most of population inversion, causing the 1908-nm signal light to be unable to obtain enough gain to overcome the loss. The another stronger feedback light is related to the special coating characteristics of M2, because the OFI problem will disappear, with any optical elements singly anti-reflected at 1908 nm.
A simple quantitative calculation is conducted to understand this process better based on the above gain distribution in TDFL, and the calculated results are shown in Fig. 5.
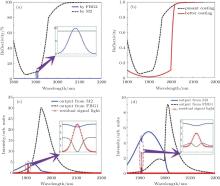
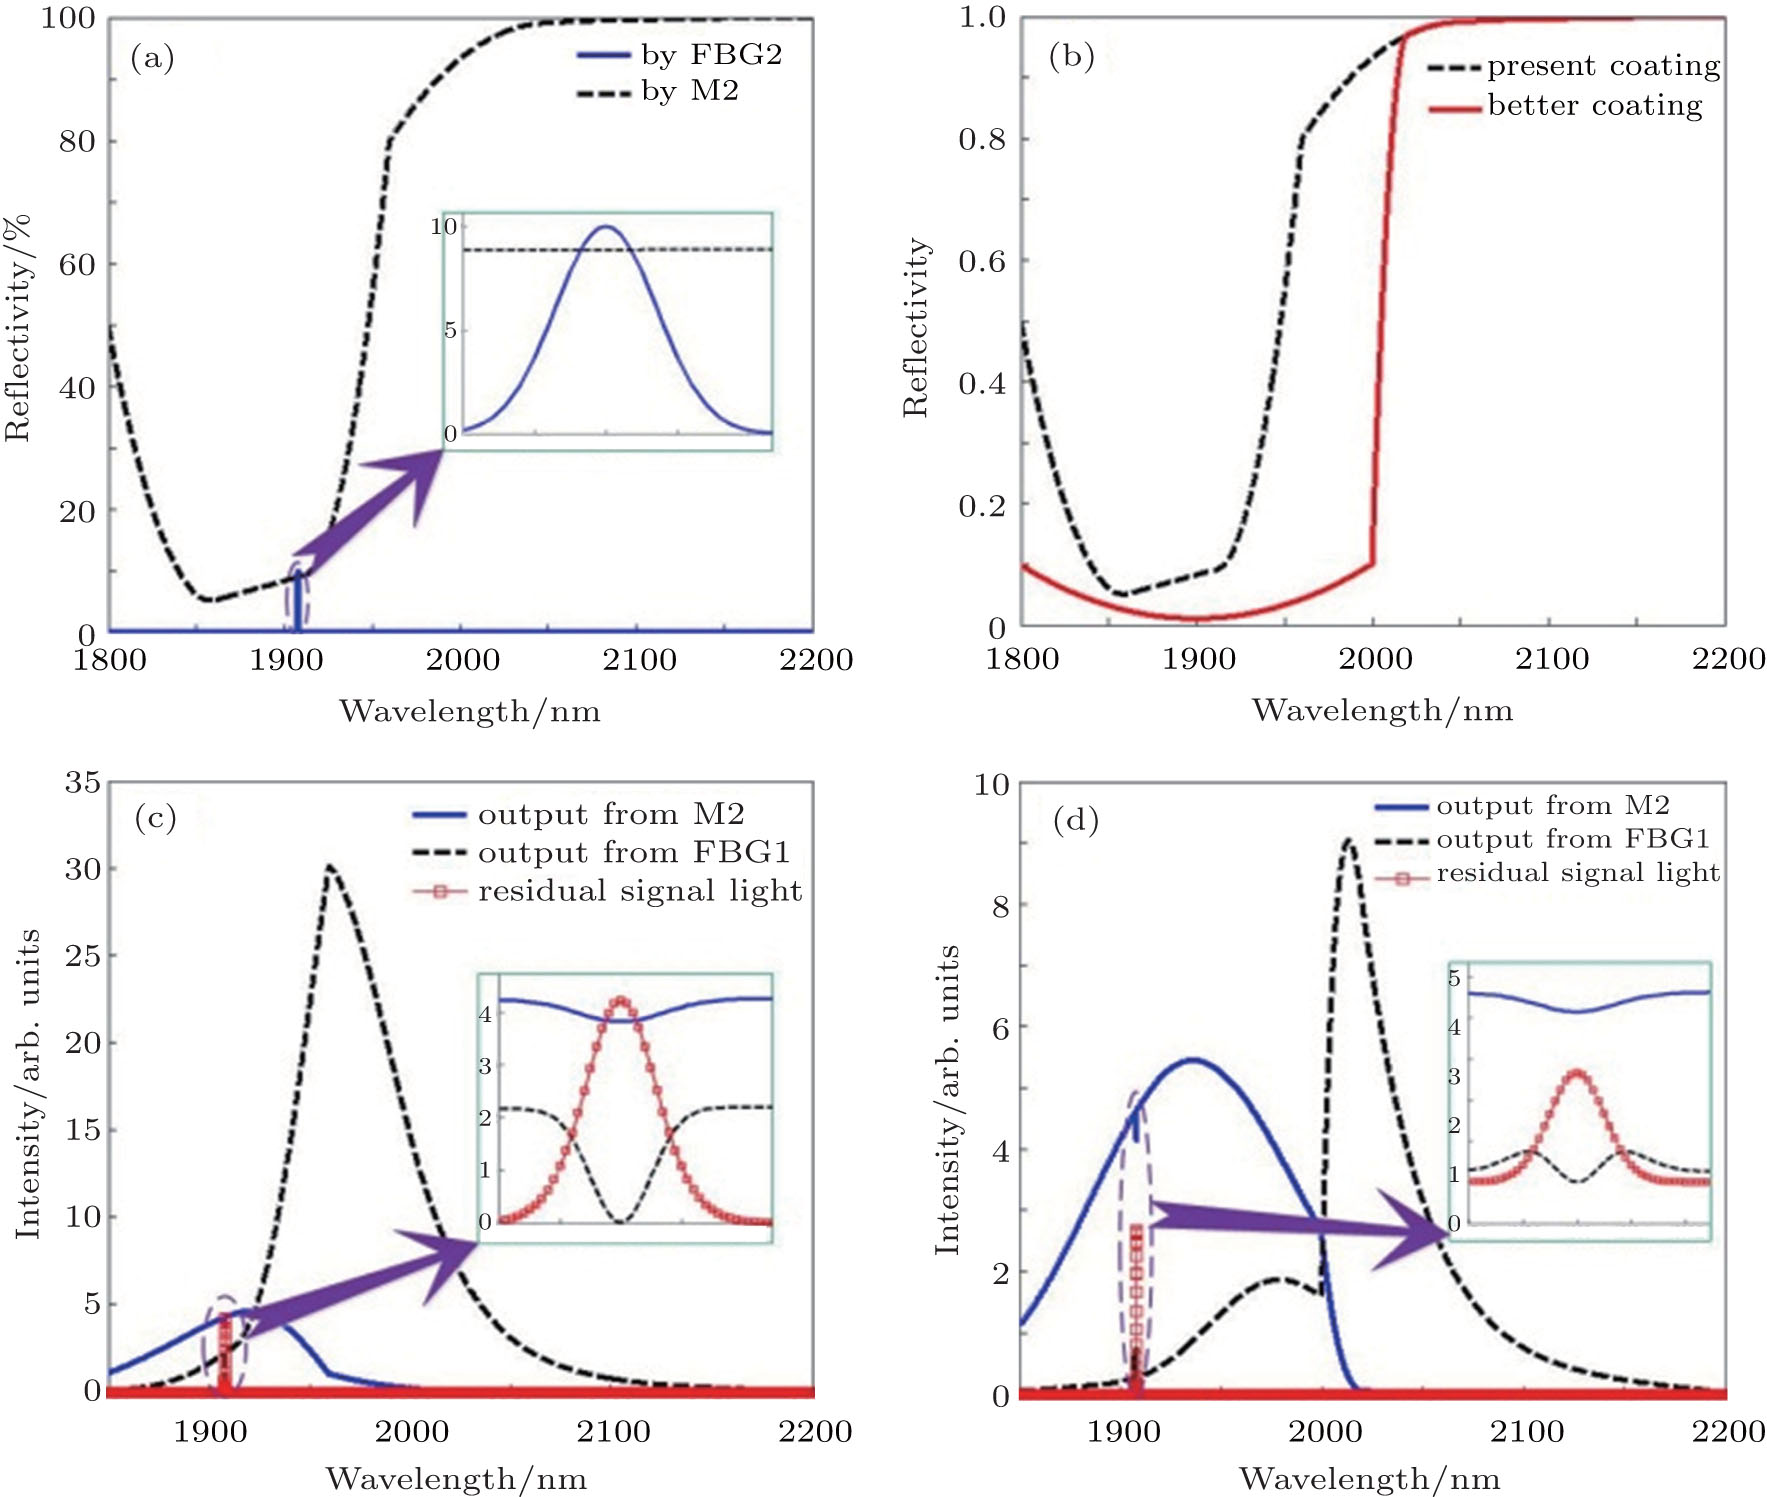 | Fig. 5. Simulation of OFI problem. (a) The reflectivities of FBG2 and M2 with the present coating; (b) the reflectivities of the present coating and assumed better coating of M2; (c) the output spectra from M2 and FBG1, and the residual signal spectra after one round-trip with the present coating; (d) the output spectra from M2 and FBG1, and the residual signal spectra after one round-trip with better coating. |
The reflectivity curves of FBGs and mirror M2, are shown in Figs. 5(a) and 5(b) respectively. FBG1 and FBG2 hypothetically have the same reflection bandwidth of 0.2 nm centered at 1908 nm, and reflectivity of M2 is closely related to coating technology, so we plotted it in Fig. 5(b) for present transmission coating and an assumed better one.
When Pin = 34 W, the output spectra from mirror M2 and FBG1, and the residual signal spectra after one round-trip are plotted in Fig. 5(c) with the present coating and in Fig. 5(d) with better coating, showing that the bandwidth of output spectrum from M2 is about 80 nm, which is wider than that from FBG1 (about 60 nm). And the output spectrum from M2 is centered at 1920 nm, but the output spectrum from FBG1 is centered at 1960 nm. Obviously, the backward gain amplification of feedback light is the cause of this result. In addition, the intensity of residual signal light, centered at 1908 nm, is very small with using the present coating and decreases a little with using the better coating, meanwhile, the output from M2 will increase a little with using the assumed better coating. Obviously, even in a better coating condition, the OFI problem still exists, mostly because the transmitted wavelength of 1908 nm of M2 is so near to the reflected wavelength of 2.1 μ m in this fiber– bulk system.
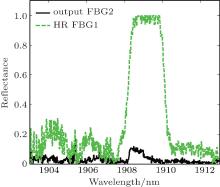
With comparing the calculation of integrated intensity of the output spectra from mirror M2 and FBG1, a roughly understandable explanation for OFI problem is as follows: the population inversion in TDF is mostly consumed by the reflected part from mirror M2, with only backward propagation once. Considering the fact that the actual quality of FBGs in TDFL is not perfect just as shown in Fig. 6 (provided by ITF Labs.), and the gain distribution model just neglected the actual reflectivity characteristics of FBGs, it is necessary to measure the output spectra when OFI problem happens to strengthen our conclusion.
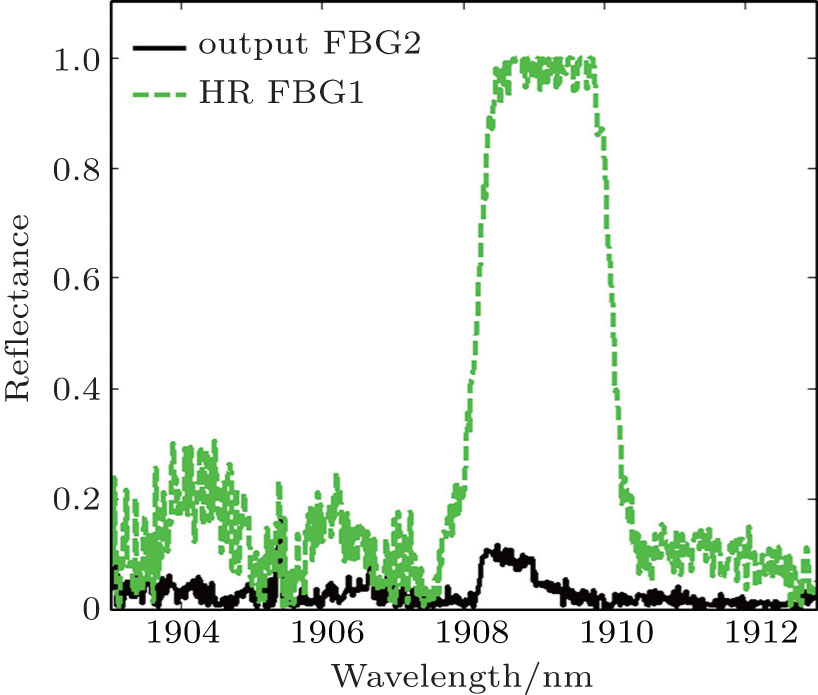 | Fig. 6. Actual reflecitivity characterists of FBGs (provided by ITF Labs). |
When deflecting M2 smoothly, the self-reproductive condition will be broken and the longitudinal modes within the bandwidth of FBG2 will have competitive edge until oscillating and outputting steadily.
Obviously, OFI problem is a common problem for in-band-pumped system, we should do something to avoid the optical feedback into the TDFL. The first practicable method is to insert a nonpolarized isolator behind the output end, but the isolator working around 2 μ m for high power laser up to one hundred of watts is not easy to produce, for example, the isolator supplied by American EOT company can only sustains 30 W of power handling currently and the cost is also very expensive. Next, we can use a pair of dichroic mirrors to construct a Z-shaped or U-shaped folded cavity to leak out residual pump light, which was widely used.[23– 25] In order to further simplify the overall structure, we attempt to use an L-shaped cavity withno isolator but only a dichroic mirror, and overcome OFI by tiny rotation of cavity mirrors.
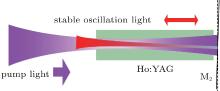
The L-shaped folded cavity includes a 45° dichroic mirror (M1), a plane mirror (M2), and a concave output mirror (M3). Under the circumstance of low thermal loading, the stable oscillating light of TEM00 mode after deflection and the pump light propagating through the gain medium are shown in Fig. 7, and the pump beam waist is inside the crystal. Meanwhile, the crystal should be placed near the plane cavity mirror M2, where the beam waist of stable oscillation light is located. As described in Fig. 7, the stable oscillating light in the cavity will deflect with M2, so we should magnify the pump spot a little larger than the size of resonant TEM00 mode’ s waist to obtain enough overlap to ensure the conversion efficiency.
 | Fig. 7. A sketch of the stable oscillating light of TEM00 mode and pump light propagating through Ho:YAG and mirror M2. |
Obviously, too small deflected angle is unable to sufficiently suppress the influence of pump light feedback on TDFL, and a large deflected angle is infaust to obtain a high lasing efficiency because of bad mode overlap, so it is necessary to predict the optimal deflected angle.
In theory, the minimum deflected angle α min can be reached if transverse deviation of backward pump light is equal to the diameter of 0.4 mm of the fiber pigtail approximately, so the reflected pump light cannot propagate back into the fiber core exactly. With a simple calculation, α min is about 0.2 mrad when the focal length of PCL is 50 mm. As for the maximum deflected angle, α max, we figure out an easier but approximate standard that the α max is obtained when reflected pump light just propagates through the boundary of front surface of crystal, which is about 12 mrad. Considering the size of mirrors, especially for PCL and DM, once the reflected pump light propagates out of the range of the mirror, it will never come back into TDFL. So we can actually choose a smaller DM to reduce α max ulteriorly. Finally, we obtain a preliminary range of deflected angle: [0.2 mrad, 12 mrad].
The transverse deviation of new stable oscillation signal light versus deflected angle is easy to calculate, and the maximum deviation reaching the output mirror can be obtained when α = α max, which is about 0.39 mm. Apparently, we need to move output coupler about 0.39 mm to the right so the new stable oscillation light can pass through the concave mirror center symmetrically (the mirror-deflected cavity is the same as that in Fig. 9). But we ignored this adjustment for our experiments in consideration of the very small deviation and to comfort the experimental process.
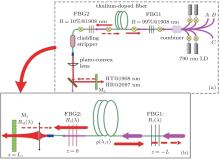
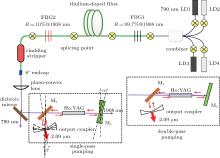
An overall diagram of our experiment is shown in Fig. 8. It was constructed by a pump source of TDFL and an L-shaped plano-concave mirror-deflected cavity for Ho:YAG laser.
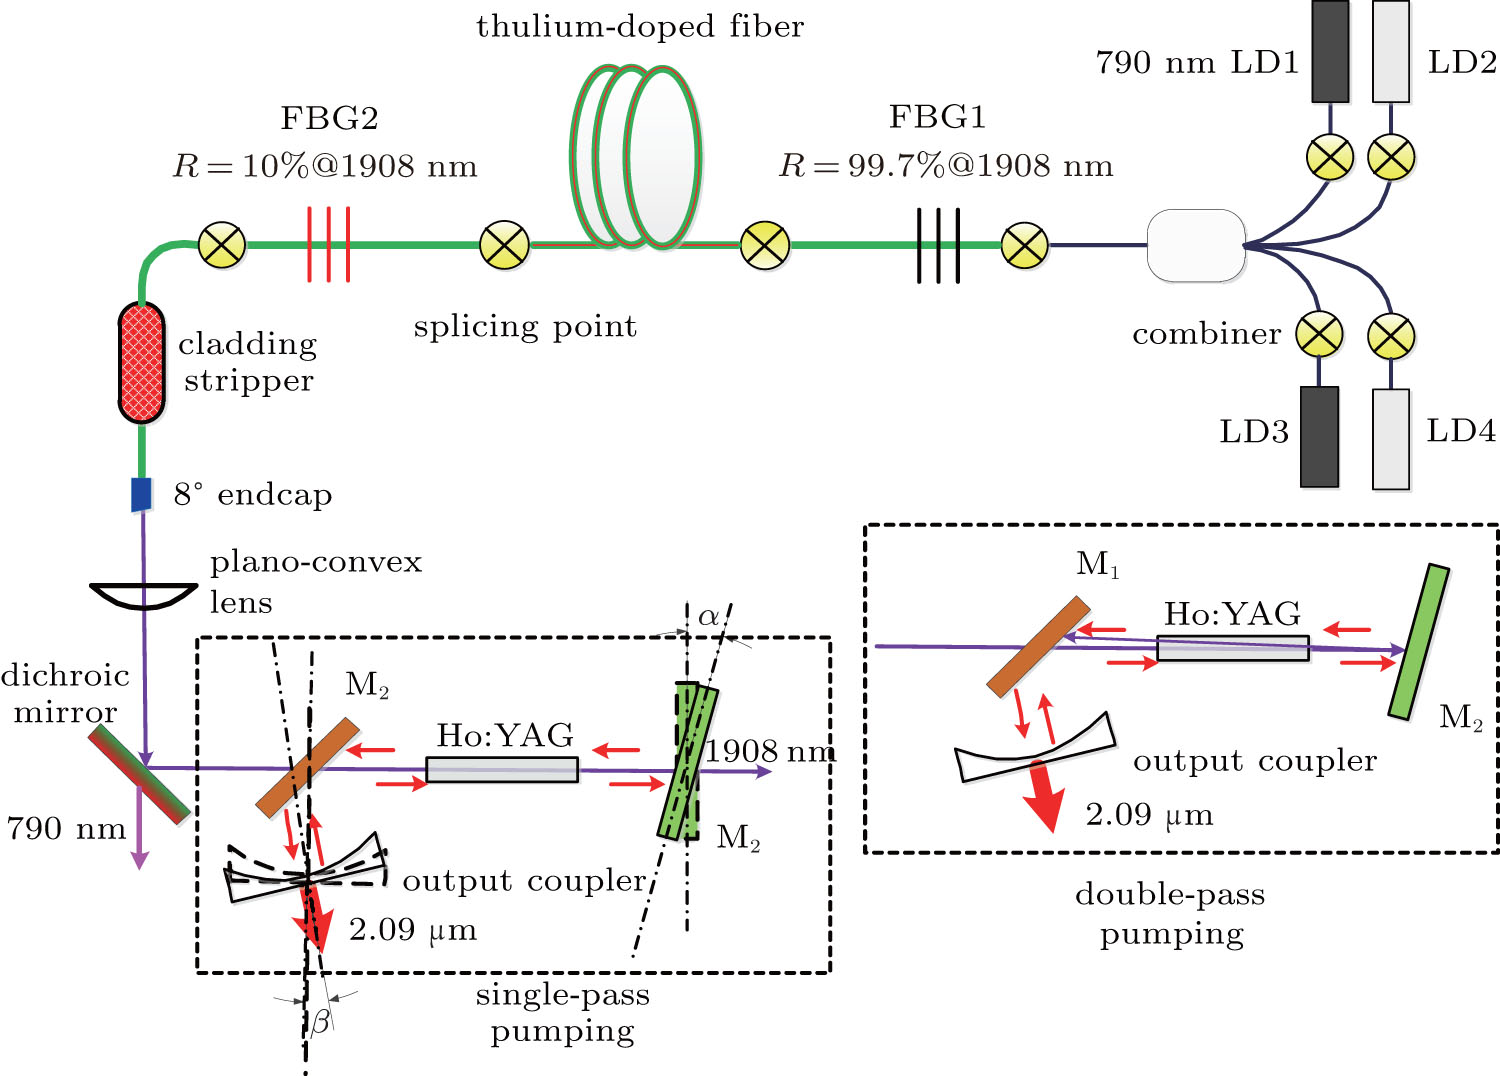 | Fig. 8. A detailed diagram for TDFL end-pumping Ho:YAG laser. |
The newest TDFL was based on a 1.9-m length double-clad TDF (LMA-TDF-25P/400-HE, Nufern), and a pair of FBGs working at a wavelength of ∼ 1908 nm (FBG1 was high reflected, R > 99.0%, and FBG2 was partial reflected, R = 10.1%) were separately spliced to each end of the active fiber as two cavity mirrors. The TDF was wrapped around a 28-cm diameter mandrel, and cooled at a constant temperature of 10° C.
To pump the TDF, four fiber-coupled LDs each with a central emission wavelength of 790 nm were combined into one beamlet by using a 7 × 1 combiner. Meanwhile, a cladding stripper was spliced to FBG2 mostly in order to remove residual pump light, and the end facet was cut into a small angle of 8° .
The power was measured with a 300-W power-meter (L300W-LP1-50, Ophir Optronics).
The 1908-nm pump light was filtered by a dichroic mirror to further remove 790-nm laser. The L-shaped folded cavity includes an another 45° dichroic mirror (M1: AR@ 1908 nm & HR@ 2.1 μ m), a concave mirror as output coupler with 50% transmittance at 2.1 μ m and 300-mm radius of curvature, and a plane mirror M 2, which was anti-reflected at 1908 nm for single-pass pumping or high-reflected at 1908 nm for double-pass pumping and both high-reflected around 2.1 μ m. A bulk cylindrical Ho:YAG crystal with an Ho3+ oncentration of 0.6 at.%, cross-section diameter of 4 mm, and length of 6 cm, was used as the gain medium, whose end faces were both antireflection coated in a wavelength range of 1.9 μ m– 2.2 μ m. The laser rod was water-cooled through a copper heat-sink maintained at 10° C.
The pump light was collimated to a beam radius of 0.32 mm and far field divergence angle of about 2.96 mrad by using a PCL of 50-mm focal length, and the cavity TEM00 mode radius was calculated to be about 0.317 mm when the length of cavity was 155 mm. The power measurement of 2.1-μ m laser was accomplished with a 30-W power-meter (PM30V1, Coherent Inc.). The 1908-nm pump laser and 2097-nm signal laser were confirmed by a laser spectrum analyzer (721B-IR, Bristol Instruments).
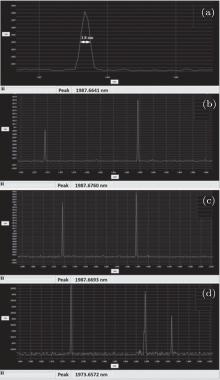
A series of backward output spectra are obtained with a laser spectrum analyzer (721B-IR, Bristol Instruments), when TDFL (the length of TDF is 3 m) is pumped by three 790-nm LDs and the pump current is less than 2.8 A to avoid damaging the LDs, and we choose some typical ones from them as shown in Fig. 9. Meanwhile, we measure the laser power, Pb, from four spare pigtails of 7 × 1 combiner as the output power from FBG1, which can be compared with the output power, Pf, from mirror M2. Assuming that the backward output from FBG1 is noise power and the forward output from M2 is signal power, an imitated signal-noise-ratio (SNR) is defined as 10log10(Pf/Pb). We find that the SNR mostly exceeds 15.7 dB without mirror M2, so the experimental reflectance of FBG1 at 1908 nm is more than 99.7%, but when OFI happens, the SNR becomes negative and is far less than – 37 dB. An interesting result is that the output powers from four individual pigtails of combiner are different, one of them accounts for about 82% of the total power, residual power is almost averaged by the powers of other three pigtails. Typical power data, when pump current is 2 A, are Pf = 6.8 W and Pb = 0.133 W without OFI problem and Pf = 0.002 W and Pb = 10.1 W with OFI problem. The spectrum in Fig. 9(a) when I = 1.9 A shows the output light from FBG1 is around 1987 nm, not 1908 nm, with a linewidth of 1.8 nm. This result also indicates that the gain of 1987 nm in TDF is larger than that of 1908 nm, which is basically consistent with the aforementioned results of gain analysis. With increasing the pump current, new spectral lines come into being, around 1974 nm and 1993 nm as shown in Figs. 9(b) and 9(d), and the relative intensity between different lines gradually changes as shown in Figs. 9(b)– 9(d), implying that the gain distribution in TDFL is changing.
 | Fig. 9. Output spectra from FBG1 under different pump currents when OFI problem happens. (a) I = 1.9 A; (b) I = 2.1 A; (c) I = 2.4 A; (d) I = 2.8 A. |
Although the actual backward output spectra are slightly different from our simulation results, especially the central wavelength and linewidth characteristics, the essence of OFI is clear, namely the population inversion is mostly consumed by a new mode, which has the competition edge compared with original signal mode, with only backward propagation once. Now we are pretty sure that the direct cause of OFI is related to the coating characteristics of tandem mirror and gain distribution in TDFL.
An aperture is inserted between M2 and the collimating He– Ne source to measure the deflected angle α . The deviation of reflected He– Ne light from M2 is Δ x mm when the deflected angle is α , so we can easily figure out the value of α from the following expression: α = arcsin[Δ x/(2d)] ≈ Δ x(2d) rad, where d = 30 cm is the distance from M2 to the aperture.
With 8 W of pump power, we measure the transmitted powers of M2 with no Ho:YAG nor M3, at six different deflected angles: the pump output capacity rises rapidly when Δ x > 3 mm, namely α > 5 mrad, and no feedback is observed any more when Δ x > 5 mm, namely α > 8.3 mrad. So the actual minimum deflected angle is 8.3 mrad, which is higher than the theoretical value, mostly because the He– Ne light does not precisely follow the pump light direction.
With 40 W of pump power and α > 8.3 mrad, we obtain the output powers of signal light at four different deflected angles with single-pass and double-pass pumpings respectively, and we obtain the maximum efficiency 46.34% for single-pass pumping and 54.60% for the other when the deflected angle is 13.3 mrad. Considering the experimental error, mainly caused by the measurement of Δ x and the calibration of pump light direction, the theoretical results are accordant with those in practical situation basically. Finally, we take α = 13 mrad as the optimal deflected angle and conduct the high-pump-power experiments for single-pass and double-pass pumped Ho:YAG laser, which is described in the next subsection.
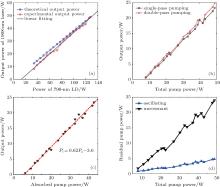
The experimental output powers of cladding pumped TDFL, which are basically in agreement with theoretical values, are shown in Fig. 10(a), and a maximum power of 48.8 W is obtained while the total pump power is about 127.5 W, with about 42% of slope efficiency. The beam quality is measured by the 90/10 knife-edge method, and we obtain beam-propagation factor M2 < 1.55 and far field divergence angle about 75.5 mrad.
The output power characteristic of Ho:YAG laser is shown in Fig. 10(b) while the deflected angle is about 13 mrad: the general output capacity of double-pass pumping way is only a little better than that of single-pass pumping because of high single-pass absorption efficiency; the maximum single-pass output power is 23.3 W with a pump power of 48.8 W, and the slope efficiency is 62% corresponding to the absorbed pump power, namely the total pump power reaching M1 subtracts, the residual pump power transmitted from M2, which is shown in Fig. 10(c); the maximum double-pass output power is 25 W with about 51.2% of optical-to-optical conversion efficiency.
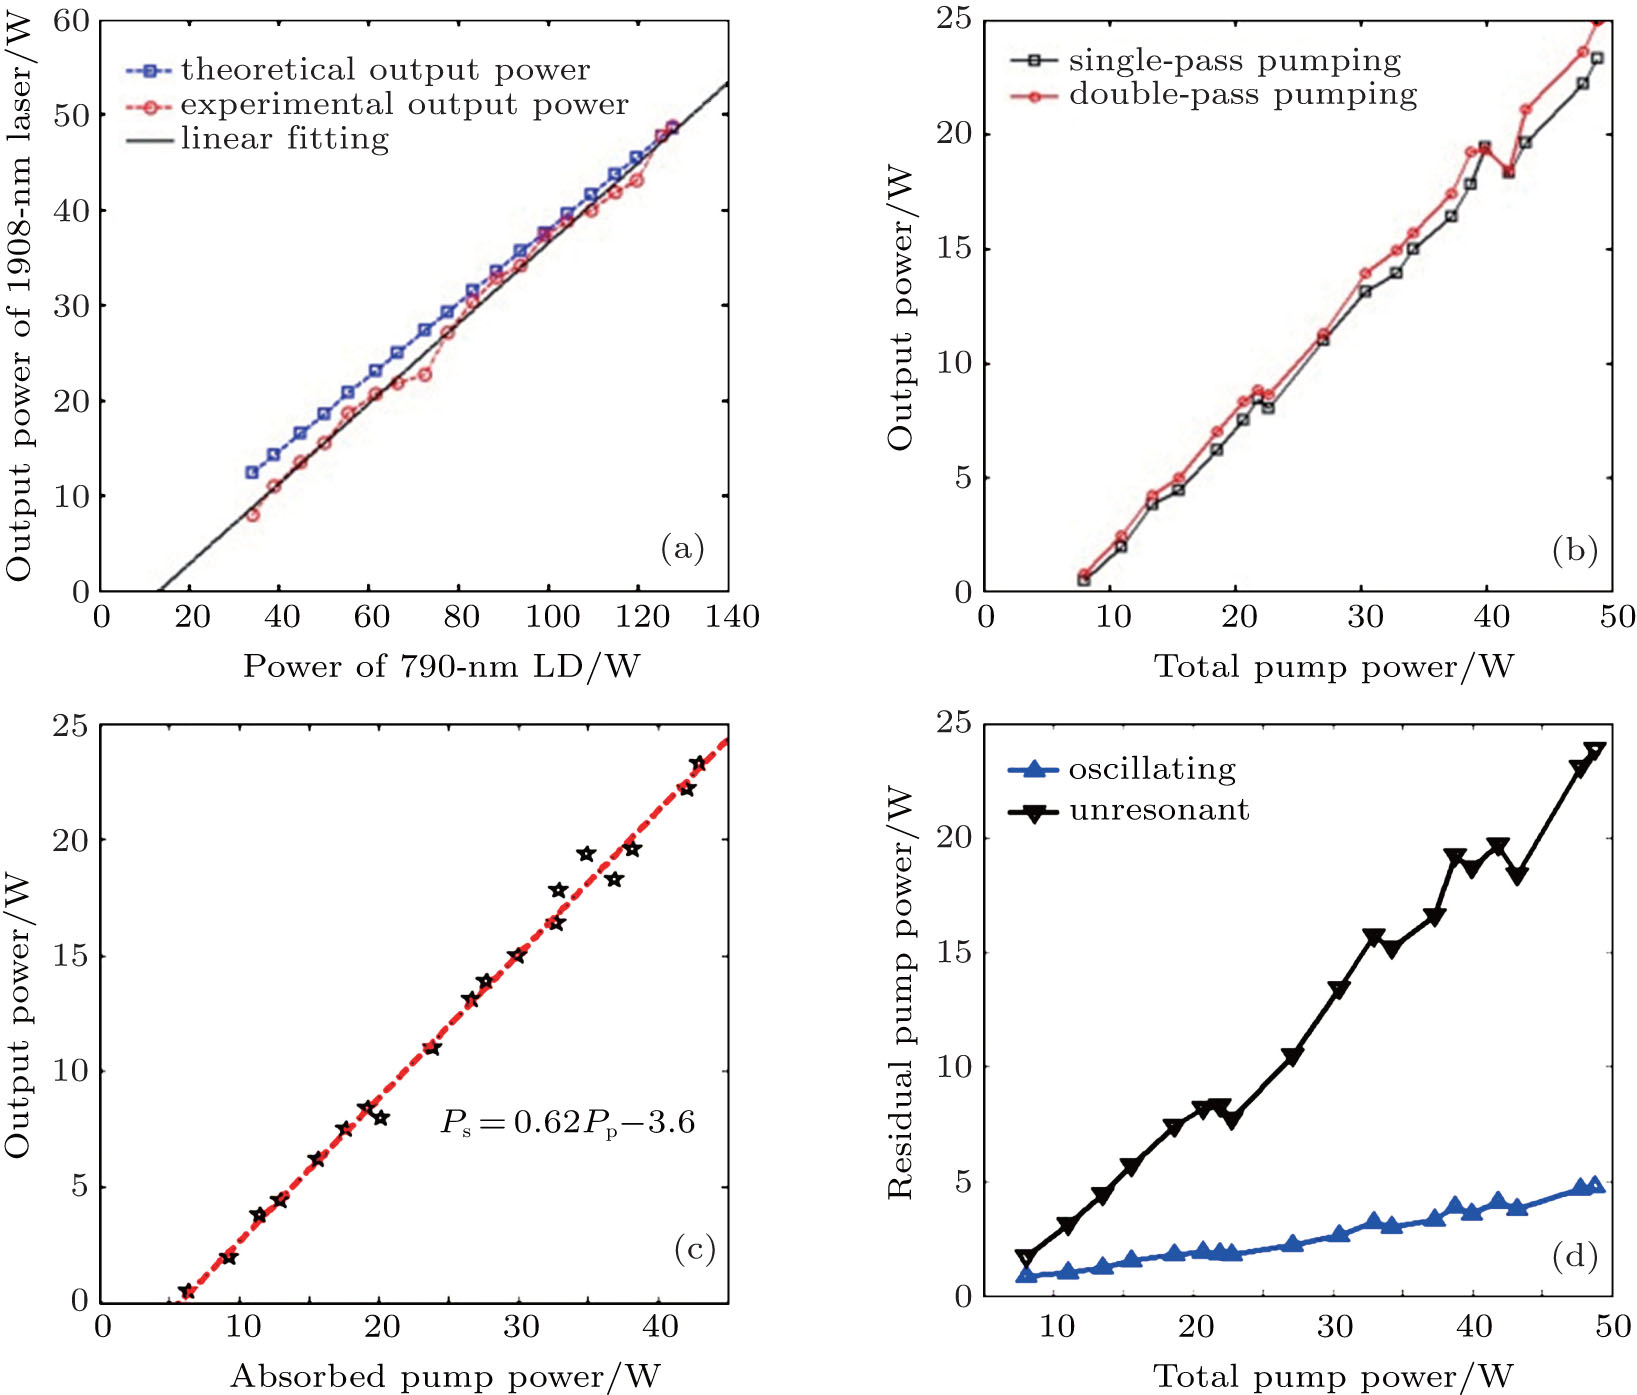 | Fig. 10. Output characteristics of TDFL and Ho:YAG laser: (a) theoretical and experimental output powers of TDFL; (b) output powers of Ho:YAG laser with single-pass and double-pass pumping ways; (c) output power of Ho:YAG laser versus absorbed pump power with single-pass pumping; (d) residual pump powers of Ho:YAG laser, with cavities being unresonant and oscillating respectively. |
In addition, we did observe the effect of ground-state bleaching[26] in the single-pass pumping laser, which is embodied in Fig. 10(d): while the oscillating cavity is unresonant, the single-pass absorption efficiency dropped clearly with the pump power increasing: the single-pass absorption efficiency is reduced by about 90% when the pump power is 8 W and by 52.7% when the pump power is 48.8 W; while the cavity is oscillating, the single-pass residual pump power is low enough and the absorption efficiency reaches 90.4% even when pump power is high.
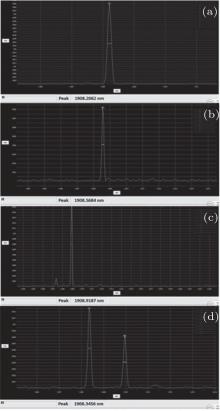
The spectra characteristics of TDFL can be concluded from four typical spectra in Fig. 11. Firstly, there is only one line centered around 1908 nm when the pump current is less than 3.6 A, and the wavelength has a red-shift from 1908.2062 nm to 1908.8282 nm, and the linewidth becomes wider from 0.139 nm to 0.165 nm, with pump current increasing, which are shown in Figs. 11(a) and 11(b); secondly, a new wavelength around 1907 nm appears when I ≥ 3.6 A, and the intensity is gradually enhanced even exceeds the intensity of initial line, which are shown in Figs. 11(c) and 11(d). We investigate the dynamic characteristics of FBGs and the gain distributions of TDFL at different pump powers as the main causes of red-shift and double-wavelength effect.
 | Fig. 11. Output spectra of TDFL under different pump currents: (a) I = 1.8 A; (b) I = 2.8 A; (c) I = 3.6 A; (d) I = 5.6 A. |
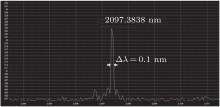
A typical output spectrum of Ho:YAG laser is shown in Fig. 12. The typical output wavelength is centered at 2097.3838 nm with a linewidth of 0.1 nm.
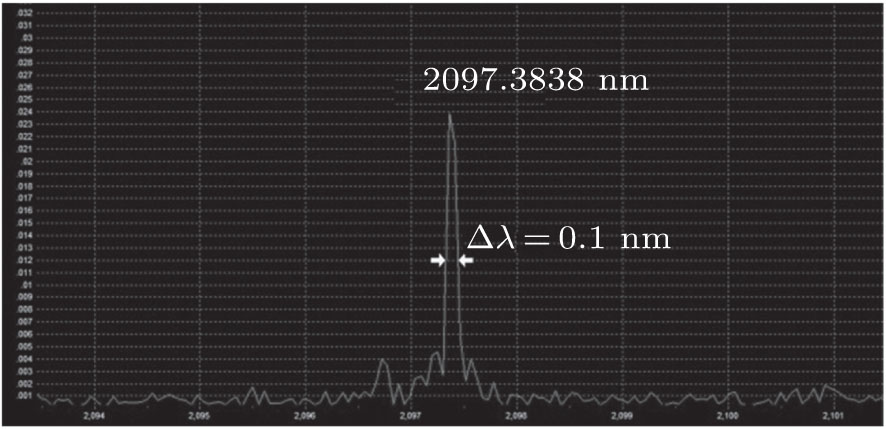 | Fig. 12. Typical output spectrum of Ho:YAG laser pumped by TDFL. |
With the double-pass pumping way, the beam quality, M2 < 1.43, is roughly achieved with the 90/10 knife-edge method, [27] and the far field divergence angle is about 6 mrad. Regrettably, we cannot optimize the output power, nor extraction efficiency nor beam quality, which will be done in further work.
In this study, the quantitative and theoretical analysis of the OFI problem in fiber-bulk laser system is implemented based on a detailed analysis of gain distribution in cladding pumped TDFL, and proves to be basically valid with the measured spectra and output power data. The preliminary analysis indicates that the population inversion is mostly consumed by the reflected part from mirror M2, but not the reflected part from FBG2, during only backward propagation once in high-gain fiber cavity. A simple L-shaped cavity for hybrid fiber-bulk Ho:YAG laser is tried to restrain the pump light feedback, and the potential characteristics are studied with theoretical and experimental analyses. Finally, a stably operated TDFL pumped Ho:YAG laser is realized, its maximum output power reaches 25 W, and optical-to-optical conversion efficiency is 51.2%.
The present work mainly focuses on explaining the OFI problem and avoiding it with a simple method, but not on optimizing the output characteristics.
| 1 |
|
| 2 |
|
| 3 |
|
| 4 |
|
| 5 |
|
| 6 |
|
| 7 |
|
| 8 |
|
| 9 |
|
| 10 |
|
| 11 |
|
| 12 |
|
| 13 |
|
| 14 |
|
| 15 |
|
| 16 |
|
| 17 |
|
| 18 |
|
| 19 |
|
| 20 |
|
| 21 |
|
| 22 |
|
| 23 |
|
| 24 |
|
| 25 |
|
| 26 |
|
| 27 |
|