

The VMI study on angular distribution of ejected electrons from Eu 4f76p1/26d autoionizing states
[Zhang Kaia), b) , Shen Lia), b) , Dong Chenga), b) , Dai Chang-Jian†a), b)  ]
]
]
|
|


†Corresponding author. E-mail: daicj@126.com
*Project supported by the National Natural Science Foundation of China (Grant No. 11174218).
The combination of a velocity mapping imaging technique and mathematical transformation is adopted to study the angular distribution of electrons ejected from the Eu 4f76p1/26d autoionizing states, which are excited with a three-step excitation scheme via different Eu 4f76s6d8 D J ( J = 5/2, 7/2, and 9/2) intermediate states. In order to determine the energy dependence of angular distribution of the ejected electrons, the anisotropic parameters are measured in the spectral profile of the 6p1/26d autoionizing states by tuning the wavelength of the third-step laser across the ionic resonance lines of the Eu 6s+ → 6p+. The configuration interaction is discussed by comparing the angular distributions of ejected electrons from the different states. The present study reveals the profound variations of anisotropic parameters in the entire region of autoionization resonance, highlighting the complicated nature of the autoionization process for the lowest member of 6p1/26d autoionization series.
As is well known, the angular distribution (AD) of the ejected electrons from an autoionizing state is proportional to the differential cross section of the autoionization, [1] which allows one to obtain more detailed information than the autoionization spectrum representing total cross section of autoionization.[2] Unlike a spectrum, depending only on the amplitude of atomic wave function, the AD may also provide information about the phase shift of the wave function. Thus, the study of AD may not only deepen the understanding of atomic characteristics, but also provide more experimental evidences for stringently testing the new quantum theory. Meanwhile, the AD may illustrate the direction of the movement of electrons ejected from autoionizing states, reflecting the dynamical characteristics of the autoionization process.
Up to now, almost all the researches on the AD of ejected electrons from atomic autoionizing states have concentrated on the alkaline-earth atoms.[3, 4] Experimentally, the isolated-core excitation (ICE) technique is usually employed to carry out the AD observation. Namely, an atom is stepwise excited to an autoionizing state, and then ejects an electron, which is detected by changing the angle between the directions of laser polarization and the detector with the time of flight (TOF) technique.[5, 6] Since this traditional method requires many electron spectra measured at different angles, involving the rotation of polarizations of the scanning laser during the experiment, it is not only a very time-consuming process, but also may introduce a significant uncertainty.
Based on the above facts, this work is devoted to the AD study of the ejected electrons from the Eu 4f76p1/26d autoionizing states with a novel velocity-map imaging (VMI) technique.[7, 8] Evidently, such an effort will face several challenges: a) as a rare-earth atom, the Eu atom has a half-filled 4f subshell, [9] whose symmetry of angular wave function is distorted, resulting in an influence on its AD property; b) as the lowest member of the 4f76snd Rydberg series, the ICE technique may be no longer valid, which may have an influence on both the spectrum and the AD profile due to the correlation between inner and outer electrons in the excitation process; c) as the VMI technique was developed originally for the photo-dissociation of molecules where the energy of fragments is much higher than that of ejected electrons from an atomic autoionizing state, [10] the validity of the VMI will be examined by the present work.
Neither laser polarization nor the detector need to be rotated during the experiment with the VMI technique, thereby not only saving the time of the online measurement, but also improving the accuracy. Additionally, the possible differences of the present work from the recent study on the AD of Eu 4f76p1/28s autoionizing states are also expected.[11]
The experimental approach and theoretical basis are described in Sections 2 and 3, respectively. The experimental results and discussion are presented in Section 4, while the conclusions are given in Section 5.
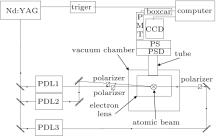
In order to study the AD of the ejected electrons from the Eu 4f7 6p1/26d autoionizing state, both autoionization spectrum and the AD need to be measured. Especially, it is very helpful to assign a unique J value for each feature in the autoionization spectrum, which will be discussed in Section 4. The experimental setup for the study is shown in Fig. 1.
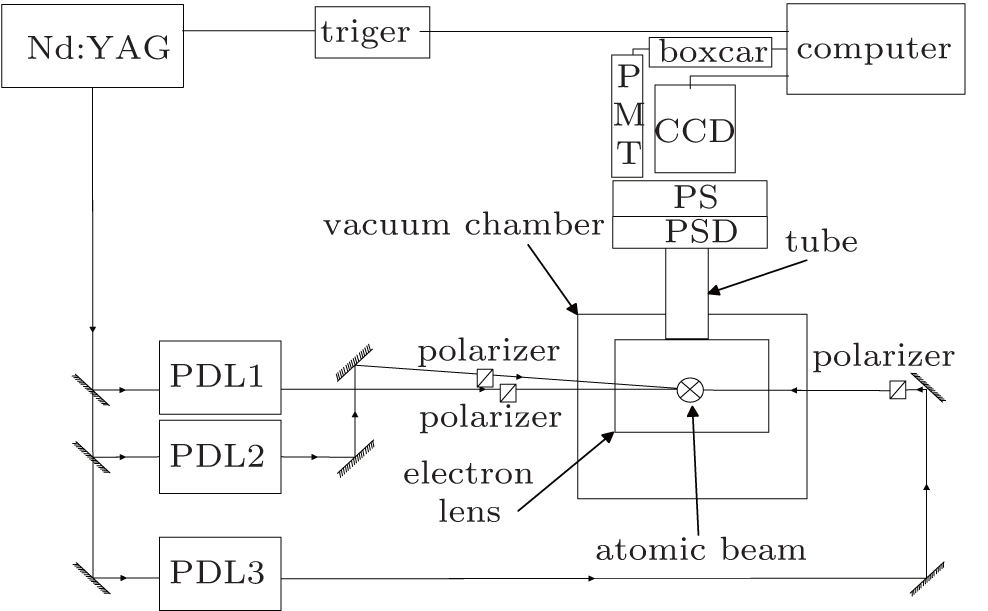 | Fig. 1. Experimental setup composed of a laser system, an Eu atomic beam production system and a signal collecting system. |
As shown in Fig. 1, the setup used in this work contains a high energy laser system, an Eu atomic beam production system, and a signal collecting system. Since a detailed description of the experimental setup could be found in a previous paper, [12] only a brief introduction is given here.
The high energy laser system contains three tunable dye lasers each with a line width of 0.2 cm− 1 and pulse energy of 0.5 mJ, pumped by the 2nd-harmonic or the 3rd-harmonic generated by the same high energy pulsed Nd:YAG laser working at wavelengths of 532 nm or 355 nm with a pulse duration of 6 ns– 8 ns, running at 20 Hz.
The Eu atomic beam production system, inside a vacuum chamber with a typical pressure of about 10− 5 Pa, generates an effusive atomic beam with continuous heating from an oven. To reduce the Doppler broadening, the atomic beam is crossed vertically by dye laser beams in an interaction region.
The signal collecting system mainly includes an electron lens, a position sensitive detector (PSD), a phosphor screen (PS), and a charge coupled device (CCD). Electrons ejected from autoionization are imaged onto the PSD, then, the fluorescence signal from a P47-phosphor is obtained by a CCD and delivered to a computer for further analysis.
In order to determine the different J values of the Eu 4f76p1/26d autoionizing states, three-step sequential laser excitation is utilized with three different paths, as shown in Eqs. (1)– (3).


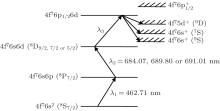
As can be seen above, the first-step excitations are the same for the three paths, in which the photon with a wavelength of λ 1 = 462.71 nm is used, while in the second-step excitation the photons are required to have three different wavelengths, namely, λ 2 = 691.01 nm, 689.70 nm, and 684.18 nm for the paths I, II, and III, respectively. The Eu atoms in the ground state are excited respectively to the 

With stepwise excitation, photons from three linearly polarized lasers interact with the Eu atom. The above excitation schemes are also shown in Fig. 2.
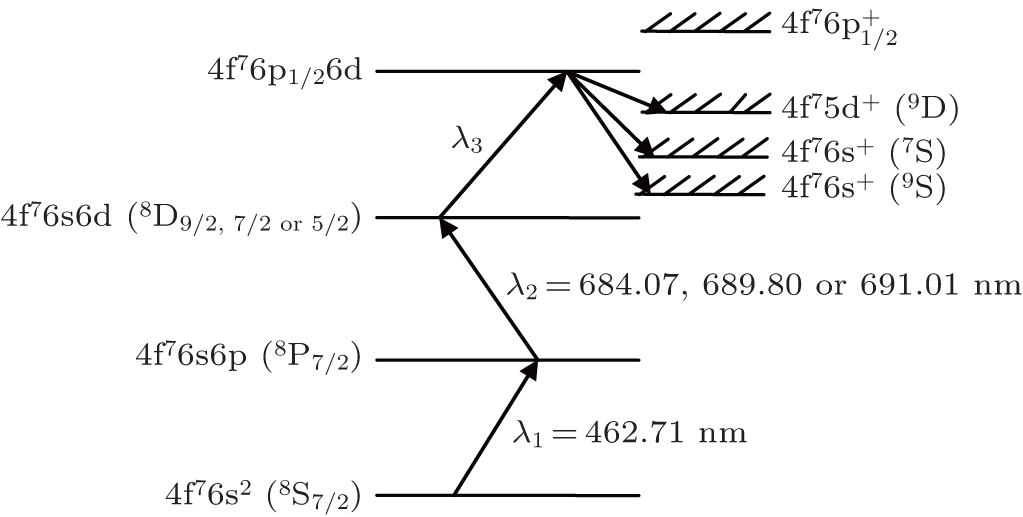 | Fig. 2. Diagram of several excitation schemes, in which λ 1 is fixed at 462.71 nm, and λ 2 is fixed at 684.07 nm, 689.80 nm or 691.01 nm to populate several different 4f76s6d (8D) Rydberg states, while λ 3 is scanned to populate the 4f76p1/26d autoionizing states. |
As shown in Fig. 2, the 4f76p1/26d autoionizing state is excited from the 4f76s2 (8So) ground state via the 4f7 6s6p and several different 4f76s6d intermediate states. Then, the autoionizing states decay to the 4f76s+ (9So), 4f76s+ (7So), and 4f75d+ (9Do) final ionic states.
The VMI technique is utilized to investigate the AD of ejected electrons from the Eu 4f76p1/26d autoionizing state by detecting the products of autoionization mentioned above; it is more superior to traditional methods, such as the time-of-flight method as it can save a lot of time from the online measurement or avoid rotating the detector and the laser polarization.
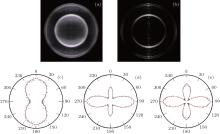
To measure the AD of an ejected electron from the autoionization, the inverted Abel transformation is used to obtain the three-dimensional (3D) velocity distribution from the two-dimensional (2D) image of the ejected electron obtained by the CCD, an example of which is shown in Fig. 3. Namely, the software, BASEX, is used to reconstruct a 3D spatial intensity distribution by Abel inversion transformation, [13] whereas the AD of electrons ejected from autoionization is obtained by fitting the 3D Abel-inverted image.
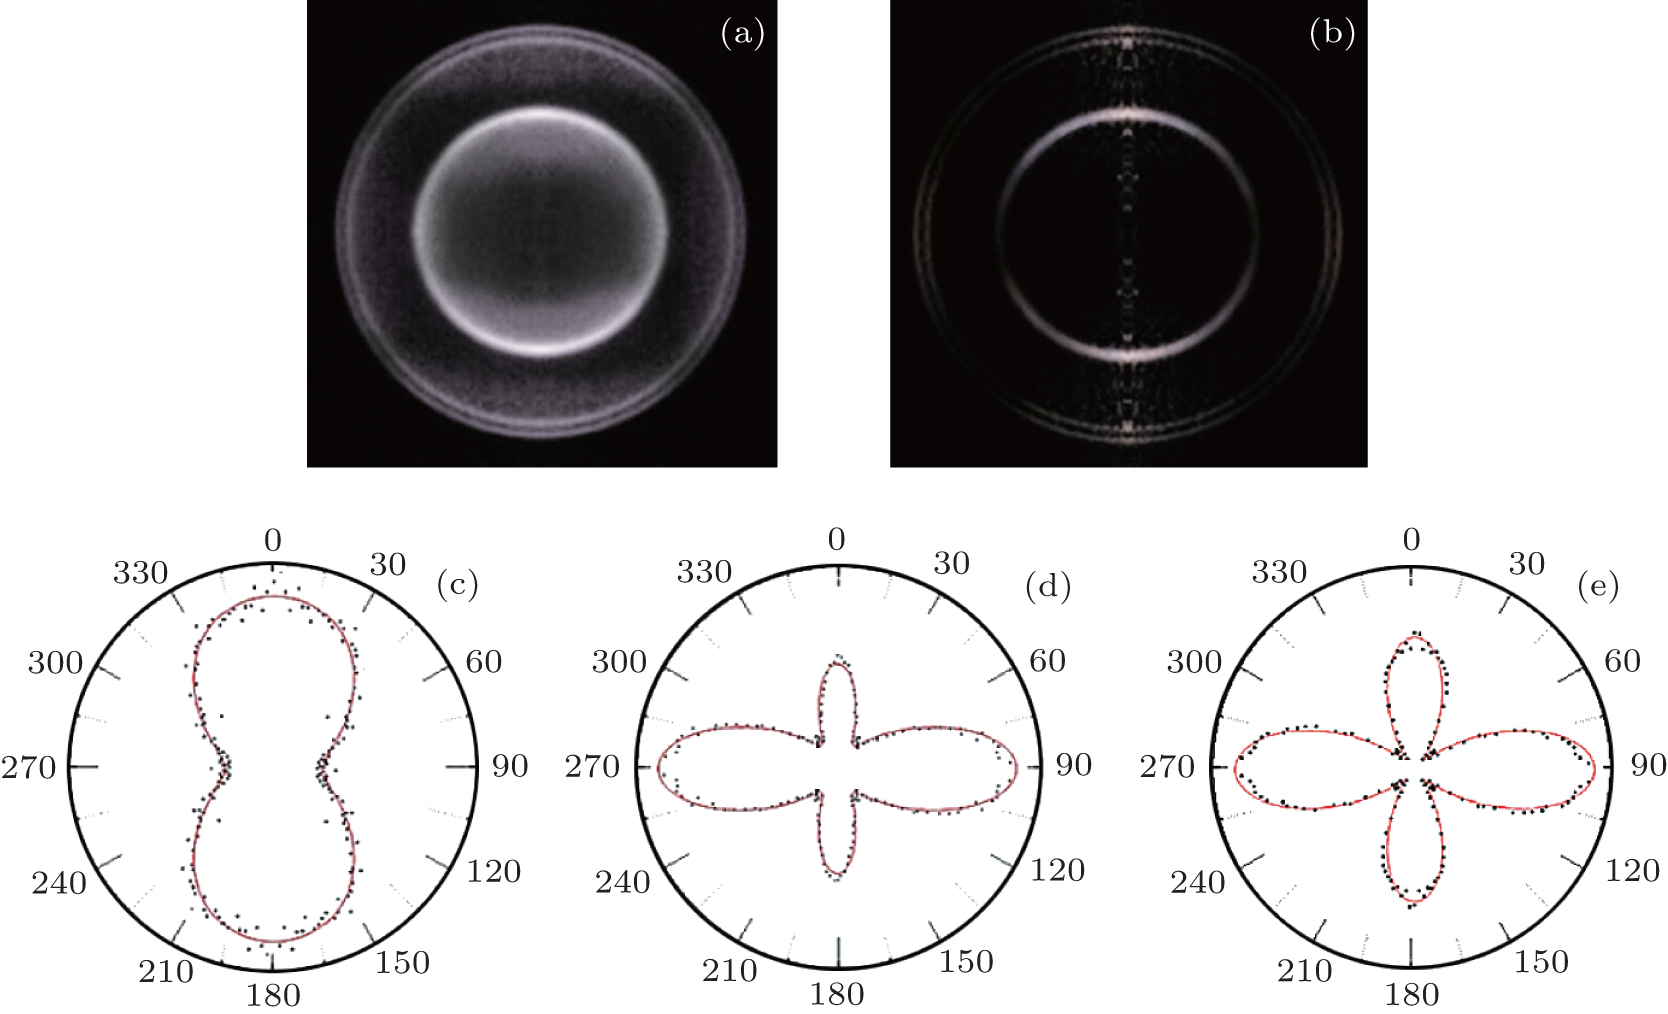 | Fig. 3. The ADs of electrons ejected from the 4f76p1/26d autoionizing state at an energy of 58255.8 cm− 1: (a) the 2D original VMI image; (b) the 3D Abel-inverted image; the ADs corresponding to three ionic states (c) 4f75d+ (9Do); (d) 4f76s+ (7So), and (e) 4f76s+ (9So), respectively. |
As shown in Fig. 3, there are three rings in both 2D and 3D images, corresponding to three different ionic states shown in Fig. 2. In other words, the inner, middle, and outer rings represent the ADs of ejected electrons corresponding to the decays to the 4f76s+ (9So), 4f76s+ (7So), and 4f75d(9Do) final ionic states, respectively. Therefore, figure 3 illustrates the whole process for obtaining the ADs of ejected electrons from the VMI technique, with which the more AD results at different energies will be presented through discussion in Section 4.
During the experiment on the AD, several parameters of VMI need to be adjusted. First, to ensure that ejected electrons with different kinetic energies are located accurately, it is necessary to calibrate the spatial location of an image with VMI. Namely, the ejected electrons with zero kinetic energy, acquired by photoionization, should be in the center of the image. The uncertainty caused by spatial calibration is less than 3%. Secondly, in order to have a sufficient contrast and resolution of light and dark rings of the image, it is important to scale the intensity of the image with the VMI. The separations of three rings indicate velocity differences of outgoing electrons from autoionizing states.[14, 15]
The AD of ejected electrons from the atomic autoionizing state depends on both the initial and final states of the excitation, thus their symmetry, energy, angular momentum, and parity are expected to have some influences on the AD, which is the central point of this section. Generally speaking, the AD of the ejection process can be expressed as Eq. (2)

where k = 0, 2, 4, … , 2lmax, and lmax is the maximum of orbital quantum number; Pk (cos θ ) is the Legendre polynomial of order k. The coefficients ak may be written as
where l and J are orbital and total angular momentum quantum numbers, respectively; symbol [x] is an abbreviation for the (2x + 1)1/2, where x can be J, J′ , l, l′ , and k, respectively; DJcslJ is the degenerate dipole matrix element of the transition; C is defined as the product of multiple 3j symbols and 6j symbol:

where the first four factors are 3j symbols, and the rest are 6j symbols; J0 is the total angular momentum of the initial state for the last-step excitations to 4f76p1/26d autoionizing states, which is 4f76s6d 8DJ (J = 5/2, 7/2 or 9/2) Rydberg states for the three excitation paths, respectively. Accordingly, the J0 can be 5/2, 7/2 or 9/2, respectively. The Jcs is defined as

where Jc is the total angular momentum of the ionic core, while s is the spin angular momentum of an ejected electron. Since the three lasers used in the three-step excitation process are set to be linearly polarized and parallel to the direction of the detector, the selection rule of M for each step should be Δ M = 0. Then the third dye laser excites the inner electron to have a transition, producing the autoionizing state. The photoionization process can be expressed as

where Jγ and π γ are the angular momentum and parity of photon, while π c and π e are the parities of core and ejected electron. The angular momentum satisfies the equation:

With the above formulae, the triangle relation of the 3j symbol is used to calculate the possible values of the orbital quantum number. Thus, to determinate the k value, the last 3j symbol in Eq. (6) plays a main role
where ml, m0, and m are the magnetic quantum numbers. According to the conservation law of angular momentum, their sum are equal to 0, and − J ≤ m0 ≤ J, − k ≤ ml ≤ k, − J′ ≤ m ≤ J′ , they have a uniform denominator. The k value correlates with the value of J, where 0 ≤ k ≤ 2J. For example, when J = 7/2, we have 0 ≤ k ≤ 7. Considering that the parity satisfies the equation

we obtain k = 6.
Thus, the symmetry considerations and selection rules for angular momentum constrain the AD of the 4f76p1/26d autoionizing states into the form of
where I0 = 4π α 0 is the total cross section of the autoionization, and the AD of ejected electrons is characterized by five anisotropy parameters: α 2/α 0, α 4/α 0, α 6/α 0, α 8/α 0, and α 10/α 0, which are functions of energy. Obviously, the expression written in Eq. (12) is much more complicated than that for Mg 3pnd autoionizing states.[6]
Unlike the alkaline-earth atoms, where the coefficients ak, defined by Eq. (5), can be calculated theoretically, no such reports have been found for the rare-earth atoms, which is a much more challenging task. For this reason, for one of the most complicated atoms of the rare-earth atoms, no theoretical study of the Eu autoionizing states is available. Thus, the AD of ejected electrons from the Eu 4f76p1/26d autoionizing states can only be carried out experimentally. Namely, although much effort has been made to simplify the general expression for the AD shown in Eq. (4) into the version shown in Eq. (12) with all physical information about the Eu 4f76p1/26d autoionizing states, the present study can only determine the anisotropy parameters experimentally. Therefore, the anisotropy parameters will be determined by fitting the experimental AD pattern to Eq. (12) for each energy point, the spectra of which will be shown in the next section.
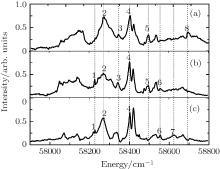
Before displaying any AD results of the Eu 4f76p1/26d autoionizing state, it is meaningful to examine the properties of their autoionization spectra. The experimental spectra of the 4f76p1/26d autoionizing states, shown in Fig. 4, manifest a profile with a complex structure, indicating configuration interaction with either the continuum states or other autoionizing states.[16]
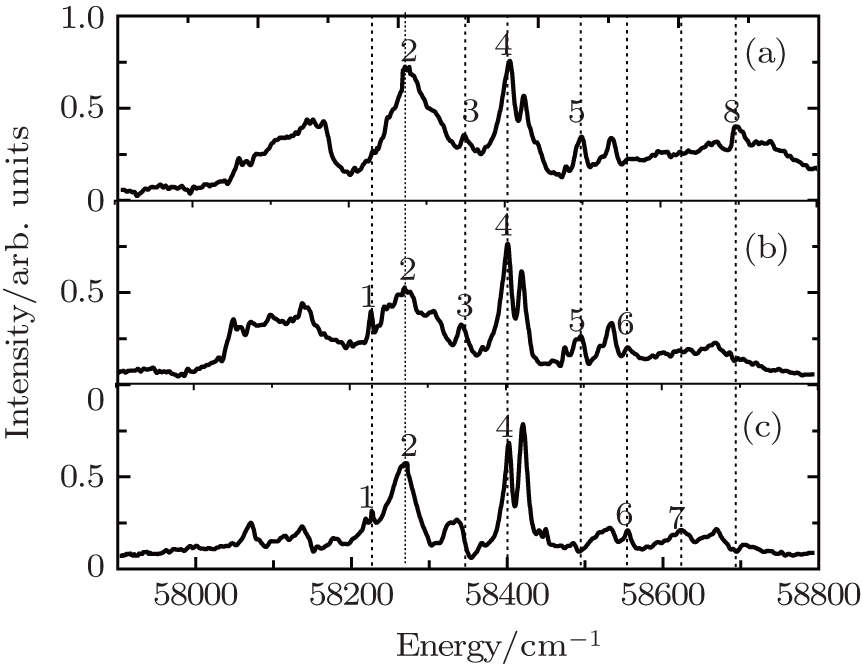 | Fig. 4. Experimental spectra of the Eu 4f76p1/26d autoionizing states with the three different excitation paths: (a) path III, (b) path II, and (c) path I. |
The autoionization spectra shown in Fig. 4 are by no means standard Lorentzian profiles, the Fano type instead, indicating the breakdown of the ICE mechanism, which is valid for the higher-n 6pnl autoionizing states of the Eu, [17] Ba, [18] and Sm[19] atoms. This is as expected because the profile of autoionizing state reflects the interaction between valence electrons of an atom, especially for the lowest-n member of the autoionizing Rydberg state in this case. Spectral features represented by several small peaks superimposed on the envelope of the main transition, may be explained as the admixture of some autoionizing states with higher n values, converging to the lower ionization limit, with an autoionizing state of lower n value, converging to the higher ionization limit. In other words, in the energy region below the 6p+ ionization limits, a large number of 5dnl autoionizing states degenerate with the 6p1/26d autoionizing states, leading to the simultaneous excitation to 5dnl autoionizing states due to the admixture. Meanwhile, as the lifetime is much longer for the 5dnl autoionizing states than for the 6p1/26d autoionizing states, their line widths are much smaller than those of 6p1/26d autoionizing states. Since the spectra of the 4f76p1/26d autoionizing states shown in Fig. 4 are from the different intermediate states 4f76s6d 8DJ (J = 5/2, 7/2 or 9/2), most structures share resemblance in the three paths.
According to the above discussion, we can determine the possible J and k values for some features in the autoionization spectrum, which is mentioned in Section 2. Taking the three spectra corresponding to the three paths for example, shown in Fig. 4, the J values can be determined uniquely.
Considering the selection rule for the J value, it is possible to assign a unique J value to most of the features shown in Fig. 4, so as to obtain the corresponding k value as described in Section 3. The level energies of peaks in the spectra of the 4f76p1/26d autoionizing states, together with their J and k assignments, are given in Table 1.
| Table 1. The J and k assignments for the eight peaks with their level energies. |
As shown in Table 1, it is clear that the kmax = 10 for all peaks in the autoionization spectra, which is in accordance with the results derived from the theory.
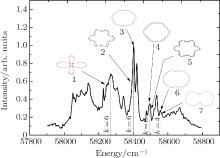
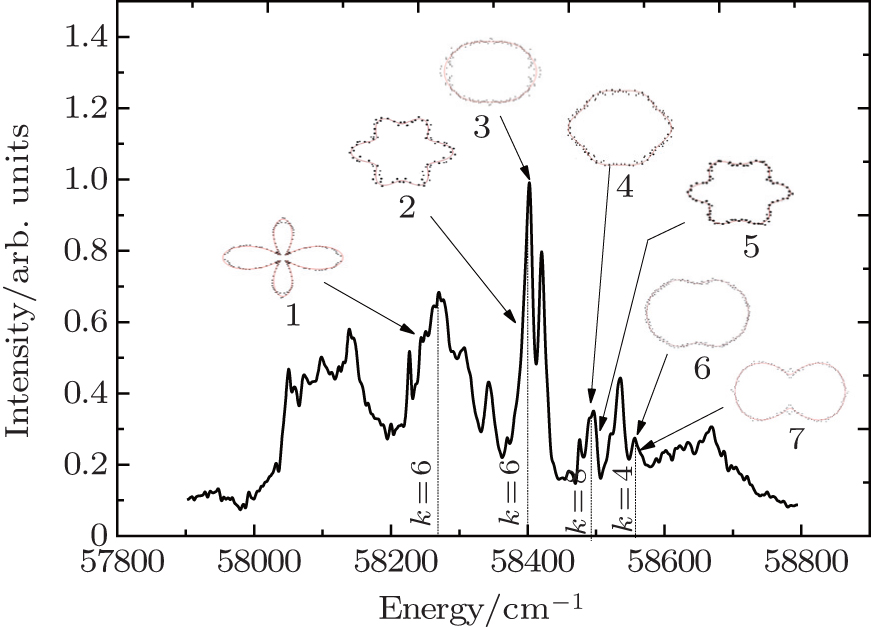
Now we can discuss the AD results of the Eu 4f76p1/26d autoionizing states. In order to see the differences clearly, they are classified by the three excitation paths defined in Section 2. For instance, both the spectrum and the AD obtained with path I are shown in Fig. 5.
 | Fig. 5. Spectrum and AD of the Eu 4f76p1/26d autoionizing state, obtained with path I. |
It is worth noting that an AD diagram may be generated for every point in Fig. 5, but only some examples marked are shown in the spectrum, some of which are marked with their k values. Note that unlike the marks in Fig. 4, the mark does not necessarily correspond to a peak in the spectrum. Since the k value depends on the J value, J and k values may result in not only different kinds of ADs, but also the apparent energy dependence of the AD.
In order to make a comparison of the different excitation paths, another example, obtained with path II, is shown in Fig. 6.
 | Fig. 6. Spectrum and AD of the Eu 4f76p1/26d autoionizing state, obtained with path II. |
Some apparent differences can be found if one examines Fig. 6 carefully. The symmetry of several ADs here seems to be more complicated than those shown in Fig. 5, especially at the energy points on the right side of the two figures. Furthermore, there is a relation between the symmetry of ADs and the features in the spectra. Namely, whenever a feature (or a peak) in each of the spectra is changing, no matter whether it increases or decreases, the pattern of the AD also changes drastically, which has a distinct difference from those either on the top or at the bottom of each of the spectrum peaks.
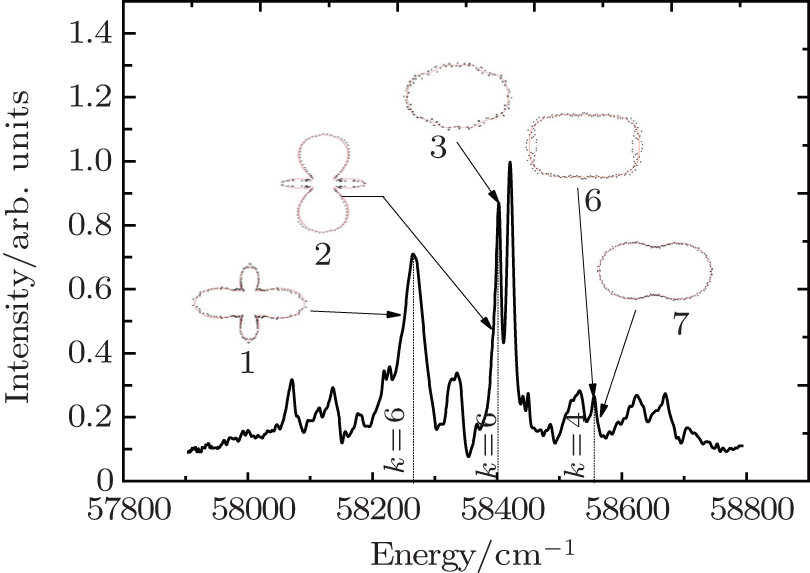
The last example of the spectrum and the AD, obtained with path III is shown in Fig. 7.
 | Fig. 7. Spectrum and AD of the Eu 4f76p1/26d autoionizing state, obtained with path III. |
As seen from Fig. 7, the pattern of ADs around point 8 is most complex, as expected, since the k = kmax = 10 there.
A comparison of Figs. 5– 7 shows evidently that the kmax values are different, which are 6, 8, and 10, respectively. In addition, several points can be made from the above comparisons. First, the AD patterns at the same energy point with different paths are similar, such as those at the energy points marked with 2 and 5. Second, the less the k value, the less complex the pattern of the AD is, such as those at the energy points marked with 3, 6, and 7, respectively.
As shown in Figs. 5– 7, the patterns of the ADs have been displayed explicitly at the energy points marked with 1– 8. Therefore, for reference purposes, it is helpful to tabulate their locations in terms of their term energy, the sum of photon energies of the three lasers, as shown in Table 2.
| Table 2. Term energies of the eight points labeled in Figs. 5– 7. |
According to the different AD patterns shown in Figs. 5– 7, we discuss their physical mechanisms. First, although the same electronic configuration, 4f76p1/26d is concerned, the different atomic autoionizing states have been populated with the three excitation paths in the present work, leading to various autoionization spectra and different sorts of ADs shown above. Secondly, as mentioned in Section 1, unlike the total cross section, which is dependent only on the amplitude of atomic wave function, the differential cross section illustrates the directions of the movement of electrons ejected from autoionizing states, reflecting the dynamical characteristics of the autoionization process. The different AD patterns manifest a sensitive test to the wave function of the Eu atom in terms of their phase information, which is lost in any autoionization spectrum.[5, 6] Finally, the quasi-continuum characteristics of autoionizing states play an important role in the AD patterns in terms of their Rydberg– continuum coupling strength.[20] For instance, the AD patterns are more complex in the off-peak regions, such as the energy points marked with 1, 2, 5, and 8, in Figs. 5– 7. This phenomenon can be understood by their differences in Rydberg– continuum coupling, which is weaker at the peak than at other positions. In the off-peak regions, the lower probability of autoionization may lead to stronger Rydberg– continuum coupling, thereby gaining more diversity of the AD patterns.
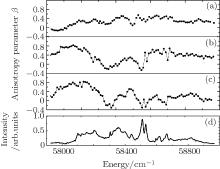
Turning to the anisotropy parameters, which can be obtained by fitting the AD pattern to Eq. (12) for each energy point, it is found that the Legendre polynomials of higher orders play little role in the AD. Thus, only the anisotropy parameters for Legendre polynomials up to the 6th order will be displayed here. Let β = α 2/α 0, γ = α 4/α 0, and ε = α 6/α 0, whose variations with energy are the main concern here. The β spectrum is shown in Fig. 8.
 | Fig. 8. The β spectra relating to (a) 5d+ , (b) 6s+ (J = 3), (c) 6s+ (J = 4) ionization limits, and (d) the autoionization spectrum, obtained with path II. |
As shown in Fig. 8, the β parameter has an apparent dependence of energy within the autoionization spectrum, and varies when the atom decays to different ionization limits. The three spectra of the β parameter corresponding to the decays to the 5d+ , 6s+ (J = 3), and 6s+ (J = 4) ionization limits seem to be quite different, especially the one corresponding to the 5d+ decay varies in a much smaller range. The above differences may be due to the fact that the ejected electron is much slower for the 5d+ decay than for the two 6s+ decays.
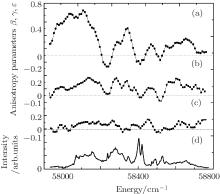
The comparison among the anisotropy parameters, β , γ , and ε , can be made from Fig. 9, where their dependences on energy are shown, together with the autoionization spectrum obtained with path II.
 | Fig. 9. Spectra of the anisotropy parameters relating to the 6s+ (J = 4) ionization limit and autoionization spectrum obtained with path II. (a) β , (b) γ , (c) ε , and (d) autoionization spectrum. |
As can be seen from Fig. 9, all the anisotropy parameters characterizing the AD of the Eu 4f76p1/26d autoionizing state are dependent on energy, and the amplitudes of their variations are different significantly. Namely, the higher order the anisotropy parameter, the smaller the variation amplitude is. For instance, the variation amplitude of the β is three times greater than that of the ε , indicating the lowest order has a greatest influence and contribution to the AD, while those of higher orders only offer some complementary contributions. The above tendency makes it reasonable to only display the spectra of anisotropy parameters up to the 6th order in Eq. (12) as illustrated in Figs. 8 and 9.
Although the spectra of anisotropy parameters greater than the 6th orders are not shown due to their negligible amplitudes of variation with energy, their contributions to the AD are taken into account in the fitting process. As stated earlier, their role played in the AD is little in terms of variation amplitude, their contributions, however, should not be neglected, which is forecasted by Eq. (12). They are expected to generate some small but exquisite structures on the ADs as verified by the patterns of the ADs shown in Figs. 5– 7.
Finally, we make some comparisons between the studies on the ADs of the Eu 4f76p1/28s[11] and 4f76p1/26d autoionizing states. Unlike their alkaline-earth counterparts, the Mg 3pns and 3pnd autoionizing states, [5, 6] whose initial states are spherically symmetric 3sns 1S0 and non-spherically symmetric 3snd 1D2, respectively, neither the initial states of the Eu 4f76p1/28s[11] and 4f76p1/26d autoionizing states, nor the 4f76p1/28s and 4f76p1/26d, are spherically symmetric. Therefore, the ADs of the Mg 3pns and 3pnd autoionizing states, characterized with 1 and 3 anisotropy parameters, respectively, have a sharp difference, while the difference in AD between the Eu 4f76p1/28s and 4f76p1/26d autoionizing states becomes blurry since both of them require 3 or more anisotropy parameters.
Both the spectra and the AD of the Eu 4f76p1/26d autoionizing states are investigated systematically with the three excitation paths, allowing one to explore their characteristics and to gain physical insight. Either the irregular features or the multi-peak profiles manifested in their autoionization spectra reflect the complexity of the spectroscopic properties of the Eu atom.
The exact expression for the AD of the Eu 4f76p1/26d autoionizing state is derived to fit the experimental data on the AD, characterized by five anisotropy parameters. The dependences of the AD on photon energy, excitation path, and the decay route are illustrated through discussion. The variations with photon energy of anisotropy parameters show no apparent regularity, owing to the heavy interactions from the 5dnl autoionizing states above the two 
The comparisons of the ADs of the Eu 4f76p1/28s autoionizing states indicate less contrast between the Eu 4f76p1/28s and 4f76p1/26d autoionizing states in terms of their ADs than between their counterparts in the alkaline-earth atoms.
| 1 |
|
| 2 |
|
| 3 |
|
| 4 |
|
| 5 |
|
| 6 |
|
| 7 |
|
| 8 |
|
| 9 |
|
| 10 |
|
| 11 |
|
| 12 |
|
| 13 |
|
| 14 |
|
| 15 |
|
| 16 |
|
| 17 |
|
| 18 |
|
| 19 |
|
| 20 |
|